

Background: Monocarboxylate transporters (MCTs) mediate the shuttling of high-energy metabolites between different cells.
Results: Transport activity of MCTs is augmented by intracellular and extracellular carbonic anhydrases (CAs).
Conclusion: Intracellular and extracellular CAs can work in concert to ensure rapid shuttling of metabolites across the cell membrane.
Significance: CAs play a pivotal role as regulators of metabolite transport in different tissues.
Keywords: Ion-sensitive Electrodes, Lactic Acid, pH Regulation, Protein Complexes, Protein Expression, Proton-collecting Antenna, Transport Metabolon, Xenopus Oocytes
Abstract
Proton-coupled monocarboxylate transporters (MCTs) are carriers of high-energy metabolites such as lactate, pyruvate, and ketone bodies and are expressed in most tissues. It has previously been shown that transport activity of MCT1 and MCT4 is enhanced by the cytosolic carbonic anhydrase II (CAII) independent of its catalytic activity. We have now studied the influence of the extracellular, membrane-bound CAIV on transport activity of MCT1/4, heterologously expressed in Xenopus oocytes. Coexpression of CAIV with MCT1 and MCT4 resulted in a significant increase in MCT transport activity, even in the nominal absence of CO2/HCO3−. CAIV-mediated augmentation of MCT activity was independent of the CAIV catalytic function, since application of the CA-inhibitor ethoxyzolamide or coexpression of the catalytically inactive mutant CAIV-V165Y did not suppress CAIV-mediated augmentation of MCT transport activity. The interaction required CAIV at the extracellular surface, since injection of CAIV protein into the oocyte cytosol did not augment MCT transport function. The effects of cytosolic CAII (injected as protein) and extracellular CAIV (expressed) on MCT transport activity, were additive. Our results suggest that intra- and extracellular carbonic anhydrases can work in concert to ensure rapid shuttling of metabolites across the cell membrane.
Introduction
Monocarboxylate transporters (MCT, SLC16)2 are carriers of high-energy metabolites, such as lactate, pyruvate, and ketone bodies. The SLC16 gene family comprises 14 isoforms, the first four of which (MCT isoforms 1–4) have been reported to transport monocarboxylates in an electroneutral transport mode of 1 H+ : 1 monocarboxylate with different substrate affinities (1). MCT1, which is found in nearly all tissues studied so far, has a Km value of 3–5 mm for l-lactate (2, 3). MCT4 is a low-affinity, high-capacity carrier with a Km value for lactate of 17–35 mm (4), and is found prominently in glycolytic tissues such as e.g. white skeletal muscle fibers and astrocytes (1, 5, 6). This suggests that MCT4 is the main pathway to export lactate out of glycolytic cells, which may produce larger amounts of lactate during metabolic demand, while MCT1 can both serve as a lactate importer and exporter. MCT1 and MCT4 require the ancillary protein CD147 (basigin, EMMPRIN), an analog of which is intrinsically expressed in Xenopus oocytes, for proper expression in the plasma membrane and hence transport activity (7–9).
Mammalian carbonic anhydrases (CA) included in the α-class of CAs, of which 16 isoforms are identified, catalyze the reversible hydration of CO2 to HCO3− and H+ (10, 11). CAII is found in the cytosol, while CAIV is linked to the extracellular surface of the cell membrane via a glycosyl-phosphatidyl-inositol (GPI) anchor (12, 13). Both the intracellular isoform CAII and the extracellular isoform CAIV have been found to interact with different acid/base transporting proteins: In vitro studies and experiments using heterologous protein expression revealed that CAII binds to, and enhances the activity of, the chloride/bicarbonate exchanger AE1 (14, 15), the sodium-bicarbonate cotransporter NBCe1 (16, 17), the sodium/hydrogen exchanger NHE1 (18, 19) and the monocarboxylate transporters MCT1 and MCT4 (20–24). Extracellular CAIV has been shown to interact with NBCe1 (15, 25), AE1 (15, 26) and MCT2 (27). (For review of the various types of transport metabolons see Refs. 28–30.)
We have recently shown that CAII can enhance transport activity of MCT1 and MCT4, when heterologously expressed, or injected as protein, in Xenopus oocytes, in a non-catalytic manner, and have proposed that CAII acts as a so called “proton-collecting antenna” for the transporter, presumably by dissipating intracellular proton microdomains via an intramolecular proton shuttle (20–24). Proton shuttling requires close proximity between transporter and enzyme, which is achieved for MCT1 and CAII by binding of CAII to the acidic cluster E489EE in the C-terminal tail of MCT1 (31). In contrast to MCT1 and MCT4, CAII failed to alter transport activity of the high-affinity monocarboxylate transporter MCT2 (27), possibly because it lacks the appropriate binding domain.
In the present study, we have tested whether extracellular CAIV can increase transport activity of MCT1 and MCT4 when heterologously coexpressed in Xenopus oocytes, and whether intracellular CAII and extracellular CAIV act independently and can cooperate to drive MCT1 and 4 transport activity. Our results show that transport activity of MCT1 and MCT4 is enhanced by CAIV in a non-catalytic manner, and that additional injection of CAII protein into MCT1/4+CAIV-coexpressing oocytes increased MCT activity even further. This suggests that intra- and extracellular CA isoforms can functionally cooperate to enhance transport activity of the acid/base-coupled metabolite carriers MCT1 and MCT4.
EXPERIMENTAL PROCEDURES
Constructs, Oocytes, and Injection of cRNA and Protein
Human CAIV-WT and the CAIV mutant V165Y were provided by Dr. William S. Sly, St. Louis and subcloned into the oocyte expression vector pGEM-He-Juel, which contains the 5′ and the 3′ untranscribed regions of the Xenopus β-globin flanking the multiple cloning site. cDNA coding for rat MCT1 and rat MCT4, cloned into the oocyte expression vector pGEM-He-Juel, was kindly provided by Dr. Stefan Bröer, Canberra (3, 4). Plasmid DNA was transcribed in vitro with T7 RNA-Polymerase (mMessage mMachine, Ambion Inc., Austin) as described earlier (32). Xenopus laevis females were purchased from Xenopus Express, Vernassal, France. Segments of ovarian lobules were surgically removed under sterile conditions from frogs anesthetized with 1 g/liter of 3-amino-benzoic acid ethylester (MS-222, Sigma-Aldrich, Taufkirchen, Germany), and rendered hypothermic. The procedure was approved by the Landesuntersuchungsamt Rheinland-Pfalz, Koblenz (23 177-07/A07-2-003 §6). As described earlier (32), oocytes were singularized by collagenase (Collagenase A, Roche, Mannheim, Germany) treatment in Ca2+-free oocyte saline (pH 7.8) at 28 °C for 2 h. The singularized oocytes were left overnight in an incubator at 18 °C in Ca2+-containing oocyte saline (pH 7.8) to recover. Oocytes of the stages V and VI were injected with 5 ng of cRNA coding for MCT1 or MCT4, either together with 2 ng of cRNA coding for CAIV or alone. Measurements were carried out 3 to 6 days after injection of cRNA. CAII and CAIV were also directly injected as protein. For injection of protein, 50 ng of CAII, isolated from human erythrocytes, or 35 ng of CAIV, isolated from secretion medium of CHO cells expressing recombinant proteins (kindly provided by Dr. William S. Sly, St. Louis), dissolved in 27.6 nl of DEPC-H2O, were injected 12–24 h before electrophysiological measurements. Isolation of CAII and CAIV from human erythrocytes and from secretion medium of CAIV-expressing CHO cells, respectively, as well as purification of the proteins with CA inhibitor columns has been described in detail previously (33–35).
The oocyte saline had the following composition (in mm): NaCl, 82.5; KCl, 2.5; CaCl2, 1; MgCl2, 1; Na2HPO4, 1; HEPES, 5; titrated with NaOH to pH 7.0. In lactate-containing saline, NaCl was replaced by an equivalent amount of Na-l-lactate. In the bicarbonate-containing saline, NaCl was replaced by an equivalent amount of NaHCO3, and the solution was aerated with 5% CO2/95% O2. Application of lactate was carried out in HEPES-buffered solution at pH 7.0 in the nominal absence of CO2/HCO3−, containing around 0.008 mm of CO2 from air and hence a HCO3− concentration of less than 0.2 mm and in 5% CO2/10 mm HCO3−-buffered solution (pH 7.0), respectively.
Immunohistochemical Analysis of MCT1, MCT4, and CAIV
Xenopus oocytes, expressing MCT1 and MCT4, respectively, either alone or together with CAIV, as well as native control oocytes were fixed in 4% paraformaldehyde in phosphate-buffered saline (PBS; Roti-Histofix 4%, Roth, Karlsruhe, Germany) 4 days after cRNA injection. Oocytes were treated with 100% methanol and permeabilized with 0.1% Triton X-100 (Sigma-Aldrich). Unspecific binding sites were blocked with 3% bovine serum albumin (BSA; Sigma-Aldrich), 1% normal goat serum (NGS; Sigma-Aldrich) or 1% normal donkey serum (Sigma-Aldrich), depending on the origin of the secondary antibody. Intact oocytes were incubated in PBS containing the primary antibody against MCT1 (1:200; chicken anti-rat MCT1 polyclonal antibody (AB1286), Millipore, Temecula), MCT4 (1:300; rabbit anti-rat MCT4 polyclonal antibody (AB3314P), Millipore, Temecula) or CAIV (1:25 mouse anti-human CAIV monoclonal antibody (MAB2186), R&D Systems GmbH, Wiesbaden-Norderstedt, Germany) overnight at 4 °C. After washing, oocytes were incubated in PBS with the secondary antibody (Alexa Fluor 546 donkey anti-mouse IgG (A10036), Alexa Fluor 488 donkey anti-rabbit IgG (A-10040) or Alexa Fluor 488 goat anti-chicken IgG (A-11039), Invitrogen GmbH, Darmstadt) at a 1:100 dilution. Oocytes were then analyzed with a confocal laser-scanning microscope (LSM 700, Carl Zeiss GmbH, Oberkochen, Germany).
Western Blot Analysis
For comparison of protein levels of expressed MCT1, MCT4, and CAIV, Western blot analyses were performed. For each sample 20 oocytes were lysed by sonication in 2% sodium dodecylsulfate solution with protease inhibitor (Complete Mini EDTA-free, Roche, Mannheim, Germany) 4 days after injection of cRNA. Total protein content was determined using BCA protein assay kit (Pierce, Fisher Scientific GmbH, Schwerte, Germany). Extracts were separated by 4–12% SDS-polyacrylamide gel electrophoresis (SDS-PAGE) and transferred to nitrocellulose membranes. Proteins of interest were detected by antibody staining, using the following antibodies: MCT1 (1:200; chicken anti-rat MCT1 polyclonal antibody (AB1286), Millipore, Temecula), MCT4 (1:250; rabbit anti-rat MCT4 polyclonal antibody (AB3314P), Millipore) or CAIV (1:300 mouse anti-human CAIV monoclonal antibody (MAB2186), R&D Systems GmbH, Wiesbaden-Norderstedt, Germany). As a loading control, β-tubulin was labeled with anti-β-tubulin mouse monoclonal antibody (diluted 1:4000; Sigma Aldrich). Primary antibodies were labeled with goat anti-mouse, goat anti-rabbit or rabbit anti-chicken IgG horseradish peroxidase-conjugated secondary antibody (diluted 1:4000; Santa Cruz Biotechnology Inc.). Membranes were analyzed after incubation with Lumi-Light Western blotting substrate (Roche) with a Versa Doc imaging system (Bio-Rad). Quantification of MCT1 and MCT4 protein was carried out with the software Quantity One 4.5 (Bio-Rad). For each protein band the pixel density per square millimeter was calculated and background pixel density subtracted. To allow comparison of different Western blots, all measured protein concentrations on one blot were normalized to the concentration of one protein on the same blot.
Determination of Intra- and Extracellular CA Activity by Mass Spectrometry
Intra- and extracellular activity of CA was determined by monitoring the 18O depletion of doubly labeled 13C18O2 through several hydration and dehydration steps of CO2 and HCO3− at 25 °C in intact and lysed oocytes, respectively (36–38). The reaction sequence of 18O loss from 13C18O18O (m/z = 49) over the intermediate product 13C18O16O (m/z = 47) and the end product 13C16O16O (m/z = 45) was monitored with a quadrupole mass spectrometer (OmniStar GSD 320; Pfeiffer Vaccum, Asslar, Germany). The relative 18O enrichment was calculated from the measured 45, 47, and 49 abundance as a function of time according to: log enrichment = log [49 × 100/(49 + 47 + 45)]. For the calculation of CA activity, the rate of 18O degradation was obtained from the linear slope of the log enrichment over the time, using the spreadsheet analyzing software OriginPro 8.6 (OriginLab Corporation, Northampton). For the experiments, the cuvette was filled with 6 ml of oocyte saline, pH 7.4. After addition of 13C18O2 the spontaneous degradation was measured for 5 min. For determination of extracellular CA activity batches of 100 CAIV-WT-expressing oocytes were added to the cuvette and the catalyzed degradation was determined for 10 min. Batches of 100 native oocytes were used as control. To determine total CA activity batches of 20 oocytes expressing CAIV and native oocytes, respectively, were lysed in 80 μl of oocyte saline and pipetted into the cuvette. To obtain the catalytic activity mediated by CA, the values of native oocytes were subtracted from the total catalytic activity of both intact and lysed oocytes expressing CAIV. The system was calibrated by determining the catalytic activity of 50, 100, 200, and 300 ng of isolated CAIV protein directly added to the cuvette. Based on this calibration total extra- and intracellular CAIV concentrations were calculated from the catalytic activity measured in intact and lysed CAIV-expressing oocytes.
Intracellular pH Measurements
Changes in intracellular proton concentration in oocytes were determined with ion-selective microelectrodes under voltage-clamp conditions. For measurement of intracellular pH and membrane potential, double-barreled microelectrodes were used; the manufacture and application have been described in detail previously (32, 39). For calibration, electrodes were perfused with HEPES-buffered oocyte saline, pH 7.0. After a stable electrode potential was reached, oocyte saline, pH 6.4, was applied until the electrode again reached a stable potential.
For two electrode voltage clamp a borosilicate glass capillary, 1.5 mm in diameter, was pulled to a micropipette and backfilled with 3 m KCl. This electrode was used for current injection and was connected to the head-stage of an Axoclamp 2A amplifier (Axon Instruments). The actual membrane voltage was recorded by the reference barrel of the double-barreled pH-sensitive microelectrode. Oocytes were clamped to a holding potential of −40 mV.
As described previously (3), optimal intracellular pH changes were detected when the ion-selective electrode was located near the inner surface of the plasma membrane. All experiments were carried out at room temperature.
Calculation of [H+]i
The measurements of pHi were stored digitally using homemade PC software based on the program LabView (National Instruments Germany GmbH, München, Germany) and were routinely converted into intracellular H+ concentration, [H+]i. This should provide changes in the [H+]i, which take into account the different pH baseline, as e.g. measured in HEPES- and CO2/HCO3−-buffered salines (32). The rate of change of the measured [H+]i was analyzed by determining the slope of a linear regression fit using the spreadsheet program OriginPro 8.6.
Calculation of Buffer Capacity (β) and Proton Fluxes (JH)
Intrinsic buffer capacity βi was calculated from the change in pHi (amplitude) when changing from HEPES- to 5% CO2/10 mm HCO3−-buffered saline. The CO2-dependent buffer capacity, βCO2, was calculated from the intracellular bicarbonate concentration (βCO2 = 2.3 × [HCO3−]), which was obtained from the Henderson-Hasselbalch equation, assuming a [CO2] of 1.33 mm in a solution aerated with 5% CO2. The total buffer capacity, βt, was defined as the sum of βi and βCO2.
Net H+ fluxes JH (mm/min), defined as the net transport of acid and/or base equivalents across the cell membrane was calculated as the product of the rate of change in intracellular pH and the total buffer capacity βt for lactate application in the presence of CO2/HCO3−. For application of lactate in the nominal absence of CO2/HCO3−, JH was calculated using the intrinsic buffer capacity βi (32).
Statistics
Statistical values are presented as means ± S.E. of the mean. For calculation of significance in differences, Student's t test or, if possible, a paired t test was used. In the figures shown, a significance level of p ≤ 0.05 is marked with *, p ≤ 0.01 with ** and p ≤ 0.001 with ***.
RESULTS
Expression of Extracellular CAIV Alters Transport Activity of MCT1 and MCT4 in Xenopus Oocytes in a Non-catalytic Manner
We have previously shown that expression of extracellular, membrane-bound CAIV can enhance transport activity of the high-affinity monocarboxylate transporter MCT2 by a non-catalytic interaction. To investigate whether CAIV does augment transport activity of the monocarboxylate transporters MCT1 and MCT4, we coexpressed CAIV together with MCT1 and MCT4, respectively. Transport activity of MCT was determined by application of 3 and 10 mm lactate in the nominal absence and in the presence of 5% CO2/10 mm HCO3− (pH 7.0) before and during application of 10 μm of the CA inhibitor 6-ethoxy-2-benzothiazolesulfonamide (EZA), as shown for MCT1 in Fig. 1A. Both in the absence and in the presence of CO2/HCO3−, coexpression of MCT1 with CAIV led to a ∼2-fold increase in MCT1 activity as determined from the rate of lactate-induced acidification (Δ[H+]/Δt) (Fig. 1, B and C). In both cases, the CAIV-induced increase in MCT1 activity was insensitive to the inhibition of CAIV catalytic activity by EZA (Fig. 1, A–C). Inhibition of CAIV catalytic activity by EZA was confirmed by application of CO2/HCO3− (Fig. 1A): The rate of CO2-induced acidification was increased by a factor of 7 with 257.0 ± 19.7 nm/min in MCT1+CAIV-expressing oocytes as compared with 36.8 ± 3.5 nm/min in non-CA-expressing cells (p ≤ 0.001). In the presence of 10 μm EZA, the rate of acidification significantly decreased to 64.35 ± 4.5 nm/min in MCT1+CAIV-expressing oocytes (p ≤ 0.001), while no difference was observed in non-CA-expressing cells (35.5 ± 4.1 nm/min; data not shown). Expression of CAIV not only increased the rate of lactate-induced acidification, but also doubled the rate of change in intracellular alkalinization during removal of lactate in the absence and presence of CO2/HCO3− and EZA (Fig. 1, D and E), which indicates that CAIV enhances MCT activity in both directions, influx and efflux of lactate.
FIGURE 1.

Transport activity of MCT1 is enhanced by CAIV in a non-catalytic manner. A, original recordings of [H+]i in Xenopus oocytes either expressing MCT1+CAIV (upper trace) or MCT1 alone (lower trace), during application of 3 and 10 mm lactate in the nominal absence and in the presence of 5% CO2/10 mm HCO3− (pHo 7.0) before and during application of 10 μm EZA. Rate of change in [H+]i induced by application (B, C) and removal (D, E) of lactate in oocytes expressing MCT1 and MCT1+CAIV, respectively, in the nominal absence (B, D) or presence (C, E) of 5% CO2/10 mm HCO3− in the absence and presence of 10 μm EZA. F, rate of change in [H+]i induced by application of lactate in oocytes expressing MCT1, either alone or together with CAIV-WT or the catalytically inactive mutant CAIV-V165Y, in the nominal absence of CO2/HCO3−. G, rate of change in [H+]i induced by application of 5% CO2/10 mm HCO3− in oocytes expressing MCT1, MCT1+CAIV-WT or MCT1+CAIV-V165Y. Asterisks at the bars for MCT1+CAIV-coexpressing oocytes refer to the values of MCT1-expressing cells.
To confirm that CAIV-induced augmentation in MCT transport activity is independent from CAIV catalytic activity, we coexpressed MCT1 with the catalytically inactive CAIV mutant CAIV-V165Y. Coexpression of MCT1 with CAIV-V165Y resulted in virtually the same rate of lactate-induced acidification as did coexpression of MCT1 with CAIV-WT (Fig. 1F); however, the rate of acidification induced by application of 5% CO2/10 mm HCO3− confirmed the lack of catalytic activity of CAIV-V165Y in contrast to CAIV-WT (Fig. 1G).
It has been shown for different cells that catalytic activity of carbonic anhydrase can influence intracellular buffer capacity (40, 41). Therefore we determined the intrinsic (βi) and CO2/HCO3−-dependent buffer capacity (βCO2) of the oocyte cytosol with and without CAIV. The total buffer capacity (βt) was calculated from the sum of βi and βCO2 (see “Experimental Procedures”). As seen in Fig. 2A, the buffer capacity remained unaffected by CAIV both in the absence and presence of EZA, indicating that CAIV does not contribute to global cytoplasmic proton buffering of oocytes. However, this does not exclude that CAIV might still contribute to the local buffer capacity at the extracellular surface of the cell membrane, where CAIV is colocalized with MCT1 and MCT4, respectively (see Fig. 4, A and D).
FIGURE 2.

CAIV does not alter buffer capacity, but lactate-induced acid/base fluxes. A, CO2/HCO3−-dependent buffer capacity (βCO2), intrinsic buffer capacity (βi), and total buffer capacity (βt) of oocytes expressing MCT1 or MCT1+CAIV before and during application of 10 μm EZA as determined by application of 5% CO2/10 mm HCO3− (as shown in Fig. 1A). Proton flux (JH) in MCT1 and MCT1+CAIV-expressing oocytes, respectively, as induced by application of 3 and 10 mm lactate before and after addition of EZA in the nominal absence (B) and in the presence (C) of CO2/HCO3− (as shown in Fig. 1A).
FIGURE 4.

Fluorescence staining of MCT1, MCT4, and CAIV in oocytes coexpressing MCT1+CAIV (A) and MCT4+CAIV (D), respectively (upper rows). For control MCT1- and MCT4-expressing oocytes were stained against CAIV and CAIV-expressing oocytes were stained against MCT1 or MCT4. Native oocytes were double-stained against MCT1/4 and CAIV (lower rows). B, Western blot for CAIV, MCT1 and β-tubulin (as loading control) in native (N), MCT1- (M), and MCT1+CAIV-expressing oocytes (M+C). C, quantification of the protein level of MCT1 in MCT1+CAIV-expressing oocytes relative to the protein level in oocytes expressing MCT1 alone. E, Western blot for CAIV, MCT4 and β-tubulin (as loading control) in native (N), MCT4- (M), and MCT4+CAIV-expressing oocytes (M+C). F, quantification of the protein level of MCT4 in MCT4+CAIV-expressing oocytes relative to the protein level in oocytes expressing MCT4 alone.
With the buffer capacity known, the rate of H+ flux (JH) can be calculated from the rate of change in intracellular pH. Since the global oocyte buffer capacity was not affected (Fig. 2A), the rate of H+ flux reflected a difference between MCT1 and MCT1+CAIV-expressing oocytes that was similar to the rate of change in intracellular H+ concentration (Fig. 2, B and C): Both in the nominal absence (Fig. 2B) and in the presence of CO2/HCO3− (Fig. 2C), CAIV led to ∼2-fold increase in JH. Under both conditions this augmentation in transport activity was not altered by the application of EZA, indicating that CAIV catalytic activity is dispensable for MCT transport function. Interestingly, only minor differences in JH could be observed between lactate application in CO2/HCO3−-buffered solution and in the nominal absence of CO2/HCO3−, although intracellular buffering power doubled in the presence of CO2/HCO3− (βi versus βt). A possible explanation for this effect is that the increase in intracellular buffering power makes up for the decrease in the proton gradient due to the CO2-induced decrease in intracellular pH from 7.3 in HEPES-buffered to 6.8 in CO2/HCO3−-buffered solution.
Determination of CAIV Expression and Activity
We have shown previously that CAIV can display not only extracellular, but also robust intracellular catalytic activity in CAIV-expressing Xenopus oocytes and in mouse neurons in situ (38). Therefore we determined the expression level of intra- and extracellular CAIV in Xenopus oocytes at different amounts of injected cRNA. Although the level of expressed CAIV increased with increasing amounts of injected cRNA, the relative distribution of CAIV consistently showed ∼25% extracellular and ∼75% intracellular CAIV (Fig. 3E). To investigate whether the CAIV-mediated augmentation in MCT transport activity is mediated by intra- or extracellular CAIV, we either coexpressed MCT4 with CAIV, yielding both intra- and extracellular CAIV, or directly injected 35 ng of purified CAIV protein 1 day before the measurements. Since the mature protein lacks the GPI anchor and presumably cannot be incorporated into the cell membrane, injection of CAIV protein will only result in intracellular, but no extracellular CAIV.
FIGURE 3.

Transport activity of MCT1 and MCT4 is enhanced by coexpression of CAIV, but not by injection of CAIV protein. A, original recordings of [H+]i in Xenopus oocytes either expressing MCT4 (black trace) or co-expressing MCT4+CAIV (blue trace) and MCT4-expressing oocytes, additionally injected with 35 ng of mature CAIV protein (green trace) during application of 3 and 10 mm lactate and 5% CO2/10 mm HCO3− in the absence and presence of 30 μm EZA. B, rate of change in [H+]i induced by application of lactate in oocytes expressing MCT4 or co-expressing MCT4+CAIV and MCT4-expressing oocytes, additionally injected with CAIV protein in the absence and presence of EZA. C, rate of change in [H+]i induced by application of 5% CO2/10 mm HCO3− in oocytes expressing MCT4 or co-expressing MCT4+CAIV and MCT4-expressing oocytes, additionally injected with CAIV protein in the absence and presence of EZA. D, rate of change in [H+]i induced by application of lactate in oocytes expressing MCT1 or co-expressing MCT1+CAIV and MCT1-expressing oocytes, additionally injected with CAIV. Asterisks at the bars for MCT1+CAIV-coexpressing oocytes refer to the values of MCT1-expressing cells. E, amount of extracellular (blue bars) and intracellular (orange bars) localized CAIV in oocytes injected with 0.5, 1, 3, and 6 ng of CAIV-coding cRNA, as determined by mass-spectrometric analysis. The percent values indicate the relative amount of extracellular CAIV.
Catalytic activity of cytosolic CAIV was monitored by the rate of intracellular acidification induced by 5% CO2/10 mm HCO3− (Fig. 3, A and C). Since CA increases the rate of conversion of CO2, entering the oocyte, to HCO3− and H+, the rate of the CO2-induced acidification can be taken as a direct measure for intracellular CA activity. Both injection of cRNA coding for CAIV and injection of mature CAIV protein lead to a significant increase in intracellular CA activity, which can be inhibited by EZA (Fig. 3C).
Transport activity of MCT4 was determined by application of 3 and 10 mm lactate in the nominal absence of CO2/HCO3−, before and during application of 30 μm EZA (Fig. 3A). Like transport activity of MCT1, activity of MCT4 was significantly increased by coexpression of CAIV, both in the absence and presence of EZA. However, no increase in MCT4 transport activity could be observed when purified CAIV protein was injected into MCT4-expressing oocytes instead of coexpressing CAIV by injection of cRNA (Fig. 3B). The same observation could be made when CAIV protein was injected into oocytes expressing MCT1 (Fig. 3D). Therefore, it can be concluded that CAIV-mediated augmentation of MCT transport activity requires the enzyme to be localized at the extracellular surface of the plasma membrane.
Determination of Expression Levels in Oocytes
Localization of MCT1, MCT4, and CAIV at the oocyte plasma membrane was shown by antibody staining of intact oocytes (Fig. 4, A and D). To make sure that the observed CAIV-mediated increase in MCT transport activity is not due to an increase in the expression level of the transporters, we performed quantitative Western blot analysis of MCT1, MCT4, and CAIV protein in oocytes: Coexpression of CAIV did not induce an up-regulation of MCT expression, but led to a significant decrease in the expression level of MCT1 by 26% (Fig. 4, B and C) and MCT4 by 22% (Fig. 4, E and F). Therefore, the observed increase in the rate of proton/lactate cotransport is attributable to a CAIV-mediated increase in MCT transport function, which seems to be underestimated by up to 25%, rather than an increase in the expression level of transport protein when coexpressed with CAIV.
Cytosolic CAII and Membrane-bound CAIV Can Functionally Cooperate
Since both CAII and CAIV enhance transport activity of MCT1 and MCT4, respectively, we asked, whether CAII and CAIV can cooperate to further enhance MCT transport function. Therefore we expressed MCT1 in oocytes and either injected 50 ng of CAII protein, coexpressed MCT1 with CAIV, or injected 50 ng of CAII into oocytes coexpressing MCT1 with CAIV. Transport activity of MCT1 was again determined by application of 3 and 10 mm lactate in the nominal absence of CO2/HCO3− (Fig. 5A), while catalytic activity of CA was monitored by a pulse of 5% CO2/10 mm HCO3− (Fig. 5, A, C, E). Combination of CAII and CAIV led to a significant increase in MCT1-mediated transport activity by a factor of 3.5 as compared with MCT1 alone, while injection/expression of either CAII or CAIV only induced an increase in transport activity between 1.5 and 2.7 (Fig. 5B). The rate of alkalinization following removal of lactate was augmented by CAII and CAIV in a similar fashion as was the lactate-induced acidification: CAII and CAIV together increased MCT1 transport activity by a factor between 2.5 and 3, while each CA isoform alone increased transport activity from 1.4–2.2-fold (Fig. 5D). These results indicate that intracellular CAII and extracellular CAIV can functionally cooperate to enhance acid/base-coupled metabolite transport via MCTs, presumably independent of each other, on both sides of the cell membrane.
FIGURE 5.

Extracellular CAIV and intracellular CAII work together to enhance transport activity of MCT1. A, original recordings of [H+]i in Xenopus oocytes expressing MCT1 (black), expressing MCT1 + injected with 50 ng of CAII protein (green), coexpressing MCT1+CAIV (blue) and co-expressing MCT1+CAIV + injected with CAII protein (orange), respectively, during application of 3 and 10 mm lactate and 5% CO2/10 mm HCO3−. Rate of rise in [H+]i induced by application of lactate (B) and 5% CO2/10 mm HCO3− (C), respectively, in oocytes expressing MCT1, expressing MCT1 + injected with 50 ng of CAII protein, coexpressing MCT1+CAIV and co-expressing MCT1+CAIV + injected with CAII protein, respectively. Rate of intracellular alkalinization induced by removal of lactate (D) and 5% CO2/10 mm HCO3− (E), respectively, in oocytes expressing MCT1, expressing MCT1 + injected with 50 ng of CAII protein, coexpressing MCT1+CAIV and co-expressing MCT1+CAIV + injected with CAII protein, respectively. Asterisks at the bars for MCT1+CA refer to the values of MCT1-expressing cells.
DISCUSSION
The present study shows that extracellular CAIV enhances transport activity of MCT1 and MCT4, and that this enhancement can be augmented by additional injection of CAII protein into the cytosol. The actions of these CA isoforms on MCT activity persisted even after inhibition of the CA catalytic activity. These results suggest that extracellular and intracellular CA isoforms can cooperate functionally and appear to modulate MCT transport independently.
We have previously shown that transport activity of MCT1 and MCT4 is increased by CAII when the proteins are heterologously expressed in Xenopus oocytes (20–24). The mechanism of this augmentation has been found to be independent of the enzyme's catalytic activity, since both in the absence and in the presence of CO2/HCO3−, inhibition of CAII catalytic activity with EZA, or mutation of the enzyme's catalytic center (CAII-V143Y), had no effect on the CAII-induced increase in MCT1 and MCT4 transport activity (20–22). In contrast, removing the intramolecular H+ shuttle of CAII (CAII-H64A) led to a loss of interaction between CAII and MCT1/MCT4 (24). From this it was concluded that CAII, directly bound to the transporter, can act as a “H+-collecting antenna”, which directly supplies substrate to MCT1 and MCT4, to support proton/lactate cotransport. The necessity of such an antenna might derive from the low apparent diffusion rate of protons in a strongly buffered solution like the cytosol: It has been calculated that H+-coupled transport proteins like MCTs, whose substrate is only available at very low concentrations, transport and thus remove or deliver H+ faster from/to the immediate vicinity around the membrane carrier than H+ can diffuse into or from this microdomain. This would lead to depletion or accumulation of protons around the transporter pore and would hence impair transport activity. Therefore, the transporter must exchange H+ with protonatable sites present in membrane proteins and lipids at the plasma membrane, which need to be located in close proximity of its pore to act as an H+-collecting antenna for the transporter (24, 42).
A similar type of interaction was also observed for MCT2 and extracellular CAIV (27): Augmentation of MCT2 transport activity by CAIV did not depend on the catalytic activity of CAIV, since neither application of EZA nor coexpression of the catalytically inactive mutant CAIV-V165Y had any effect on the CAIV-mediated increase in MCT2 activity. However, the interaction required CAIV to be localized on the extracellular surface of the oocyte, as injection of CAIV protein had no effect on MCT2-transport activity. Furthermore, the interaction of MCT2 and CAIV was only detectable, when MCT2 was coexpressed with its ancillary protein GP70 (embigin). From this it was hypothesized that MCT2 and CAIV may not interact directly with each other, but may require GP70 as a mediator, possibly by allowing binding of CAIV to the immunoglobulin-like domains in the extracellular region of GP70 (27).
These data lead to the hypothesis that the CAIV-mediated increase in activity of MCT1 and MCT4, which was observed in this study might be mediated by CD147 (basigin) the ancillary protein for MCT1 and MCT4, an analog of which is endogenously present in Xenopus oocytes (9). Analogous to the reported interaction between MCT2/GP70 and CAIV (27), a direct interaction between CD147 and CAIV might bring the enzyme close enough to the transporter to function as an H+-collecting antenna for MCT1 and MCT4, respectively (Fig. 6).
FIGURE 6.
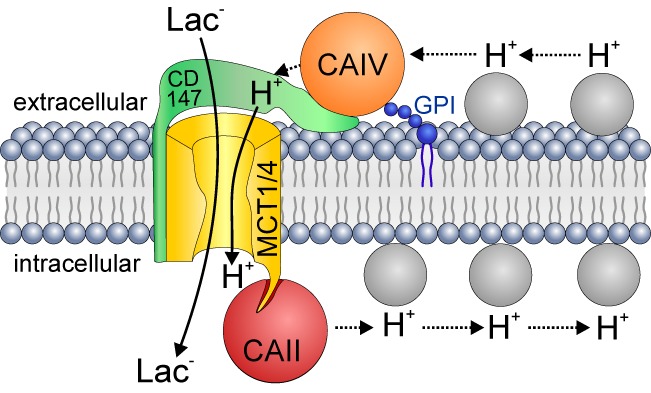
Hypothetical model of the interaction between MCT1/4, CAII, and CAIV. Extracellular CAIV (orange circle) is anchored to the extracellular side of the plasma membrane by GPI (dark blue structure). CAIV is located close to MCT1 and MCT4, respectively (yellow structure) by direct interaction with CD147 (basigin), the chaperon of the two transporters (green). On the intracellular site CAII (red circle) is located close to the transporters by binding to their C-terminal tail. In this position, CAIV and CAII can act as an extra- and intracellular proton-collecting antenna for the transporter, which shuttles protons between transport pore and surrounding protonatable residues (gray circles) to facilitate shuttling of H+ and lactate across the cell membrane.
Like in the cytoplasm, diffusion of ions in the extracellular space (ECS) is restricted. For the brain (where MCT1 and MCT4 are coexpressed with extracellular CAIV and intracellular CAII in oligodendrocytes and astrocytes, which play a crucial role in the energy supply of neurons) it has been shown, that extracellular diffusion of ions is hindered by tortuosity of the ECS, proteoglycans at the outer membrane surface, charges at the extracellular matrix, and also by extracellular buffers (43, 44). Therefore an effective co-transport of lactate and H+ across the cell membrane would be supported by an efficient proton handling on both sides of the plasma membrane.
Indeed we could show in this study that the presence of both intracellular CAII and extracellular CAIV enhance transport activity of MCT1 and MCT4 in both directions, i.e. influx and efflux of H+/lactate to a higher extant than did either isoform alone. While coexpression of either CAII or CAIV enhanced MCT1/4 transport activity by a factor of 1.5 to 2.7, the presence of both CA isoforms augmented the transport activity by a factor of up to 3.5, which was significantly greater than with either CA isoform alone.
A H+-collecting antenna on only one side of the membrane might lead to an increased formation of a proton microdomain on the other side of the membrane, since supply or removal of H+ is enhanced on the cis-side, which leads to an increase in MCT transport activity (as seen by single expression of either CAII or CAIV), which then would result in an increased accumulation or depletion of H+ at the trans-side, depending on transport direction. This formation of a H+ micro-domain would then again decrease MCT transport activity. With a H+-collecting antenna on both sides of the membrane, formation of H+ microdomains would be suppressed both at the cis- and at the trans-side. With respect to lactate/proton influx, H+ would be delivered from the extracellular antenna, mediated by CAIV, while the intracellular antenna, mediated by CAII, would remove H+ (Fig. 6). On the other hand, during lactate/proton efflux the two antennae would work in the opposite mode from that shown in Fig. 6, delivery of H+ intracellularly by CAII and removal of H+ by CAIV extracellularly. In such a scenario extracellular CAIV and intracellular CAII would cooperate by a “push and pull principle” pushing protons to the transporter on one side, and pulling them away on the other side of the cell membrane (Fig. 6). By this mechanism intracellular CAII and extracellular CAIV can cooperate to enhance metabolite transport into and out of cells by MCT1 and MCT4.
This mechanism might be of special importance for cells that transport high amounts of lactate like e.g. astrocytes in the mammalian brain. Astrocytes, which are highly glycolytic, have been shown to export lactate which is taken up by neurons for energy production, a mechanism coined “Astrocyte to Neuron Lactate Shuttle” (ANLS; 45–48). Moreover, it has been suggested, that astrocytes could also take up lactate, dependent on the concentration gradient (49). As reported before, uptake and/or release of lactate in astrocytes are mediated via MCT1 and MCT4 (50–52). Furthermore, astrocytes play a pivotal role in acid/base regulation in the brain, and thus highly express intracellular CAII and extracellular CAIV (31, 53, 54). Therefore, MCT1, MCT4, CAII, and CAIV might cooperate in astrocytes to ensure both rapid shuttling of lactate to neurons and efficient uptake of lactate from the extracellular space under different physiological conditions. However, it should be pointed out that a functional interaction between MCTs and CAIV has so far only been demonstrated in the overexpression system of the Xenopus oocyte, but has not yet been investigated in astrocytes or other tissue cells.
Acknowledgment
We thank Hans-Peter Schneider for excellent technical assistance.
The work was funded by the Deutsche Forschungsgemeinschaft (to M. K.) through the Graduate Research School (GRK 830), and (to J. W. D.) (DE 231/24-1,2), by the Landesschwerpunkt Membrantransport (to H. M. B. and J. W. D.), and the Stiftung Rheinland-Pfalz für Innovation (to H. M. B.) (961-386261/957).
- MCT
- monocarboxylate transporters
- CA
- carbonic anhydrase
- EZA
- 6-ethoxy-2-benzothiazolesulfonamide.
REFERENCES
- 1. Halestrap A. P., Meredith D. (2004) The SLC16 gene family-from monocarboxylate transporters (MCTs) to aromatic amino acid transporters and beyond. Eur. J. Physiol. 447, 619–628 [DOI] [PubMed] [Google Scholar]
- 2. Bröer S., Rahman B., Pellegri G., Pellerin L., Martin J. L., Verleysdonk S., Hamprecht B., Magistretti P. J. (1997) Comparison of lactate transport in astroglial cells and monocarboxylate transporter 1 (MCT 1) expressing Xenopus laevis oocytes. Expression of two different monocarboxylate transporters in astroglial cells and neurons. J. Biol. Chem. 272, 30096–30102 [DOI] [PubMed] [Google Scholar]
- 3. Bröer S., Schneider H., Bröer A., Deitmer J. W. (1998) Characterization of the monocarboxylate transporter 1 expressed in Xenopus laevis oocytes by changes in cytosolic pH. Biochem. J. 174, 167–174 [DOI] [PMC free article] [PubMed] [Google Scholar]
- 4. Dimmer K. S., Friedrich B., Lang F., Deitmer J. W., Bröer S. (2000) The low-affinity monocarboxylate transporter MCT4 is adapted to the export of lactate in highly glycolytic cells. Biochem. J. 350, 219–227 [PMC free article] [PubMed] [Google Scholar]
- 5. Halestrap A. P., Price N. T. (1999) The proton-linked monocarboxylate transporter (MCT) family: structure, function and regulation. Biochem. J. 343, 281–299 [PMC free article] [PubMed] [Google Scholar]
- 6. Pellerin L., Bergersen L. H., Halestrap A. P., Pierre K. (2005) Cellular and subcellular distribution of monocarboxylate transporters in cultured brain cells and in the adult brain. J Neuroscience Res. 79, 55–64 [DOI] [PubMed] [Google Scholar]
- 7. Kirk P., Wilson M. C., Heddle C., Brown M. H., Barclay A. N., Halestrap A. P. (2000) CD147 is tightly associated with lactate transporters MCT1 and MCT4 and facilitates their cell surface expression. EMBO J. 19, 3896–3904 [DOI] [PMC free article] [PubMed] [Google Scholar]
- 8. Wilson M. C., Meredith D., Halestrap A. P. (2002) Fluorescence resonance energy transfer studies on the interaction between the lactate transporter MCT1 and CD147 provide information on the topology and stoichiometry of the complex in situ. J. Biol. Chem. 277, 3666–3672 [DOI] [PubMed] [Google Scholar]
- 9. Wilson M. C., Meredith D., Fox J. E., Manoharan C., Davies A. J., Halestrap A. P. (2005) Basigin (CD147) is the target for organomercurial inhibition of monocarboxylate transporter isoforms 1 and 4: the ancillary protein for the insensitive MCT2 is EMBIGIN (gp70) J. Biol. Chem. 280, 27213–27221 [DOI] [PubMed] [Google Scholar]
- 10. Maren T. H. (1967) Carbonic anhydrase: Chemistry, physiology, and inhibition. Physiol. Rev. 47, 595–781 [DOI] [PubMed] [Google Scholar]
- 11. Imtaiyaz Hassan M., Shajee B., Waheed A., Ahmad F., Sly W. S. (2013) Structure, function and applications of carbonic anhydrase isozymes. Bioorg. Med. Chem. 21, 1570–1582 [DOI] [PubMed] [Google Scholar]
- 12. Zhu X. L., Sly W. S. (1990) Carbonic anhydrase IV from human lung. Purification, char- acterization, and comparison with membrane carbonic anhydrase from human kidney. J. Biol. Chem. 265, 8795–8801 [PubMed] [Google Scholar]
- 13. Supuran C. T. (2009) in Drug Design of Zinc-Enzyme Inhibitors: Functional, Structural, and Disease Applications (Supuran C. T., Winum J.-Y., eds), John Wiley & Sons, Inc., Hoboken, NJ [Google Scholar]
- 14. Vince J. W., Reithmeier R. A. (1998) Carbonic anhydrase II binds to the carboxyl terminus of human band 3, the erythrocyte C1−/HCO3− exchanger. J. Biol. Chem. 273, 28430–28437 [DOI] [PubMed] [Google Scholar]
- 15. McMurtrie H. L., Cleary H. J., Alvarez B. V., Loiselle F. B., Sterling D., Morgan P. E., Johnson D. E., Casey J. R. (2004) The bicarbonate transport metabolon. J. Enzyme. Inhib. Med. Chem. 19, 231–236 [DOI] [PubMed] [Google Scholar]
- 16. Pushkin A., Abuladze N., Gross E., Newman D., Tatishchev S., Lee I., Fedotoff O., Bondar G., Azimov R., Ngyuen M., Kurtz I. (2004) Molecular mechanism of kNBC1-carbonic anhydrase II interaction in proximal tubule cells. J. Physiol. 559, 55–65 [DOI] [PMC free article] [PubMed] [Google Scholar]
- 17. Becker H. M., Deitmer J. W. (2007) Carbonic anhydrase II increases the activity of the human electrogenic Na+/HCO3− cotransporter. J. Biol. Chem. 282, 13508–13521 [DOI] [PubMed] [Google Scholar]
- 18. Li X., Alvarez B. V., Casey J. R., Reithmeier R. A. F., Fliegel L. (2002) Carbonic anhydrase II binds to and enhances activity of the Na+/H+ exchanger. J. Biol. Chem. 277, 36085–36091 [DOI] [PubMed] [Google Scholar]
- 19. Li X., Liu Y., Alvarez B. V., Casey J. R., Fliegel L. (2006) A novel carbonic anhydrase II binding site regulates NHE1 activity. Biochemistry 45, 2414–2424 [DOI] [PubMed] [Google Scholar]
- 20. Becker H. M., Hirnet D., Fecher-Trost C., Sültemeyer D., Deitmer J. W. (2005) Transport activity of MCT1 expressed in Xenopus oocytes is increased by interaction with carbonic anhydrase. J. Biol. Chem. 280, 39882–39889 [DOI] [PubMed] [Google Scholar]
- 21. Becker H. M., Deitmer J. W. (2008) Nonenzymatic proton handling by carbonic anhydrase II during H+-lactate cotransport via monocarboxylate transporter 1. J. Biol. Chem. 283, 21655–21667 [DOI] [PubMed] [Google Scholar]
- 22. Becker H. M., Klier M., Deitmer J. W. (2010) Nonenzymatic augmentation of lactate transport via monocarboxylate transporter isoform 4 by carbonic anhydrase II. J. Membr. Biol. 234, 125–135 [DOI] [PubMed] [Google Scholar]
- 23. Almquist J., Lang P., Prätzel-Wolters D., Deitmer J. W., Jirstrand M., Becker H. M. (2010) A Kinetic Model of the Monocarboxylate Transporter MCT1 and its Interaction with Carbonic Anhydrase II. J. Comp. Sci. Sys. Biol. 03, 107–116 [Google Scholar]
- 24. Becker H. M., Klier M., Schüler C., McKenna R., Deitmer J. W. (2011) Intramolecular proton shuttle supports not only catalytic but also noncatalytic function of carbonic anhydrase II. Proc. Natl. Acad. Sci. U.S.A. 108, 3071–3076 [DOI] [PMC free article] [PubMed] [Google Scholar]
- 25. Alvarez B. V., Loiselle F. B., Supuran C. T., Schwartz G. J., Casey J. R. (2003) Direct extracellular interaction between carbonic anhydrase IV and the human NBC1 sodium/bicarbonate co-transporter. Biochemistry 42, 12321–12329 [DOI] [PubMed] [Google Scholar]
- 26. Sterling D., Alvarez B. V., Casey J. R. (2002) The extracellular component of a transport metabolon. Extracellular loop 4 of the human AE1 Cl−/HCO3− exchanger binds carbonic anhydrase IV. J. Biol. Chem. 277, 25239–25246 [DOI] [PubMed] [Google Scholar]
- 27. Klier M., Schüler C., Halestrap A. P., Sly W. S., Deitmer J. W., Becker H. M. (2011) Transport activity of the high-affinity monocarboxylate transporter MCT2 is enhanced by extracellular carbonic anhydrase IV but not by intracellular carbonic anhydrase II. J. Biol. Chem. 286, 27781–27791 [DOI] [PMC free article] [PubMed] [Google Scholar]
- 28. Johnson D. E., Casey J. R. (2009) in Drug Design of Zinc-Enzyme Inhibitors: Functional, Structural, and Disease Applications (Supuran C. T., Winum J.-Y., eds), John Wiley & Sons, Inc., Hoboken, NJ [Google Scholar]
- 29. Deitmer J. W., Becker H. M. (2013) Transport metabolons with carbonic anhydrases. Front. Physiol. 4, 291. [DOI] [PMC free article] [PubMed] [Google Scholar]
- 30. Becker H. M., Klier M., Deitmer J. W. (2014) Carbonic anhydrases and their interplay with acid/base-coupled membrane transporters. Subcell. Biochem. 75, 105–134 [DOI] [PubMed] [Google Scholar]
- 31. Stridh M. H., Alt M. D., Wittmann S., Heidtmann H., Aggarwal M., Riederer B., Seidler U., Wennemuth G., McKenna R., Deitmer J. W., Becker H. M. (2012) Lactate flux in astrocytes is enhanced by a non-catalytic action of carbonic anhydrase II. J. Physiol. 590, 2333–2351 [DOI] [PMC free article] [PubMed] [Google Scholar]
- 32. Becker H. M., Bröer S., Deitmer J. W. (2004) Facilitated lactate transport by MCT1 when coexpressed with the sodium bicarbonate cotransporter (NBC) in Xenopus oocytes. Biophys. J. 86, 235–247 [DOI] [PMC free article] [PubMed] [Google Scholar]
- 33. Osborne W. R., Tashian R. E. (1975) An improved method for the purification of carbonic anhydrase isozymes by affinity chromatography. Anal. Biochem. 64, 297–303 [DOI] [PubMed] [Google Scholar]
- 34. Okuyama T., Sato S., Zhu X. L., Waheed A., Sly W. S. (1992) Human carbonic anhydrase IV: cDNA cloning, sequence comparison, and expression in COS cell membranes. Proc. Natl. Acad. Sci. U.S.A. 89, 1315–1319 [DOI] [PMC free article] [PubMed] [Google Scholar]
- 35. Okuyama T., Waheed A., Kusumoto W., Zhu X. L., Sly W. S. (1995) Carbonic anhydrase IV: role of removal of C-terminal domain in glycosylphosphatidylinositol anchoring and realization of enzyme activity. Arch. Biochem. Biophys. 320, 315–322 [DOI] [PubMed] [Google Scholar]
- 36. Silverman D. N. (1982) Carbonic anhydrase: oxygen-18 exchange catalyzed by an enzyme with rate-contributing proton-transfer steps. Methods Enzymol. 87, 732–752 [DOI] [PubMed] [Google Scholar]
- 37. Sültemeyer D. F., Fock H. P., Canvin D. T. (1990) Mass Spectrometric Measurement of Intracellular Carbonic Anhydrase Activity in High and Low C(i) Cells of Chlamydomonas: Studies Using O Exchange with C/O Labeled Bicarbonate. Plant Physiol. 94, 1250–7 [DOI] [PMC free article] [PubMed] [Google Scholar]
- 38. Schneider H.-P., Alt M. D., Klier M., Spiess A., Andes F. T., Waheed A., Sly W. S., Becker H. M., Deitmer J. W. (2013) GPI-anchored carbonic anhydrase IV displays both intra- and extracellular activity in cRNA-injected oocytes and in mouse neurons. Proc. Natl. Acad. Sci. U.S.A. 110, 1494–1499 [DOI] [PMC free article] [PubMed] [Google Scholar]
- 39. Deitmer J. W. (1991) Electrogenic sodium-dependent bicarbonate secretion by glial cells of the leech central nervous system. J. Gen. Physiol. 98, 637–655 [DOI] [PMC free article] [PubMed] [Google Scholar]
- 40. Vaughan-Jones R. D., Peercy B. E., Keener J. P., Spitzer K. W. (2002) Intrinsic H+ ion mobility in the rabbit ventricular myocyte. J. Physiol. 541, 139–158 [DOI] [PMC free article] [PubMed] [Google Scholar]
- 41. Ro H., Carson J. H. (2004) pH microdomains in oligodendrocytes. J. Biol. Chem. 279, 37115–37123 [DOI] [PubMed] [Google Scholar]
- 42. Martínez C., Kalise D., Barros L. F. (2010) General requirement for harvesting antennae at Ca and H channels and transporters. Front. Neuroenergetics 2, 1–8 [DOI] [PMC free article] [PubMed] [Google Scholar]
- 43. Nicholson C., Syková E. (1998) Extracellular space structure revealed by diffusion analysis. Trends Neurosci. 21, 207–215 [DOI] [PubMed] [Google Scholar]
- 44. Syková E., Nicholson C. (2008) Diffusion in brain extracellular space. Physiol. Rev. 88, 1277–1340 [DOI] [PMC free article] [PubMed] [Google Scholar]
- 45. Magistretti P. J., Sorg O., Yu N., Martin J. L., Pellerin L. (1993) Neurotransmitters regulate energy metabolism in astrocytes: implications for the metabolic trafficking between neural cells. Dev. Neurosci. 15, 306–312 [DOI] [PubMed] [Google Scholar]
- 46. Bouzier-Sore A. K., Voisin P., Canionik P., Magistretti P. J., Pellerin L. (2003) Lactate is a preferential oxidative energy substrate over glucose for neurons in culture. J. Cereb. Blood Flow Metab. 23, 1298–1306 [DOI] [PubMed] [Google Scholar]
- 47. Pellerin L. (2010) Food for thought: the importance of glucose and other energy substrates for sustaining brain function under varying levels of activity. Diabetes Metab. 36, 59–63 [DOI] [PubMed] [Google Scholar]
- 48. Wyss M. T., Jolivet R., Buck A., Magistretti P. J., Weber B. (2011) In vivo evidence for lactate as a neuronal energy source. J. Neurosci. 31, 7477–7485 [DOI] [PMC free article] [PubMed] [Google Scholar]
- 49. Simpson I. A., Carruthers A., Vannucci S. J. (2007) Supply and demand in cerebral energy metabolism: the role of nutrient transporters. J. Cereb. Blood Flow Metab. 27, 1766–1791 [DOI] [PMC free article] [PubMed] [Google Scholar]
- 50. Pellerin L., Pellegri G., Martin J. L., Magistretti P. J. (1998) Expression of monocarboxylate transporter mRNAs in mouse brain: support for a distinct role of lactate as an energy substrate for the neonatal vs. adult brain. Proc. Natl. Acad. Sci. U.S.A. 95, 3990–3995 [DOI] [PMC free article] [PubMed] [Google Scholar]
- 51. Bergersen L., Rafiki A., Ottersen O. P. (2002) Immunogold cytochemistry identifies specialized membrane domains for monocarboxylate transport in the central nervous system. Neurochem. Res. 27, 89–96 [DOI] [PubMed] [Google Scholar]
- 52. Pierre K., Pellerin L. (2005) Monocarboxylate transporters in the central nervous system: distribution, regulation and function. J. Neurochem. 94, 1–14 [DOI] [PubMed] [Google Scholar]
- 53. Ghandour M. S., Derer P., Labourdette G., Delaunoy J. P., Langley O. K. (1981) Glial cell markers in the reeler mutant mouse: a biochemical and immunohistological study. J. Neurochem. 36, 195–200 [DOI] [PubMed] [Google Scholar]
- 54. Svichar N., Esquenazi S., Waheed A., Sly W. S., Chesler M. (2006) Functional demonstration of surface carbonic anhydrase IV activity on rat astrocytes. Glia 53, 241–247 [DOI] [PubMed] [Google Scholar]