Background: GAT1 transcription is nitrogen-responsive, whereas Gat1 isoforms (IsoA, IsoB) are produced constitutively.
Results: IsoA/B initiate at different methionines. Gln3-dependent IsoA/B production is unresponsive to nitrogen, whereas Gat1M1-S233 peptide production is nitrogen-responsive.
Conclusion: Wild type and Gat1M1-S233 protein production is nonparallel.
Significance: This is the first instance of Gln3-dependent protein production failing to be nitrogen-responsive, suggesting additional level of Gat1 regulation.
Keywords: Gata, Glutamine, Nitrogen Metabolism, Protein Structure, TOR Complex (TORC), Transcription Initiation Factors, Gat1, Nitrogen Catabolite Repression, Rapamycin
Abstract
Nitrogen catabolite repression (NCR)-sensitive transcription is activated by Gln3 and Gat1. In nitrogen excess, Gln3 and Gat1 are cytoplasmic, and transcription is minimal. In poor nitrogen, Gln3 and Gat1 become nuclear and activate transcription. A long standing paradox has surrounded Gat1 production. Gat1 was first reported as an NCR-regulated activity mediating NCR-sensitive transcription in gln3 deletion strains. Upon cloning, GAT1 transcription was, as predicted, NCR-sensitive and Gln3- and Gat1-activated. In contrast, Western blots of Gat1-Myc13 exhibited two constitutively produced species. Investigating this paradox, we demonstrate that wild type Gat1 isoforms (IsoA and IsoB) are initiated at Gat1 methionines 40, 95, and/or 102, but not at methionine 1. Their low level production is the same in rich and poor nitrogen conditions. When the Myc13 tag is placed after Gat1 Ser-233, four N-terminal Gat1 isoforms (IsoC–F) are also initiated at methionines 40, 95, and/or 102. However, their production is highly NCR-sensitive, being greater in proline than glutamine medium. Surprisingly, all Gat1 isoforms produced in sufficient quantities to be confidently analyzed (IsoA, IsoC, and IsoD) require Gln3 and UASGATA promoter elements, both requirements typical of NCR-sensitive transcription. These data demonstrate that regulated Gat1 production is more complex than previously recognized, with wild type versus truncated Gat1 proteins failing to be regulated in parallel. This is the first reported instance of Gln3 UASGATA-dependent protein production failing to derepress in nitrogen poor conditions. A Gat1-lacZ ORF swap experiment indicated sequence(s) responsible for the nonparallel production are downstream of Gat1 leucine 61.
Introduction
A simple rainstorm can dramatically change the environment of a wild Saccharomyces cerevisiae cell from one of nitrogen plenty to one of nitrogen limitation in the best case or complete nitrogen loss in the worst. Yeasts, however, have evolved highly effective ways of accommodating to such drastic swings in their nutritional environment, making the most of a rich environment while adequately coping with a poor one. This fine control is achieved through multiple, complex regulatory mechanisms. At the center of many of them are the GATA family transcription factors, Gln3 and Gat1. These activators are centrally responsible for nitrogen catabolite repression (NCR)2-sensitive/nitrogen-responsive expression of genes encoding the transport and enzyme systems required to scavenge a wide variety of poorly utilized nitrogen sources when nothing better is available (1–4). In nitrogen-limiting, derepressive conditions, Gln3 and Gat1 accumulate in the nucleus where they activate NCR-sensitive transcription. Such nuclear accumulation also occurs when cells are treated with rapamycin, a specific TorC1 (target of rapamycin complex 1) inhibitor (5–8). When a more nitrogen-rich, repressive environment prevails, Gln3 and Gat1 exit from the nucleus and are sequestered in the cytoplasm, thereby preventing expression of NCR-sensitive genes. Sequestration depends upon the presence of Ure2, a negative regulator shown to form a complex with Gln3 under repressive growth conditions (5, 6, 9, 10).
For just over a decade, Gln3 was the only known NCR-sensitive transcription activator. However, detailed genetic analyses using single, double, and triple gln3, dal80 (a GATA family repressor), and ure2 mutants led to the demonstration that NCR-sensitive transcription could be activated not only by Gln3, but also by another unknown transcription factor whose production and operation were themselves NCR-sensitive, Gln3-dependent, and Dal80- and Ure2-regulated (11–14). The transcription factor whose existence was predicted in that early work was subsequently cloned and designated GAT1/NIL1 (15, 16).
Analysis of GAT1 transcription was then investigated using Northern blot and lacZ reporter-gene fusions (16–21). The data obtained confirmed that GAT1 gene expression was NCR-sensitive, Gln3-dependent, and Dal80- and Ure2-regulated. GAT1 expression was further shown to be autogenously regulated by Gat1 itself. Consistent with the above characteristics, DNA sequencing demonstrated that Gat1 contains a single GATA-binding zinc finger motif common to all well studied members of the GATA family transcription factors, including Gln3, Dal80, and Gzf3 (15, 16). NCR-sensitive, GATA factor-regulated transcription of GAT1 also correlated with the presence of six cis-acting UASGATA elements, the core of which was GATAAG, in its promoter (16). Finally, Gln3, Dal80, Gzf3/Deh1, and Gat1 bind in vitro and in vivo to the GAT1 promoter and specifically to the UASGATA elements of multiple NCR-sensitive genes (17, 22–24). In other words, GAT1 expression exhibited all of the characteristics of a typical NCR-sensitive gene.
The observation that treating cells with rapamycin elicited high level expression of many NCR-sensitive genes and nuclear localization of Gln3 and Gat1 (5–8) stimulated widespread investigations of nitrogen-responsive TorC1 regulation of GATA factor localization and function (see Ref. 26 for a comprehensive review of this literature). Nitrogen-responsive GATA factor regulation involves both TorC1-dependent and TorC1-independent mechanisms (9, 27–50). Sustaining this view, responses to rapamycin and NCR have been genetically separated by specific amino acid substitutions in both Ure2 and Gln3 (48, 49). Most recently, a hierarchy of multiple nitrogen-responsive regulatory pathways have been shown to be elicited by distinct physiological conditions, with each one possessing its own unique requirements (50). In this regard, the glutamine synthetase inhibitor, methionine sulfoximine (Msx), and rapamycin participate in separate nitrogen-responsive regulatory pathways rather than inhibiting two steps of a single linear one (47, 50).
During early studies of the effects of rapamycin and Msx on Gat1 localization and phosphorylation, a largely ignored observation was made; Western blots visualizing Gat1-Myc13 exhibited two Gat1 species (38, 40). Because rapamycin-dependent Gat1 phosphorylation/dephosphorylation could not be demonstrated, it was speculated that the less abundant and faster migrating of these species might be a degradation product. However, a more important paradox was not investigated in these studies (40). The two Gat1-Myc13 protein species were produced constitutively in glutamine as well as proline medium, which contrasted sharply with all previous reports that GAT1 gene expression was NCR-sensitive, i.e., low in repressive glutamine medium and high in derepressive proline medium (16–21).
The present work identifies the source of the two Gat1 protein species and investigates the paradox of Gat1 protein production failing to correlate with previously reported GAT1 gene expression. We used specific amino acid substitution mutants to show that the slower migrating, constitutively produced species (designated IsoA) derives from translation beginning not at the first in frame AUG in the GAT1 ORF, but at the second one encoding Gat1 M40. Further, the faster migrating of these two Gat1 species (designated IsoB) does not derive from degradation, but from translation beginning at one, the other, or both Gat1 methionine residues Met-95 and/or Met-102. Beyond explaining the previously reported two Gat1 isoforms, we demonstrate the production of two major and two minor truncated isoforms designated IsoC, IsoD, IsoE, and IsoF. Among these four isoforms, those present in sufficient quantities to be reliably measured (IsoC and IsoD) are highly NCR-sensitive, which contrasts sharply with constitutive IsoA and IsoB production but parallels the reported regulation of GAT1 expression. IsoA is present at levels equivalent to the repressed levels of IsoC and IsoD isolated from glutamine-grown cells. Despite the striking difference in the regulation of their production, all isoforms present in sufficient quantities to be confidently analyzed (IsoA, IsoC, and IsoD) are highly dependent on the presence of active Gln3 and UASGATA elements in the GAT1 promoter.
MATERIALS AND METHODS
Strains and Culture Conditions
The S. cerevisiae strains used as the transformation recipients in which wild type and gat1 mutant plasmids were assayed were FV006 (MATa, gat1Δ::natMX leu2-3,112, ura3-52, trp1, his4, rme1, HMLa) (41) and FV007 (MATa, gat1Δ::natMX, gln3Δ::kanMX, leu2-3,112, ura3-52, trp1, his4, rme1, HMLa) (25). Chromosomal GAT1 was truncated (strain FV655; MATa, GAT1[1-693]-MYC13[HIS], leu2-3,112, ura3-52, trp1, his4, rme1, HMLa) by the addition of 13 copies of the Myc epitope (Myc13) after Gat1 Ser-231 as described by Longtine et al. (51), using primers Gat1ms-TAG-F (5′-TAATAATCATAGTCATAATAGTAGTCATAATAATAACAGTCGGATCCCCGGGTTAATTAA-3′) and sGAT1-TAG-R (5′-TTGTGTTTGTGTTTGTGTTTGCGTTTGTATTATTGGCGATGAATTCGAGCTCGTTTAAAC-3′). The protein swap and UASGATA element mutations were analyzed in strain TCY1 (MATa, lys2, ura3).
Growth conditions were identical to those described by Tate et al. (42). Cultures of fresh transformants (no more than 4 or 5 days from the time of transformation) (50 ml) were grown to mid-log phase (A600 nm = 0.5) in YNB (without amino acids or ammonia) minimal medium containing the indicated nitrogen source at a final concentration of 0.1%. Appropriate supplements (120 μg/ml leucine, 20 μg/ml uracil, 20 μg/ml histidine, and 20 μg/ml tryptophan) were added to the medium as necessary to cover auxotrophic requirements. Where indicated, cells were treated with 200 ng/ml rapamycin for 20 min or 2 mm Msx for 30 min as described earlier (42).
Plasmid Construction
gat1 amino acid substitution mutants were constructed using standard PCR-based methods and the primer sets in Table 1. Plasmid pKA62 containing the wild type GAT1 gene including its native promoter sequences to −847 was used as the wild type parent plasmid and as a template for wild type PCR fragments. pKA62 also contained the MYC13 and ADH1 transcription terminator sequences fused in frame at the translational stop codon of the GAT1 gene. Plasmids pRR1061 and pRR1063 were generated from PCR fragments, using pRR979 as template. These fragments were then cloned into pKA62. Truncated plasmids pRR1139 and pRR1143 were created using the primers in Table 1 and pRR979 and pRR981 as templates, respectively. The fragments were then cloned into pKA62 where they replaced the wild type gene. For plasmid pRR990, the primers indicated in Table 1 were used to replace the 32-bp DNA segment (−210 to −242) containing the four tandem GATA elements with a 6-bp (5′-ACTAGT-3′) Spe1 site.
TABLE 1.
Primer sets used in this work
| Plasmid | Substitution | Template | Primer set |
|---|---|---|---|
| pRR979 | Gat1M40L | pKA62 | 5′-ggcgctcgagtacaggtcccagatttctttgtttaaattcaagtccgggtcgaggttcgggactctgttcgtgctCAGagttatgatccccgcgggtgcattaaccacaagtactgcgtacgttcaag-3′ |
| 5′-atccccgcgggtgcattaaccacaagtactgcgtacgttcaag-3′ | |||
| pRR981 | Gat1M1A | pKA62 | 5′-ctagactagtggccccggtattagcGCGcacgttttctttcc-3′ |
| 5′-cgcggatcctaaattcagattcaaccaatccaggctcag-3′ | |||
| 5′-ctagacta gtggcacacacctatatatatgtggctgg-3′ | |||
| 5′-ctagacta gtggcacacacctatatatatgtggctgg-3′ | |||
| pRR990 | Gat11–510,GATAΔ | pKA62 | 5′-ctagactagtagcccgttgttcctgctttgttgacgttgg3′ |
| 5′-atccccgcgggtgcattaaccacaagtactgcgtacgttcaag-3′ | |||
| 5′-ctagactagtcaaatcattgcgtccgaccacaggccg-3′ | |||
| 5′-cgcggatcctaaattcagattcaaccaatccaggctcag-3′ | |||
| pRR1053 | Gat11–233 | pKA62 | 5′-tcgcggatccgctgggactgttattattatgactactattatg-3′ |
| 5′-atccccgcgggtgcattaaccacaagtactgcgtacgttcaag-3′ | |||
| pRR1061 | Gat1M40L,M102A | pRR979 | 5′-tgtactcgagcgcccagaaaatattgcccgattctaaccgtattttgaacctttcttggcgtttgcataaccgcacgtctttccatcgaattaaccgcataatgcaacattctaactctattGCAgacttctccgcctcg-3′ |
| 5′-cgcggatcctaaattcagattcaaccaatccaggctcag-3′ | |||
| pRR1063 | Gat1M40L,M95A | pRR979 | 5′-tgtactcgagcgcccagaaaatattgcccgattctaaccgtattttgaacctttcttggcgtttgcataaccgcacgtctttccatcgaattaaccgcataGCAcaacattctaactct-3′ |
| 5′-cgcggatcctaaattcagattcaaccaatccaggctcag-3′ | |||
| pRR1077 | Gat1M102A | pKA62 | 5′-tgtactcgagcgcccagaaaatattgcccgattctaaccgtattttgaacctttcttggcgtttgcataaccgcacgtctttccatcgaattaaccgcataatgcaacattctaactctattGCAgacttctccgcctcg-3′ |
| 5′-cgcggatcctaaattcagattcaaccaatccaggctcag-3′ | |||
| pRR1079 | Gat1M95A,M102A | pKA62 | 5′-tgtactcgagcgcccagaaaatattgcccgattctaaccgtattttgaacctttcttggcgtttgcataaccgcacgtctttccatcggattaaccgcataGCAcaacattctaactctattGCAgacttctccgcctcg-3′ |
| 5′-cgcggatcctaaattcagattcaaccaatccaggctcag-3′ | |||
| pRR1081 | Gat1M95A | pKA62 | 5′-tgtactcgagcgcccagaaaatattgcccgattctaaccgtattttgaacctttcttggcgtttgcataaccgcacgtctttccatcgaattaaccgcataGCAcaacattctaactct-3′ |
| 5′-cgcggatcctaaattcagattcaaccaatccaggctcag-3′ | |||
| pRR1139 | Gat11–233,M1A | pRR981 | 5′-tcgcggatccggctgggactgttattattatgactactattatg-3′ |
| 5′-atccccgcgggtgcattaaccacaagtactgcgtacgttcaag-3′ | |||
| pRR1143 | Gat11–233,M40L | pRR979 | 5′-tcgcggatccggctgggactgttattattatgactactattatg-3′ |
| 5′-atccccgcgggtgcattaaccacaagtactgcgtacgttcaag-3′ | |||
| pRR1224 | Gat11–233,GATAΔ | pRR990 | 5′-tcgcggatccgctgggactgttattattatgactactattatg-3′ |
| 5′-atccccgcgggtgcattaaccacaagtactgcgtacgttcaag-3′ | |||
| pRR1241 | Gat11–233,M95A,M102A | pRR1079 | 5′-atccccgcgggtgcattaaccacaagtactgcgtacgttcaag-3′ |
| 5′-tcgcggatccgctgggactgttattattatgactactattatg-3′ |
GAT1-lacZ fusion plasmid pTSC624 was constructed by cloning a 0.87-kb PCR-generated GAT1 fragment (−670 to +187; Gat1 residue 61) into SalI-BamHI-digested lacZ vector pHP41 (52). Plasmids pRA71, pRA72, pRA73, and pRA75 were constructed by cloning synthetic wild type and indicated substitution mutant DNA fragments covering GAT1 promoter sequences −250 to −200, containing the five clustered UASGATA elements, into heterologous expression vector pHP41 (52) digested with Sal1 and Eag1. All plasmid structures were verified by DNA sequencing.
Western Blot Analyses
Western blot analyses were performed as described by Cox et al. (37), Tate et al. (38), and Liu et al. (53). Pgk1 was used as a loading standard and visualized using monoclonal antibody (Invitrogen) at a dilution of 1:8,000–16,000. Western blot results were recorded on Kodak BioMax XAR film, and a wide range of exposures was collected for each sample. With the exception of Figs. 8A (upper panel) and 9, where comparison of lane-to-lane intensities was necessary, moderate overexposure of all blots was selected for presentation to avoid loss of any minor species.
FIGURE 8.
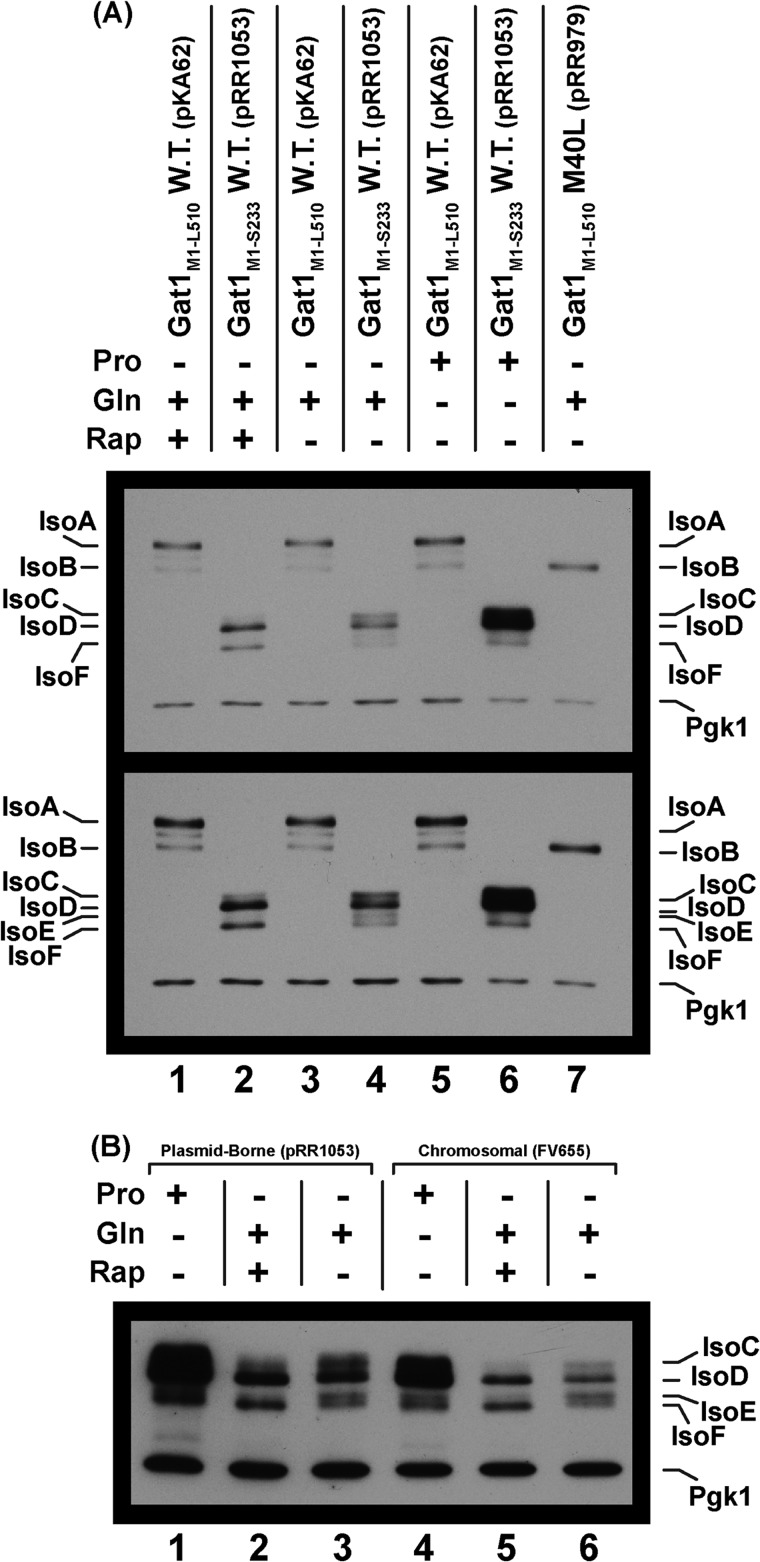
A, a truncated Gat1 peptide terminating at Gat1 Ser-233 (pRR1053) supports NCR-sensitive production of two major (IsoC and IsoD) and two minor (IsoE and IsoF) isoforms. Extracts of cells expressing wild type Gat1 (pKA62) were provided as controls for the production of IsoA and IsoB (lanes 1, 3, and 5) and a Gat1 M40L substitution (pRR979) producing only IsoB (lane 7). Note that lanes 6 and 7 in the upper panel were underloaded relative to lanes 1–5. The upper panel depicts a normal exposure of the Western blot in which the relative levels of the Gat1 isoforms produced under the various conditions can be directly compared. The lower panel is a longer exposure of that blot to visualize the minor bands that are not visible in the upper panel. There is a faint unidentified species between IsoA and IsoB in lanes 1, 3, and 5 of the lower panel. Culture conditions used in extract preparation appear as plus signs for proline (Pro), glutamine (Gln), or rapamycin-treated glutamine (Rap). Minus signs indicate the absence of that condition. Plasmid numbers and pertinent genotypes also appear above the Western blot images. B, chromosomal and plasmid-borne truncated GAT1-MYC13 (Gat1 Met-1 to Ser-233) genes support production of the same isoforms, exhibiting the same regulatory characteristics. Growth conditions are as in A. The plasmid (pRR1053) and strain (FV655) used in the experiment appear above the blot image. The blot depicted is an overexposure to permit evaluation of the minor IsoE and IsoF species. Shorter exposures yield the same results as observed in A. The gel concentration and/or running times of electrophoresis in this and subsequent blots containing IsoE and IsoF were increased from those in preceding figures to increase resolution.
FIGURE 9.
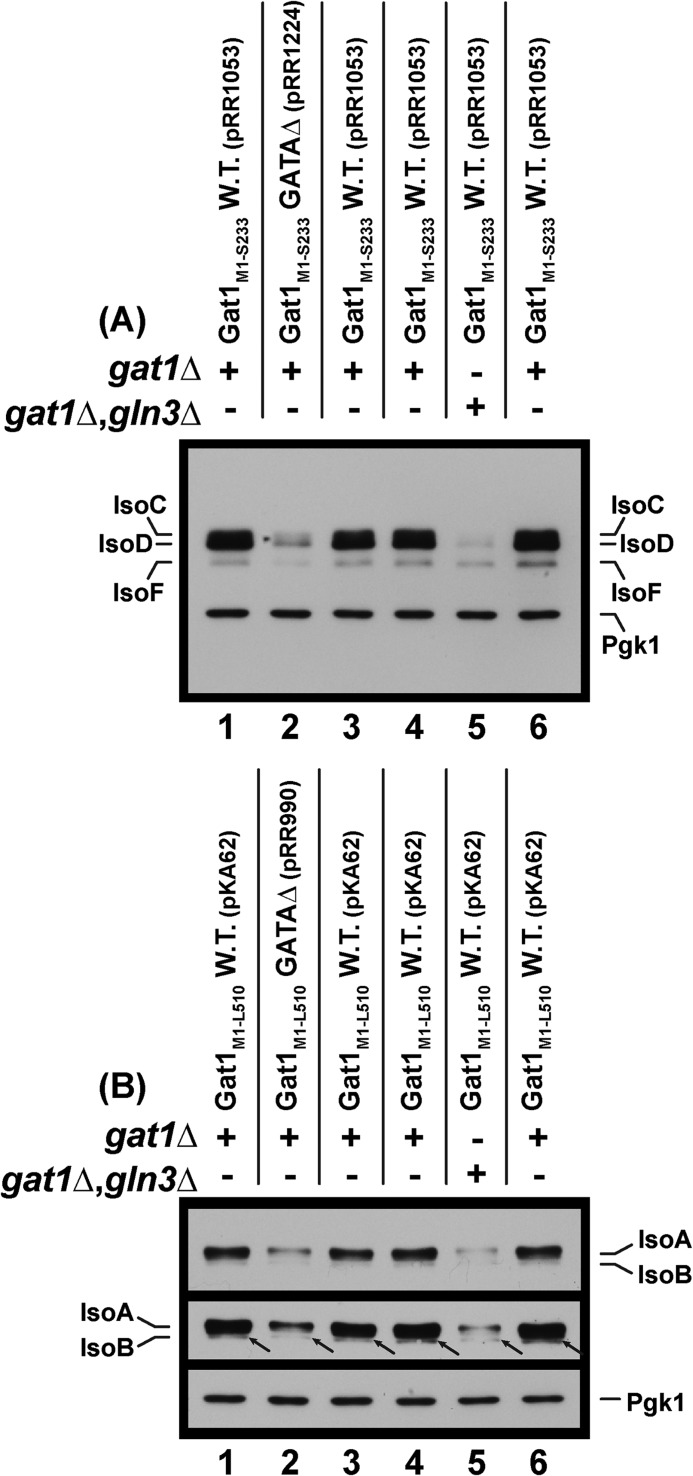
Western blots demonstrating that both active Gln3 and the UASGATA elements in the GAT1 promoter are required for production of Gat1 IsoA, IsoC, IsoD, and potentially IsoF and IsoB. All of the experiments were performed in YNB-proline medium. The transformation recipients were gat1Δ (FV006) and gat1Δgln3Δ (FV007). They are designated with + and − signs immediately above the blots. The numbers of plasmids analyzed and their pertinent genotypes are shown above the blots. The middle panel of B is an overexposure of the upper panel to visualize the small amounts of IsoB (arrows), whereas the bottom panel is an underexposure of the same blot to permit realistic assessment of loading uniformity using a Pgk1 standard.
Indirect Immunofluorescence Microscopy
Cell collection and immunofluorescent staining were performed as previously described (31, 39, 41, 50, 54). Cells were imaged using a Zeiss Axioplan 2 imaging microscope with a 100× Plan-Apochromat 1.40 oil objective at room temperature. Images were acquired using a Zeiss Axio camera and AxioVision 4.8.1 software (Zeiss) and processed for publication with Adobe Photoshop and Illustrator programs. Settings (dark and light only) were altered where necessary to avoid any change or loss in cellular detail relative to what was observed in the microscope, usually modestly reducing background fluorescence between cells. Changes were applied uniformly to the image presented and were very similar from one image to another. However, as noted below, no such changes were ever applied to images used for scoring Gat1-Myc13 localization.
Determination of Intracellular Gat1-Myc13 Distribution
We quantified intracellular Gat1-Myc13 localization as described earlier in detail (42) by manually scoring Gat1-Myc13 localization in 200 or more cells in multiple, randomly chosen fields. Scoring was performed exclusively using unaltered, primary .zvi image files viewed with Zeiss AxioVision 3.0, 4.6.3, and 4.9.1 software.
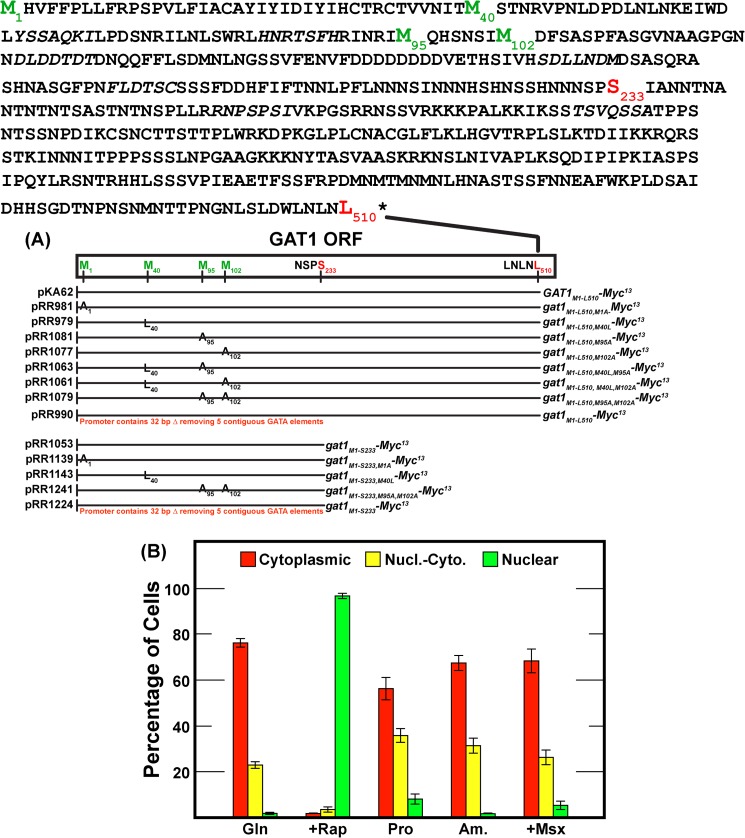
Cells were classified into one of three categories in subsequent figures characterizing Gat1 localization: cytoplasmic (cytoplasmic Gat1-Myc13 fluorescence only; red bars), nuclear-cytoplasmic (Gat1-Myc13 fluorescence appearing in the cytoplasm as well as co-localizing with DAPI-positive material; yellow bars), and nuclear (Gat1-Myc13 fluorescence co-localizing only with DAPI-positive material; green bars). A representative collection of “standard” GATA factor images demonstrating the differences in these categories is shown in Fig. 2 of Ref. 42 along with a description of how the criteria were applied. Day to day, experiment to experiment variation observed with these assays is depicted in Fig. 1B where we averaged data (three experiments performed over a period of 9 months) for each of the five conditions used in this work. Reproducibility was similar to that recently reported for similar measurements of plasmid-produced Gln3-Myc13 localization (49). Similar experiments were usually repeated two or more times with similar results. Images accompanying the histograms were selected on the basis that they exhibited intracellular Gat1-Myc13 distributions as close as possible to those observed in the quantitative scoring data.
FIGURE 2.
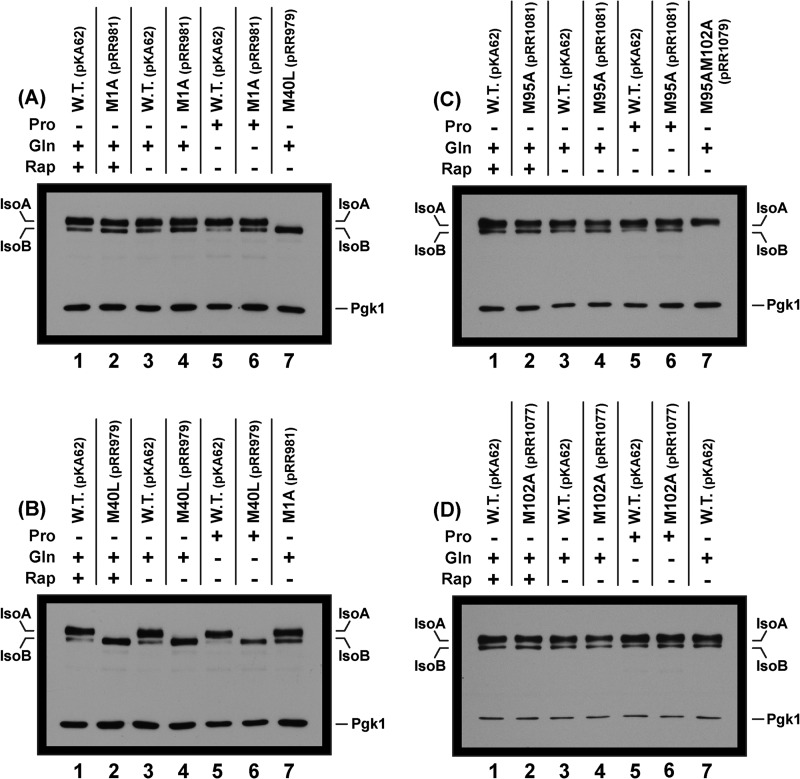
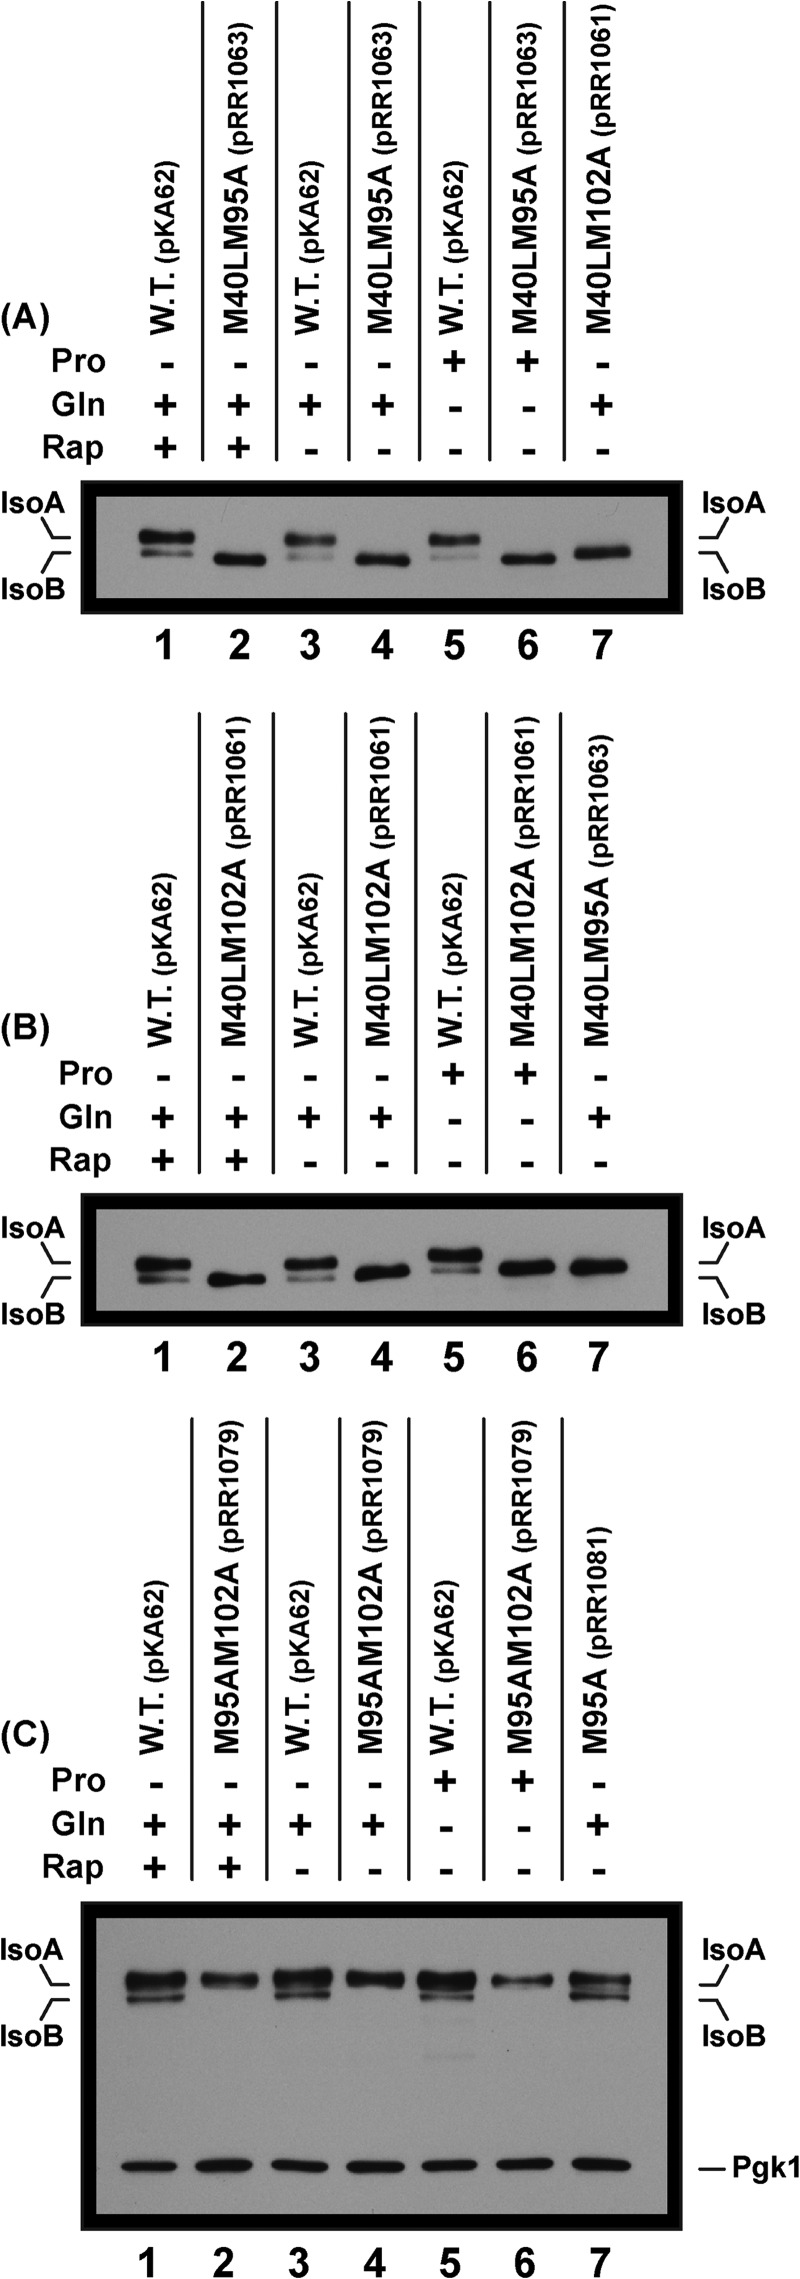
Wild type GAT1-MYC13 (pKA62) supports constitutive production of two isoforms neither of which require the first Gat1 ORF methionine, M1. The slower migrating form is designated IsoA and requires Gat1 Met-40 for its production. The more rapidly migrating form is designated IsoB. The plasmids used in this experiment were wild type (pKA62) and substitution mutants, M1A (pRR981), M40L (pRR979), M95A (pRR1081), and M102A (pRR1077). Culture conditions used in extract preparation appear above the blot in each panel as plus signs along with the pertinent amino acid substitution(s) and number of the plasmid used to generate the extract; proline (Pro), glutamine (Gln), or rapamycin-treated glutamine (Rap; 200 ngm/ml for 20 min). Minus signs indicate the absence of that condition. The Western blots were somewhat overexposed to optimize visualization of both IsoA and the weaker signal generated by IsoB. Shorter exposures of the blots support the same conclusions.
FIGURE 1.
A, Gat1 protein sequence and compositions of constructs used in this work. The positions of the amino acid substitution(s) and translation termination point (Gat1 Leu-510 or Gat1 Ser-233) for each construct are indicated both in the complete Gat1 sequence and in the individual constructs below it. The substituted methionine residues and termination points are depicted in green and red lettering, respectively. Plasmid numbers and pertinent wild type or mutant gat1 genotypes flank the lines indicating construct structures. B, evaluation of experiment to experiment Gat1-Myc13 intracellular localization assays. Histograms indicate the average values observed in three experiments performed over a 9-month period. Error bars indicate the range of one standard deviation. Red bars indicate Gat1-Myc13 cytoplasmic fluorescence only, yellow bars indicate both cytoplasmic and nuclear fluorescence (Nucl.-Cyto.), and green bars indicate nuclear staining only. The strain used in this experiment was FV006 transformed with pKA62. The media were YNB glutamine (Gln), proline (Pro), ammonia (Am.), glutamine + rapamycin (+Rap), and ammonia + Msx (+Msx).
Quantitative RT-PCR
RNA isolation and cDNA synthesis were conducted as described by Georis et al. (45) using primers that have been described previously (41). DAL5 values were normalized with TBP1. The values represent the averages of at least three experiments from independent cultures, and the error bars indicate standard errors.
β-Galactosidase Assays
β-Galactosidase was assayed for 20 min using standard methods described earlier (52). Activities were expressed in units defined by Miller (55).
RESULTS
One Gat1 Isoform or Two
Two Gat1 species (here designated IsoA and IsoB) with clearly different migration rates were present in the first reported Gat1 Western blots derived from cells containing wild type GAT1-MYC13 expressed from pKA62 (40). However, the rapidly migrating species, speculated to be a degradation product, was reproducibly observed and could not be eliminated by more stringent sample preparation. Crude estimates of the two species' molecular masses suggested they roughly differed by an amount expected if they derived from separate translational initiations at the first and second GAT1 ORF methionine residues (Gat1 Met-1 and Met-40). More important, however, both species were present constitutively, whereas GAT1 transcription paralleled that of a typical NCR-sensitive gene (11–13, 16–21). These observations raised several questions: (i) Did the differently migrating species derive from separate translational initiations or post-translational processing? (ii) Were they differentially regulated and/or transported into the nucleus? (iii) How could one rectify the lack of correlation between previously reported NCR-sensitive GAT1 transcription and constitutive Gat1 protein levels?
To address the first and second questions, wild type GAT1-MYC13 and gat1-MYC13 methionine substitution mutants were constructed in CEN-based plasmids, thereby permitting them to be efficiently analyzed in multiple genetic backgrounds (Fig. 1A). With one exception (pRR990), all of the plasmids used in this work possessed a common, completely wild type 5′ region. They differed from the wild type GAT1 gene only by the amino acid substitution(s) introduced and whether a Myc13 tag was fused after the last amino acid in the ORF (Gat1 Leu-510) or after Ser-233. The plasmids were transformed into gat1Δ recipient strain, FV006. This recipient was chosen so that transformants contained only a single form of Gat1 protein, thereby reducing the number of variables influencing our analyses. Gat1-Myc13 intracellular localization and/or migration in Western blots were measured in the transformants grown as described in the past: nitrogen-replete (glutamine or ammonia), nitrogen-limiting (proline) medium, and untreated or treated with rapamycin or Msx (40, 44, 45, 49). Importantly, the regulatory characteristics of the plasmid-borne wild type GAT1-MYC13 gene were identical to those observed when GAT1-MYC13 replaced an untagged GAT1 gene in its native chromosomal location (compare Fig. 2 with Fig. 8 (D and E) in Ref. 44 and Fig. 7B in Ref. 46).
FIGURE 7.
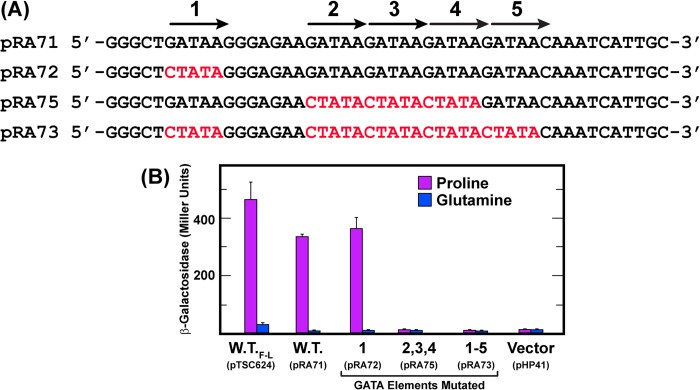
Substitution of the lacZ ORF for that of GAT1 results in NCR-sensitive β-galactosidase production (pTSC624). UASGATA elements are required for a GAT1 promoter fragment to support NCR-sensitive, heterologous reporter gene expression. Construction and composition of the plasmids used in this experiment are described under “Materials and Methods.” The full-length lacZ ORF was substituted for that of GAT1 in pTSC624 at Gat1 Leu-61. The plasmid numbers and mutated UASGATA elements analyzed are shown in A, and the β-galactosidase results are in B. The media were YNB-proline and YNB-glutamine. Assays were performed as described under “Materials and Methods.”
Our first two constructs were prepared as positive (wild type GAT1-MYC13, pKA62) and negative (substitution mutant gat1M1A-MYC13, pRR981) controls. To our great surprise, the Gat1 M1A substitution had no effect whatever on the electrophoretic mobility of Gat1 IsoA and IsoB, irrespective of the growth conditions employed (Fig. 2A, lanes 1, 2, 4, and 6). The unexpected electrophoretic behavior of the gat1M1A-MYC13 mutant (pRR981) raised an unsettling question: which methionine was serving as the Gat1 translational start site? We addressed this question by substituting leucine for methionine 40 (gat1M40L-MYC13, pRR979) or alanine for methionine 95 (gat1M95A-MYC13, pRR1081) (Fig. 1A). The reason for constructing and assaying the Gat1 M95A substitution was the fact that the calculated size difference between proteins beginning at Gat1 Met-40 versus Met-95 was similar to that expected of proteins whose translations were initiated at Gat1 Met-1 versus Met-40 (Fig. 1A).
A Gat1 M40L substitution (pRR979) eliminated slower migrating IsoA but had no effect on the more rapidly migrating IsoB (Fig. 2B, lanes 1, 2, 4, and 6). Further, varying the culture conditions also had no convincingly consistent effect on the Western blot profiles (Fig. 2, A–D). IsoB was sometimes (Fig. 2, A, lane 3 versus lane 5, and B, lane 3 versus lane 5), but not always (Fig. 2D, lane 5 versus lane 7), substantially diminished in cells cultured in proline medium relative to that in nitrogen-replete glutamine medium. The overall lack of nitrogen source- and inhibitor-dependent effects on IsoA and IsoB will become centrally important later.
The above results could be explained if IsoB derived from a translational start at Gat1 Met-95 rather than degradation or post-translational cleavage of a protein beginning at Gat1 Met-40. However, an M95A substitution (gat1M95A-MYC13, pRR1081) yielded the same Western blot profile as the wild type (Fig. 2C). Because there was a second methionine seven residues further along in the GAT1 ORF, we substituted alanine for that one as well (gat1M102A-MYC13, pRR1077). Again, we found no difference in the Gat1-Myc13 Western blot profiles (Fig. 2D). These are the expected results if two translational start sites existed at Gat1 Met-95 and Met-102, respectively, because it would be difficult to resolve proteins starting at Met-95 (molecular weight = 45,184) and Met-102 (molecular weight = 44,386) with our conditions of electrophoresis.
To test this hypothesis, we constructed and analyzed three double mutants: gat1M40L,M95A-MYC13 (pRR1063), gat1M40L,M102A-MYC13 (pRR1061), and gat1M95A,M102A-MYC13 (pRR1079) (Fig. 1A). IsoA was eliminated in the first two mutants as a result of the Gat1 M40L substitution (Fig. 3, A and B, lanes 2, 4, 6, and 7). Although our electrophoretic conditions would not permit convincing resolution of putative Gat1 species beginning at Met-95 and Met-102, we were able to detect slight differences in the migration rates exhibited with extracts of gat1M40L,M95A-MYC13 (pRR1063) and gat1M40L,M102A-MYC13 (pRR1061) double mutants (Fig. 3A, lanes 6 and 7). The third substitution mutant, in which Gat1 Met-95 and Gat1 Met-102 were both substituted (gat1M95A,M102A-MYC13 pRR1079), exhibited a crystal clear phenotype. IsoB was totally eliminated, whereas IsoA remained unaffected (Figs. 2C, lane 7, and 3C, lanes 2, 4, and 6). These data indicated the existence of three Gat1-Myc13 isoforms: IsoA, IsoBM95, and IsoBM102. One interpretation of these data is that IsoBM95 and IsoBM102 co-exist in a wild type GAT1 strain. Alternatively, it may be that IsoBM95 is produced in a wild type strain and that Gat1 Met-102 is used as a surrogate translational initiation site when Gat1 Met-95 is eliminated by substitution. No data exist that distinguish between these two possibilities. Note also that in each case where the M40L substitution was present, IsoBM95 and IsoBM102 exhibited more intense bands (Fig. 3, A and B, lanes 2, 4, and 6). This suggests that when Gat1 Met-40 was eliminated, translation at Met-95 and/or Met-102 initiated with greater efficiency than in the wild type.
FIGURE 3.
Substitution of both M95A and M102A are required to abolish IsoB production. Gat1-Myc13 M40L and one or the other of Gat1-Myc13 M95A or Gat1-Myc13 M102A (pRR1063 and pRR1061, respectively) have no effect on the constitutive production of IsoB (A and B). In contrast, a double substitution, M95A and M102A (pRR1079) abolishes production of IsoB (C). The experimental format and data presentation are as in Fig. 2. Note the marked increase in the amount of IsoB when IsoA is not produced.
Localization of the Gat1 Isoforms
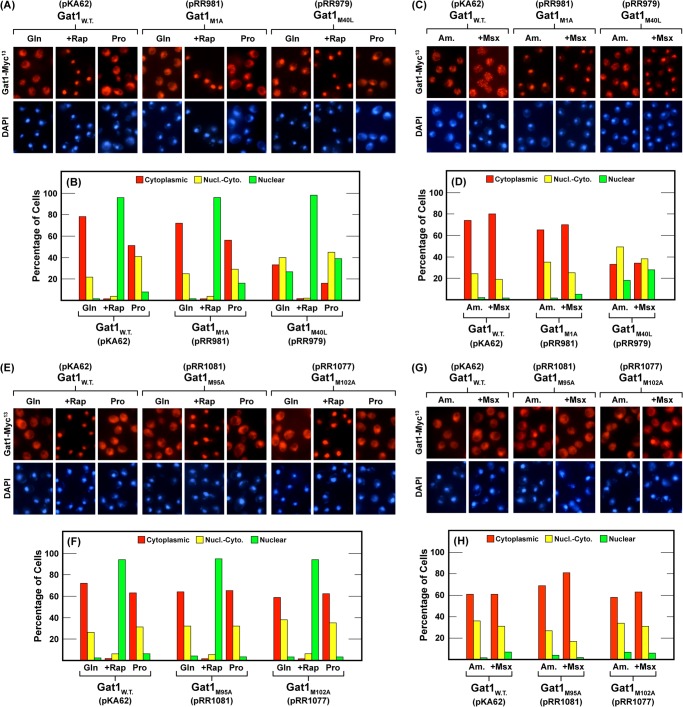
The above data explain why Gat1 Western blots exhibited two Gat1 species, but they offer no indication of whether their individual intracellular localizations were regulated, i.e., did they respond to Tor1-dependent and/or NCR-sensitive regulation as previously reported for Gat1 activity (41, 44–46)? Therefore, we assayed Gat1-Myc13 localization in each of the mutants we constructed. The gat1M1A-MYC13 mutant (pRR981) exhibited a wild type response to rapamycin treatment, growth of cells in nitrogen-limiting proline medium (Fig. 4, A and B) or following Msx treatment of ammonia-grown cells (Fig. 4, C and D). This wild type phenotype positively correlated with the lack of effect observed in the Western analysis. On the other hand, the gat1M40L-MYC13 (pRR979) mutant, containing only IsoB, exhibited diminished cytoplasmic sequestration in both glutamine- and proline-grown as well as in untreated or Msx-treated, ammonia-grown cells (Fig. 4, A–D). This argued that Gat1 residues 40–95 were required for efficient cytoplasmic Gat1 sequestration. In a strain lacking IsoBM95 (gat1M95A-MYC13, pRR1081) or IsoBM102 (gat1M102A-MYC13, pRR1077), the response to rapamycin treatment was wild type. In other words, IsoBM95 and/or IsoBM102, in the presence of IsoA, completely relocated to the nucleus following rapamycin addition (Fig. 4, A–D).
FIGURE 4.
The effects of various culture conditions on the intracellular localization of Gat1 in wild type and single Gat1 substitution mutants. The plasmids used in this experiment were wild type (pKA62), Gat1 M1A (pRR981), M40L (pRR979), M95A (pRR1081), and M102A (pRR1077). The plasmid used to generate the localization data in each set of histograms (panels B, D, F, and H) along with the pertinent amino acid substitution appear below the panel. Panels A, C, E, and G depict photomicrographs of representative fields from which the corresponding histogram data were generated. Experimental format and presentation were as described under “Materials and Methods” and in the legend to Fig. 1B.
We next asked whether the individual IsoBM95 and IsoBM102 isoforms exhibited wild type or mutant intracellular localization. To achieve this, we needed to analyze gat1M40L,M102A-MYC13 (pRR1061) and gat1M40L,M95A-MYC13(pRR1063) double mutants in which IsoA was absent and only IsoBM95 or IsoBM102 was present. This approach was possible because individual Gat1 M95A and Gat1 M102A substitutions exhibited wild type intracellular Gat1-Myc13 distributions under all of the conditions assayed (Fig. 4, E–H; compare pRR1081 and pRR1077 versus wild type, pKA62).
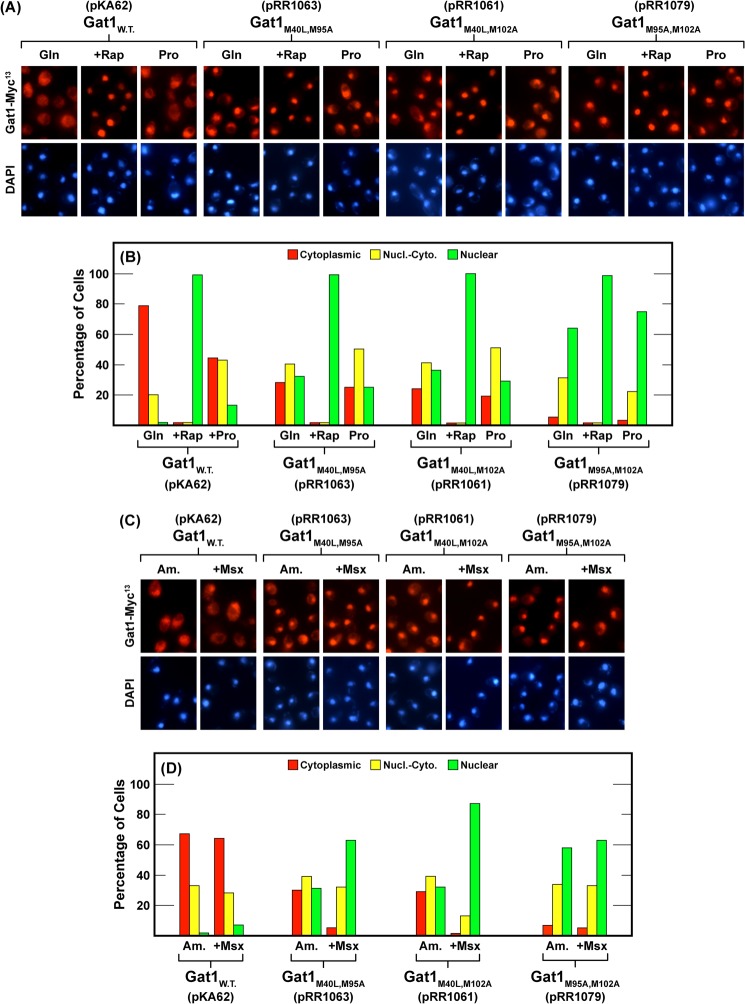
In the absence of IsoA, IsoBM95 (pRR1061) and IsoBM102 (pRR1063) individually responded to rapamycin treatment the same as wild type; Gat1-Myc13 completely relocated to the nucleus (Fig. 5, A and B). In contrast, they partially lost their ability to be sequestered in the cytoplasm irrespective of nitrogen availability, i.e., in untreated nitrogen-replete (glutamine- and ammonia-grown) and nitrogen-limiting (proline-grown) cells (Fig. 5, A–D). The phenotypes were nearly identical to that observed with the single gat1M40L-MYC13 substitution mutant (pRR979) lacking IsoA alone (Fig. 4, A–D).
FIGURE 5.
The effects of various culture conditions on the intracellular localization of Gat1 in wild type and double Gat1 substitution mutants. The plasmids used in this experiment were wild type (pKA62) and double Gat1 substitution mutants M40L,M95A (pRR1063), M40L,M102A (pRR1061), and M95A,M102A (pRR1079). The experimental format and data presentation were as in Fig. 4.
In Msx-treated, ammonia-grown cells, we saw a striking difference between the localization of Gat1 in single versus double substitution mutants. As occurred in wild type, Msx treatment did not affect the intracellular Gat1 distribution in any of the single mutants (pRR981, 979, 1081, and 1077), i.e., intracellular Gat1 distributions in the ammonia versus ammonia plus Msx were the same (Fig. 4, C, D, G, and H). In contrast, Msx treatment elicited marked relocalization of IsoBM95 and IsoBM102 into the nuclei of the double mutants lacking the other IsoB and the IsoA isoforms (Fig. 5, C and D, pRR1061 and pRR1063, respectively).
The final experiment determined the localization profile of Gat1 IsoA in the absence of IsoBM95 and IsoBM102 in a gat1M95A,M102A-MYC13 double mutant (pRR1079) (Fig. 5, A–D). The results were remarkable. Cytoplasmic sequestration in nitrogen-replete glutamine- or ammonia-grown cells was almost completely abolished. The numbers of cells in which Gat1 IsoA was cytoplasmic were nearly undetectable (Fig. 5, A–D). Treating the double substitution mutant with rapamycin caused IsoA in the nuclear-cytoplasmic category to completely relocate into the nucleus, the wild type response. On the other hand, treating these cells with Msx was without effect.
All of the GatM1–510-MYC13 Substitution Mutants Support Normally Regulated DAL5 Transcription
The above results raised an important question. Had the amino acid substitutions compromised the ability of Gat1 mutants to support transcription? To assess this, the substitution plasmids were transformed into a gat1Δ strain and DAL5 expression in untreated and rapamycin-treated, glutamine-grown cells assayed. DAL5 was chosen for this functional assay because in glutamine-grown cells of the genetic background we used, DAL5 expression is highly rapamycin-responsive in a Gat1-dependent, Gln3-independent manner (41). As shown in Fig. 6, all of the substitution mutants were able to activate rapamycin-elicited DAL5 transcription, i.e., 55 or 62 of 471 Gat1 residues could be eliminated without seriously compromising the regulated transcriptional activation function of Gat1 despite their effects on subcellular localization.
FIGURE 6.
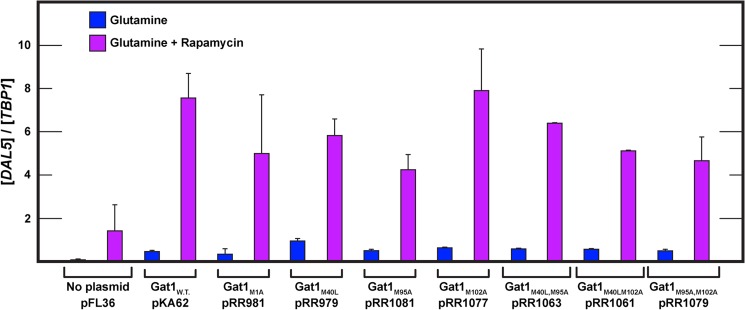
All of the GatM1-L510-MYC13 substitution mutants support normally regulated DAL5 transcription. Total RNA was isolated from gat1Δ cells (FV006) transformed with pFL36 (vector), wild type (pKA62), Gat1 substitution mutants M1A (pRR981), M40L (pRR979), M95A (pRR1081), M102A (pRR1077), M40L,M95A (pRR1063), M40L,M102A (pRR1061), and M95A,M102A (pRR1079). Cells were grown in YNB-glutamine medium untreated or treated with rapamycin (0.2 μg/ml) for 30 min. DAL5 mRNA levels were quantified as described under “Materials and Methods.”
Four Truncated NCR-sensitive Gat1 Isoforms
The above results characterized and explained the two constitutively produced Gat1 isoforms appearing in early reports (40). They did not account, however, for similarly early reports that GAT1 gene transcription was highly NCR-sensitive, whereas production of IsoA and IsoB was constitutive. We asked whether there was a connection between the absence of parallel mRNA versus protein responses, the multiple Gat1 translational initiation sites and failure of the first GAT1 ORF methionine to function. At a crude level, we queried which sequences were responsible for nonparallel behavior of GAT1 transcription versus protein production: those upstream or downstream of the first GAT1 AUG? To answer this question, we swapped a heterologous lacZ ORF for the GAT1 ORF (pTSC624) (52). This approach was based on the reasoning that β-galactosidase production from the GAT1-lacZ fusion would detect any departure from typical NCR-sensitive GAT1 transcription, i.e., β-galactosidase would be produced constitutively just as the Gat1 isoforms if constitutivity derived from an unidentified promoter element. If, on the other hand, sequences responsible for constitutive rather than NCR-sensitive Gat1 production were situated downstream of AUG, they would almost certainly be absent in the lacZ ORF, and hence β-galactosidase production would be typically NCR-sensitive rather than constitutive. The lacZ-GAT1 ORF swap was made at GAT1 amino acid residue Leu-61.
GAT1-lacZ fusion (pTSC624) supported normal NCR-sensitive β-galactosidase production (Fig. 7B). Substitution mutations in a 48-bp GAT1 promoter fragment containing five UASGATA elements (Fig. 7A) were then assayed in this heterologous expression system (Fig. 7B). These mutations demonstrated that β-galactosidase production driven by this fragment required the UASGATA elements (Fig. 7B). Together these observations argued that the GAT1 promoter was operating in a typical NCR-sensitive manner, i.e., constitutive Gat1 production could not be explained by the presence of a constitutive upstream activation sequence. Further, whatever accounted for constitutive Gat1 production resided downstream of Gat1 Leu-61.
These results prompted us to investigate the GAT1 coding sequence. Here we focused on the Gat1 N terminus, containing the three methionines required for constitutive Gat1 isoform production. We constructed a gat1M1-S233-MYC13 truncation mutant (pRR1053), which removed the C-terminal half of Gat1, an approach similar to those used in analyses of Gln3 and Sch9 (43, 47). Plasmid pRR1053 contained all of the wild type GAT1 sequences 5′ of the bases encoding Leu-61 in the GAT1 ORF to nucleotide −847. Further, all sequences downstream of Gat1 Ser-233 (Myc13 tag and translation termination site) were identical to those downstream of C-terminal Gat1 Leu-510 in wild type pKA62 and gat1 mutant constructs.
We transformed gat1Δ mutant (FV006) with control plasmid pKA62, producing IsoA and IsoB, or pRR1053, producing the truncated Gat1M1-S233-Myc13 protein. Extracts of these transformants, cultured under our standard conditions, were subjected to Western blot analyses. Gat1 IsoA and IsoB were, as expected, produced constitutively, irrespective of the culture conditions (Fig. 8A, upper panel, lanes 1, 3, and 5, pKA62).
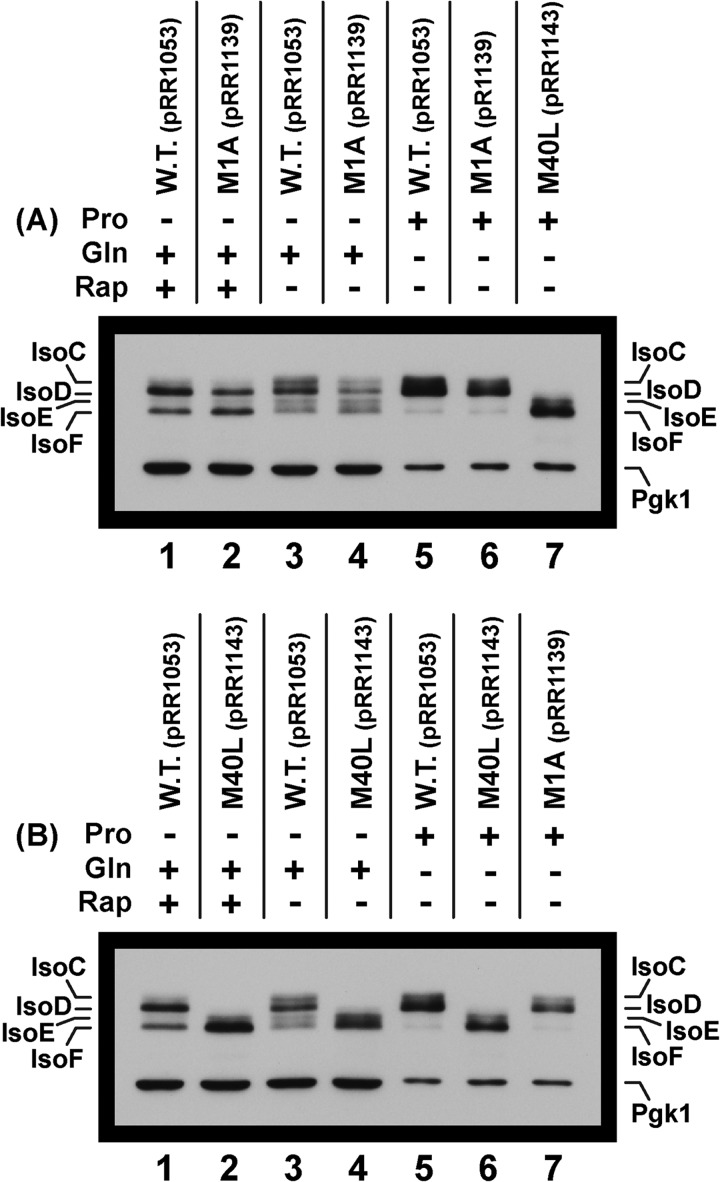
Plasmid pRR1053 supported production of more rapidly migrating truncated isoforms, IsoC, IsoD, and IsoF (Fig. 8A, upper panel). There was also a minor species, designated IsoE, seen only when the blot was overexposed (Fig. 8A, bottom panel, lane 4). This species will become important later. IsoC and IsoD are most easily observed as distinct species in Fig. 8A (lane 4, upper and lower panels). Remarkably, extracts of proline-grown cells contained much greater amounts of IsoC and IsoD than did extracts from glutamine-grown cells (Fig. 8A, upper panel, lane 4 versus lane 6). IsoC and IsoD were highly derepressible as expected of typical NCR-sensitive protein production. Further, the level of IsoA was approximately the same as those of IsoC and IsoD from glutamine-grown cells, i.e., a repressive nitrogen source (Fig. 8A, upper panel, lanes 4–6). IsoF also increased in extracts from proline-grown cells relative to those grown in glutamine (Fig. 8B, lower panel, lane 4 versus lane 6), but to lesser extent than and observed with IsoC and IsoD. Therefore, the regulation of IsoA and IsoB production was completely different from that of IsoC, IsoD, and IsoF. IsoE was not present in sufficient quantities to determine its regulation.
To ensure that observed derepressible production of the truncated Gat1 protein was not the result of the truncated gene being plasmid-borne, we analyzed extracts from truncated gat1-MYC13 situated in its normal chromosomal position (strain FV655) versus the same construct carried on a plasmid (pRR1053). The Western blot profiles were the same (Fig. 8B). Further, in a lighter exposure of this blot, the regulatory responses of extracts from the two constructs were also identical (data not shown). Similar equivalence is observed for extracts of chromosomal versus plasmid-borne full-length wild type genes (compare Fig. 8B with Fig. 8 of Ref. 44 and Fig. 7 of Ref. 46). There remains, however, the unavoidable caveat associated with all experiments involving tagged proteins, i.e., the possibility of the tag affecting the results observed. This caveat could not be eliminated as Gat1-specific antibodies were not available.
Requirements for Derepressible IsoC-F Isoform Production
If IsoC and IsoD production observed in Fig. 8A was indeed NCR-sensitive, several predictions were possible. One should expect the levels of these isoforms in proline-grown cells to be dependent on cis-acting UASGATA elements in the GAT1 promoter and additionally require the transcription activator, Gln3. Both are well documented characteristics of NCR-sensitive transcription (1–4).
To test the first prediction, we constructed 32-bp deletions that removed five UASGATA elements from the promoters of gat1M1-S233-MYC13 and gat1M1-L510-MYC13 (pRR1224 and pRR990, respectively). Note that these are the same UASGATA elements mutated in Fig. 7 (pRA73). Loss of the upstream UASGATA elements dramatically reduced the levels of IsoC and IsoD in extracts from proline-grown cells containing pRR1224 (Fig. 9A, lanes 1–3). IsoF levels were also slightly decreased. Quite unexpectedly, however, loss of the GAT1 upstream UASGATA elements (pRR990) also significantly diminished the levels of IsoA (Fig. 9B, top panel, lanes 1–3). The low levels of IsoB in these proline-grown cells did not permit us to confidently conclude that IsoB production exhibited the same requirement (Fig. 9B, middle panel, lanes 1–3, arrows). Therefore, we concluded that the GAT1 UASGATA elements were required for production of all of the major Gat1 isoforms present in sufficient quantities to convincingly make the determination.
Given the above UASGATA requirement, we tested the second prediction, a correlating Gln3 requirement, by transforming pRR1053 and pKA62 into gat1Δ (FV006) and gln3Δgat1Δ (FV007) mutant recipients and measuring Gat1 isoform production in the proline-grown transformants. IsoC and IsoD production was even more strongly Gln3-dependent than it was UASGATA-dependent (Fig. 9A, lanes 4–6). IsoF levels were also slightly decreased in the gln3Δgat1Δ. When we repeated this experiment using pKA62 transformants, IsoA decreased to a level where the requirement was beyond question (Fig. 9B, top panel, lanes 4–6). Again, IsoB production was too low to draw a firm conclusion, but the available data were suggestive of Gln3-dependent IsoB production as well (Fig. 9B, overexposed middle panel, lanes 4–6, arrows). Together, these data demonstrated that production of the major Gat1 isoforms (IsoA, IsoC, and IsoD) exhibited requirements characteristic of typical NCR-sensitive regulation (1–4). A similar conclusion likely applies to the minor Gat1 isoforms as well, but can presently only be considered suggestive because of the small amounts of material available.
Constitutive and NCR-sensitive Gat1 Isoforms Require the Same Methionine Residues to Initiate Translation
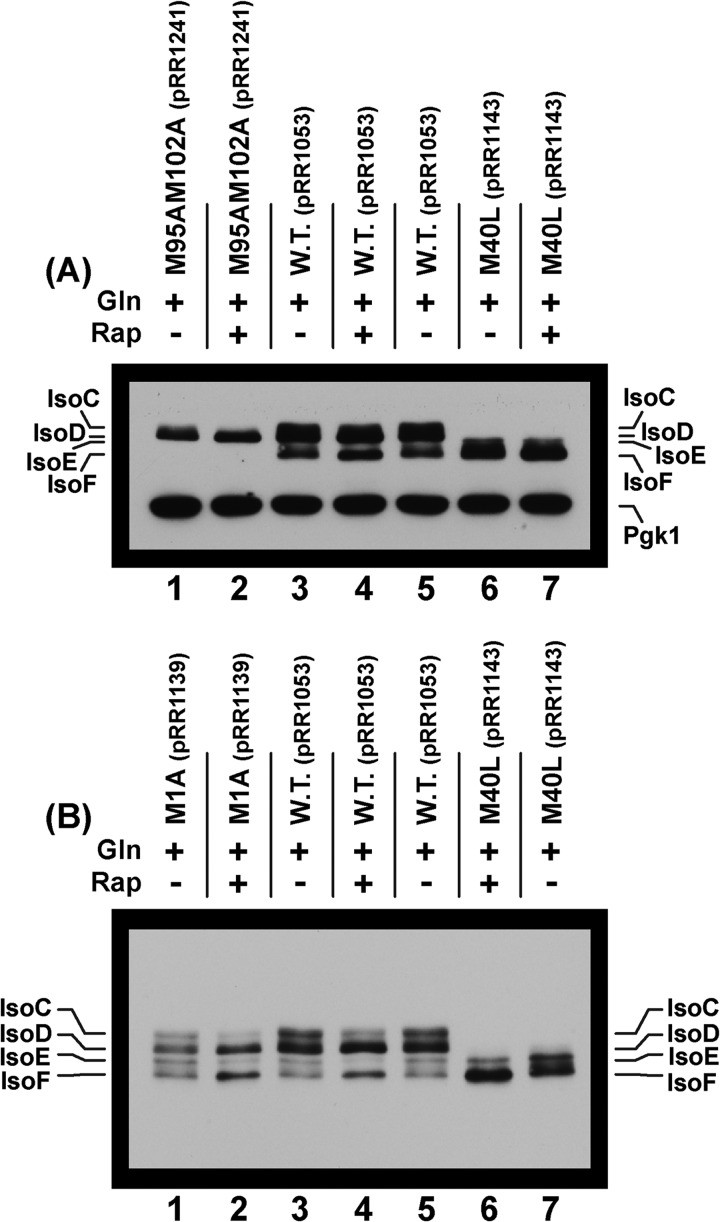
We next queried whether the difference between NCR-sensitive versus constitutive isoform production was related in any way to the rather striking observation that the first in frame methionine of the GAT1 ORF could not be demonstrated to function. To this end, we constructed Gat1 M1A and M40L substitution plasmids (gat1M1-S233,M1A-MYC13, pRR1139 and gat1M1-S233,M40L-MYC13, pRR1143). As occurred with IsoA and IsoB, loss of the first in frame methionine had no effect on the production of the truncated isoforms (Fig. 10A, lanes 3–6; note intentional underloading of lanes 5–7 in Fig. 10, A and B). Further, in a uniformly loaded blot (not shown) the regulated production of these isoforms remained NCR-sensitive in the M1 substitution mutant, identical to the profile in Fig. 8A. In contrast, a Gat1 M40L substitution (gat1M1-S233,M40L-MYC13, pRR1143) abolished the IsoC and IsoD doublet while concomitantly increasing the amount of the IsoE and IsoF doublet (Fig. 10B, lane 5 versus lane 6). These are the observations expected if the IsoE and IsoF doublet were related to the IsoC and IsoD doublet.
FIGURE 10.
Western blots demonstrating that a Gat1 M1A substitution has no effect on production of IsoC, IsoD, and IsoF regardless of the growth conditions assayed, whereas IsoC and IsoD are abolished by a Gat1 M40L substitution. The plasmids used in this experiment were wild type (pRR1053) and Gat1 substitutions Gat1 M1A (pRR1139) and M40L (pRR1143). Note that lanes 5–7 were underloaded to diminish blooming of the signals for the isoforms in derepressive proline medium.
To assess whether IsoE and IsoF production required the same methionine(s) as IsoB, we constructed an M95A,M102A double mutant (gat1M1-S233,M95A,M102A-MYC13, pRR1241). As occurred with IsoB, these substitutions abolished IsoE and IsoF production, even in a highly overexposed blot, without affecting that of IsoC or IsoD (Fig. 11A, lane 1 versus lane 3). The same responses were observed in proline-grown cells (blot not shown). Together, these data indicated that constitutively produced IsoA, required the same methionine, Met-40, as derepressibly produced IsoC and IsoD. Likewise, IsoB, IsoE, and IsoF required Gat1 Met-95/Met-102 for their production. These experiments gave no indication that the multiple Gat1 translational initiation sites were responsible for derepressible IsoC-F production, and hence the striking differences in their regulatory characteristics compared with those of IsoA and IsoB.
FIGURE 11.
A, a Gat1 M95A,M102A double substitution abolishes production of IsoE and IsoF, whereas a Gat1 M40L substitution eliminates IsoC and IsoD. An overexposure was used to detect any minor species if they were present. There was no trace of IsoE and IsoF in the double substitution mutant. B, treating glutamine-grown cells with rapamycin increases the mobilities of the Gat1 isoforms. The Pgk1 standard in the extracts analyzed here migrated off from the bottom of the gel because of conditions of higher resolution electrophoresis. Another blot that was loaded with exactly the same samples and loadings as the high resolution blot depicted here demonstrated uniformity of loading equivalent to that observed in Fig. 9A.
Post-translational Modification of Gat1 Isoforms
Although the above data could not explain constitutive IsoA and B versus derepressible IsoC-F production, further analysis of the data in Fig. 10 may resolve another long standing aberrancy in Gat1 regulation. From initial reports onward, showing rapamycin-elicited nuclear GATA factor localization, multiple laboratories—including our own—have attempted to demonstrate that rapamycin could elicit increased Gat1 electrophoretic mobility characteristic of its dephosphorylation as observed for Gln3 (44, 46). The fact that all of these attempts have failed has been puzzling, because rapamycin treatment elicits a much stronger nuclear relocation response from Gat1 than from Gln3 (45). The relevant critical observation in the present work first appeared in Fig. 8A (lower panel, lane 2 versus lane 4) and in Fig. 10 (A and B, lanes 1–4). In the latter instance, the levels of IsoC and IsoE in untreated wild type, M1A, and M40L substitution mutant cells decreased relative to those in cells treated with rapamycin, whereas IsoD and IsoF increased.
To evaluate this phenomenon in a more convincing manner, a higher resolution Western blot was performed using the same uniformly loaded samples as were analyzed in Fig. 10A. When extracts were prepared from wild type, glutamine-grown cells without and with rapamycin addition, the amounts of IsoC and IsoE decreased markedly with concomitant increases in IsoD and IsoF (Fig. 11B, lanes 3–5). These results were also observed with the M1A substitution mutant (pRR1139) (Fig. 11B, lanes 1 and 2). A similar rapamycin response was observed for IsoE and IsoF in the M40L substitution mutant (Fig. 11B, lane 6 versus lane 7).
The Truncated Gat1 Isoforms Are Constitutively Restricted to the Cytoplasm
The final questions we addressed were the effects of truncating Gat1 on the regulation of its intracellular localization. To this end we transformed pRR1053 (gat1M1-S233-MYC13) or pKA62 (GAT1M1-L510-MYC13) into a gat1Δ and compared their localizations. In contrast with the wild type control (pKA62), truncated Gat1M1-S233-Myc13 was absolutely restricted to the cytoplasm irrespective of the growth conditions or inhibitor treatments employed (Fig. 12).
FIGURE 12.
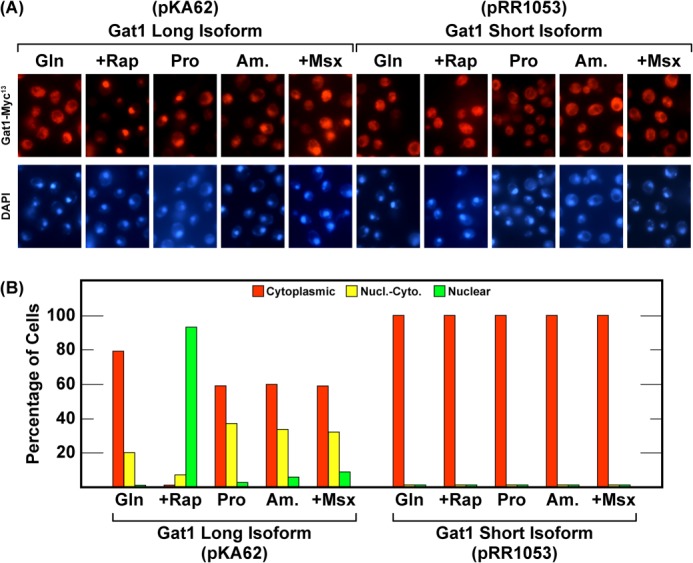
All of the truncated Gat1 isoforms are completely restricted to the cytoplasm under all growth conditions. The experimental format and data presentation are the same as in Figs. 4 and 5.
DISCUSSION
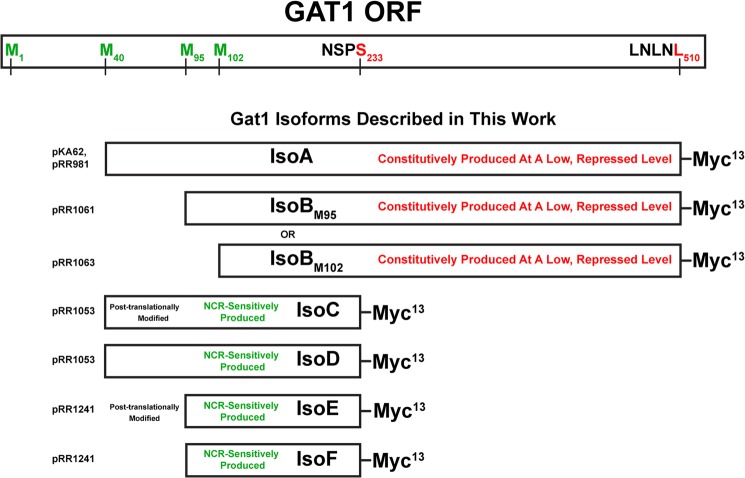
The present data demonstrate remarkable and unexpected complexity in the production and regulated localization of the NCR-sensitive transcription activator, Gat1. Several mechanisms could have explained the formation of two protein species from a single gene: proteolysis, post-translational modifications, or alternative translation. Here, we show that the faster migrating IsoB species did not derive from proteolysis, but from a second and potentially a third independent translational initiation event (Fig. 13). Quite surprisingly, none of the Gat1 isoforms required the first in frame methionine of the GAT1 ORF for their production. Gat1 Met-40 was required for the predominant isoforms, IsoA and truncated IsoC and IsoD, whereas Gat1 Met-95 and/or Gat1 Met-102 were required for production of the minor isoforms, IsoB (and truncated IsoE and IsoF).
FIGURE 13.
Summary of Gat1 isoform structures compared with the GAT1 ORF. Plasmids that generate the indicated isoforms appear on the left of the figure.
The alternative translational initiation phenomena described here may have arisen for any one of several reasons: (i) differential mRNA production over the GAT1 locus (alternative splicing or start site selection); (ii) utilization of several translation start sites, associated with an internal ribosomal entry site(s), caused by leaky ribosome scanning (56, 57); or (iii) ribosome shunting (58, 59). Such regulatory events have been documented with respect to controlled production of DNA-binding proteins (60) or in response to environmental cues or stresses (61, 62). However, in the absence of further evidence, we cannot favor one of the above possibilities over another to explain why Gat1 Met-1 could not be demonstrated to function and how two or perhaps three isoforms differing in their N termini are produced in vivo.
Failure of Gat1 Production to Derepress in Proline Medium
Strikingly different modes of regulation were observed when production of Gat1 isoforms ending at the normal stop codon was compared with that of truncated isoforms ending at Ser-233 (Fig. 13). IsoA and likely IsoB were produced constitutively at a low, repressed level and failed to derepress in poor nitrogen conditions. In striking contrast, production of truncated IsoC and IsoD was highly NCR-sensitive, strongly derepressing in proline medium. However, production of all Gat1 isoforms that could be confidently measured, IsoA, IsoC, and IsoD, were strongly dependent on UASGATA elements in the GAT1 promoter and active Gln3, both typical requirements of NCR-sensitive gene expression. An explanation for the failure of IsoA and IsoB production to derepress in proline medium despite being Gln3- and UASGATA-dependent is a most fascinating, but unanswered conundrum of our experiments. Although this question remains to be addressed in future experiments, we have demonstrated that the sequences likely responsible for these observations reside in the GAT1 coding region because β-galactosidase production derepressed normally in proline medium when the GAT1 ORF was replaced by that of lacZ.
Localization of the Gat1 Isoforms
The individual Gat1 isoforms displayed interesting and sometimes unexpected localization phenotypes. Individually, IsoBM95 or IsoBM102 in the absence of IsoA (Fig. 5, pRR1061 and pRR1063, respectively) were unable to be sequestered in the cytoplasm of glutamine- or ammonia-grown and, to a lesser extent, proline-grown cells, suggesting that Gat1 residues Met-40 to Met-95 are necessary for proper cytoplasmic sequestration of Gat1. On the other hand, IsoA in combination with either IsoBM95 or IsoBM102 possessed wild type localization, indicating that neither single substitution affected Gat1 localization (Fig. 4). However, cytoplasmic sequestration was completely abolished in cells containing only IsoA because of the double M95A,M102A substitution. In more general terms, we observed that each time an isoform localization was characterized in the absence of the two others (in the gat1M95A,M102A-MYC13, gat1M40L,M95A-MYC13, and gat1M40L,M102A-MYC13 mutants), its sequestration was impaired upon growth in repressive conditions and unresponsive to proline. This suggests that either one isoform is required to control the localization of the other or that the mutations that were introduced are located in elements controlling Gat1 localization, e.g., Gat1 sequences that interact with Ure2.
Interestingly, all of these mutants retained their ability to support wild type transcription despite aberrant localization, suggesting that both IsoA and IsoB are capable of mediating NCR-sensitive transcription, indicating that 55 or 62 N-terminal Gat1 residues could be eliminated without seriously compromising the regulated transcriptional activation function of Gat1, despite their requirement for normally regulated subcellular localization. Moreover, despite the observation that Gat1 was highly nuclear in all mutants containing the M40L substitution and in the M95A,M102A double substitution mutant, the absence of DAL5 transcription in glutamine-grown cells indicates that there is an important nuclear component to the Gat1-mediated transcription.
Post-translational Modification of Gat1 Isoforms
Another puzzling characteristic of GATA factor regulation likely explained by the present work concerns post-translational Gat1 modification. Gln3 and Gat1 are both GATA family transcription activators whose nuclear localization and ability to support NCR-sensitive transcription is elicited by rapamycin treatment (5, 9, 29, 41, 44, 45). They differ, however, in that Gln3 electrophoretic mobility increases in rapamycin-treated cells because of dephosphorylation, whereas with Gat1 IsoA and IsoB, it does not. In this regard, it is pertinent that protein secondary structure is not completely lost during SDS-PAGE. A single phosphorylation event has been shown to dramatically alter electrophoretic mobility of human adenovirus E1A protein far beyond what can be accounted for by the additional mass of the phosphate group (63). Conversely, one may speculate that phosphorylation not resulting in a dramatic conformational change in secondary structure might occur but would escape detection during SDS-PAGE. Present work suggests that this may be the case with Gat1 because when the overall protein structure was altered by truncation, we could straightforwardly detect a rapamycin-elicited increase in Gat1 IsoC and IsoF electrophoretic mobilities. A similar situation occurs with Sch9, with rapamycin eliciting a much less convincing increase in the mobility of the full-length protein than observed with a smaller truncated fragment (43, 47). This reasoning suggests that Gat1, like Gln3, is subject to phosphorylation/dephosphorylation, a suggestion consistent with the demonstration of phosphorylated Gat1 peptides detected by mass spectral analysis of the rapamycin-sensitive phosphoproteome (64).
This reasoning and the data presented permit one further potentially important speculation (Fig. 13). Unlike IsoA and IsoB, a Gat1 M40L substitution results in loss of not one but two isoforms, IsoC and IsoD (Fig. 13). Similarly, the M95A,M102A substitutions in the truncated forms of Gat1 also resulted in IsoE and IsoF becoming undetectable. Finally, treating cells with rapamycin resulted in decreased amounts of both IsoC and IsoE but increased those of IsoD and IsoF. These correlations raise the distinct possibility that IsoC and IsoE are post-translationally modified forms of IsoD and IsoF, respectively.
Multiple Questions Still Remain
Although we now have greater appreciation of the complexity and characteristics of the GAT1 gene products, this work generated several new, equivalently puzzling questions. First, why was the first methionine encoded in the GAT1 ORF not required to produce any of the detected Gat1 isoforms? One could speculate that the first 40 in frame amino acids are just excess evolutionary baggage without a relevant function. Alternatively, maintenance of the sequence for the first 40 amino acids derives from the fact that GAT1 sequences upstream of the ATG coding for the first translated methionine (Gat1 Met-40) contain information responsible for the differential transcription and/or translational initiations. This, however, does not explain the open reading frame character of these sequences.
Equally obvious questions surround the physiological significance of the various Gat1 isoforms and mechanisms responsible for their production. IsoA and IsoB are clearly responsible for Gat1-mediated transcriptional activation. This, however, does not explain why two or three long functional isoforms exist. Further, what is the potential physiological significance of the truncated isoforms (IsoC, IsoD, and IsoF) whose production is highly derepressible? This question cannot be effectively answered until their C termini are positively identified. The discovery of Gat1 as an NCR-sensitive activator whose production was also NCR-sensitive correlates with the regulatory behavior of the truncated isoforms but not the long IsoA and IsoB isoforms. This correlation and the fact that all of the sequences 5′ of the codon encoding serine 233 are wild type argue against regulation of the truncated forms being merely an artifact and rather raise the possibility that they may be indicative of some form of undiscovered Gat1 regulation.
This work was supported, in whole or in part, by National Institutes of Health Grant GM-35642 (to J. J. T., R. R., and T. G. C.). This work was also supported by the Commission Communautaire Française and Fonds de la Recherche Fondamentale Collective Grant 2.4547.11 (to I. G. and E. D.).
- NCR
- nitrogen catabolite repression
- Msx
- methionine sulfoximine.
REFERENCES
- 1. Cooper T. G. (1982) Nitrogen metabolism in Saccharomyces cerevisiae. In Molecular Biology of the Yeast Saccharomyces: Metabolism and Gene Expression (Strathern J. N., Jones E. W., Broach J. R., eds) pp. 39–99, Cold Spring Harbor Laboratory, Cold Spring Harbor, NY [Google Scholar]
- 2. Hofman-Bang J. (1999) Nitrogen catabolite repression in Saccharomyces cerevisiae. Mol. Biotechnol. 12, 35–73 [DOI] [PubMed] [Google Scholar]
- 3. Magasanik B., Kaiser C. A. (2002) Nitrogen regulation in Saccharomyces cerevisiae. Gene 290, 1–18 [DOI] [PubMed] [Google Scholar]
- 4. Cooper T. G. (2004) Integrated regulation of the nitrogen-carbon interface. In Nutrient-induced Responses in Eukaryotic Cells, Topics in Current Genetics (Winderickx J., Taylor P. M., eds) Vol. 7, Chapter 9, pp. 225–257, Springer-Verlag; Berlin-Heidelberg [Google Scholar]
- 5. Beck T., Hall M. N. (1999) The TOR signalling pathway controls nuclear localization of nutrient-regulated transcription factors. Nature 402, 689–692 [DOI] [PubMed] [Google Scholar]
- 6. Bertram P. G., Choi J. H., Carvalho J., Ai W., Zeng C., Chan T. F., Zheng X. F. (2000) Tripartite regulation of Gln3p by TOR, Ure2p, and phosphatases. J. Biol. Chem. 275, 35727–35733 [DOI] [PubMed] [Google Scholar]
- 7. Cardenas M. E., Cutler N. S., Lorenz M. C., Di Como C. J., Heitman J. (1999) The TOR signaling cascade regulates gene expression in response to nutrients. Genes Dev. 13, 3271–3279 [DOI] [PMC free article] [PubMed] [Google Scholar]
- 8. Hardwick J. S., Kuruvilla F. G., Tong J. K., Shamji A. F., Schreiber S. L. (1999) Rapamycin-modulated transcription defines the subset of nutrient-sensitive signaling pathways directly controlled by the Tor proteins. Proc. Natl. Acad. Sci. U.S.A. 96, 14866–14870 [DOI] [PMC free article] [PubMed] [Google Scholar]
- 9. Shamji A. F., Kuruvilla F. G., Schreiber S. L. (2000) Partitioning the transcriptional program induced by rapamycin among the effectors of the Tor proteins. Curr. Biol. 10, 1574–1581 [DOI] [PubMed] [Google Scholar]
- 10. Blinder D., Coschigano P. W., Magasanik B. (1996) Interaction of the GATA factor Gln3p with the nitrogen regulator Ure2p in Saccharomyces cerevisiae. J. Bacteriol. 178, 4734–4736 [DOI] [PMC free article] [PubMed] [Google Scholar]
- 11. Daugherty J. R., Rai R., el Berry H. M., Cooper T. G. (1993) Regulatory circuit for responses of nitrogen catabolic gene expression to the GLN3 and DAL80 proteins and nitrogen catabolite repression in Saccharomyces cerevisiae. J. Bacteriol. 175, 64–73 [DOI] [PMC free article] [PubMed] [Google Scholar]
- 12. Coffman J. A., el Berry H. M., Cooper T. G. (1994) The Ure2 protein regulates nitrogen catabolic gene expression through the GATAA-containing UASNTR element in Saccharomyces cerevisiae. J. Bacteriol. 176, 7476–7483 [DOI] [PMC free article] [PubMed] [Google Scholar]
- 13. Coffman J. A., Rai R., Cooper T. G. (1995) Genetic evidence for Gln3p-independent, nitrogen catabolite repression-sensitive gene expression in Saccharomyces cerevisiae. J. Bacteriol. 177, 6910–6918; Correction (1996) J. Bacteriol.178, 2159 [DOI] [PMC free article] [PubMed] [Google Scholar]
- 14. Stanbrough M., Magasanik B. (1995) Transcriptional and posttranslational regulation of the general amino acid permease of Saccharomyces cerevisiae. J. Bacteriol. 177, 94–102 [DOI] [PMC free article] [PubMed] [Google Scholar]
- 15. Stanbrough M., Rowen D. W., Magasanik B. (1995) Role of the GATA factors Gln3p and Nil1p of Saccharomyces cerevisiae in the expression of nitrogen-regulated genes. Proc. Natl. Acad. Sci. U.S.A. 92, 9450–9454 [DOI] [PMC free article] [PubMed] [Google Scholar]
- 16. Coffman J. A., Rai R., Cunningham T., Svetlov V., Cooper T. G. (1996) Gat1p, a GATA family protein whose production is sensitive to nitrogen catabolite repression, participates in transcriptional activation of nitrogen-catabolic genes in Saccharomyces cerevisiae. Mol. Cell. Biol. 16, 847–858 [DOI] [PMC free article] [PubMed] [Google Scholar]
- 17. Coffman J. A., Rai R., Loprete D. M., Cunningham T., Svetlov V., Cooper T. G. (1997) Cross regulation of four GATA factors that control nitrogen catabolic gene expression in Saccharomyces cerevisiae. J. Bacteriol. 179, 3416–3429 [DOI] [PMC free article] [PubMed] [Google Scholar]
- 18. Coffman J., Rai R., Cunningham T., Svetlov V., Cooper T. G. (1996) NCR-sensitive transport gene expression in S. cerevisiae is controlled by a branched regulatory pathway consisting of multiple NCR-responsive activator proteins. Folia Microbiol. (Praha) 41, 85–86 [DOI] [PubMed] [Google Scholar]
- 19. Rowen D. W., Esiobu N., Magasanik B. (1997) Role of GATA factor Nil2p in nitrogen regulation of gene expression in Saccharomyces cerevisiae. J. Bacteriol. 179, 3761–3766 [DOI] [PMC free article] [PubMed] [Google Scholar]
- 20. Soussi-Boudekou S., Vissers S., Urrestarazu A., Jauniaux J. C., André B. (1997) Gzf3p, a fourth GATA factor involved in nitrogen-regulated transcription in Saccharomyces cerevisiae. Mol. Microbiol. 23, 1157–1168 [DOI] [PubMed] [Google Scholar]
- 21. Soussi-Boudekou S., André B. (1999) A co-activator of nitrogen-regulated transcription in Saccharomyces cerevisiae. Mol. Microbiol. 31, 753–762 [DOI] [PubMed] [Google Scholar]
- 22. Cunningham T. S., Cooper T. G. (1993) The Saccharomyces cerevisiae Dal80 repressor protein binds to multiple copies of GATAA-containing sequences (URSGATA). J. Bacteriol. 175, 5851–5861 [DOI] [PMC free article] [PubMed] [Google Scholar]
- 23. Cunningham T. S., Svetlov V. V., Rai R., Smart W., Cooper T. G. (1996) G1n3p is capable of binding to UAS(NTR) elements and activating transcription in Saccharomyces cerevisiae. J. Bacteriol. 178, 3470–3479 [DOI] [PMC free article] [PubMed] [Google Scholar]
- 24. Georis I., Feller A., Vierendeels F., Dubois E. (2009) The yeast GATA factor Gat1 occupies a central position in nitrogen catabolite repression-sensitive gene activation. Mol. Cell. Biol. 29, 3803–3815 [DOI] [PMC free article] [PubMed] [Google Scholar]
- 25. Georis I., Feller A., Tate J. J., Cooper T. G., Dubois E. (2009) Nitrogen catabolite repression-sensitive transcription as a readout of Tor pathway regulation. The genetic background, reporter gene and GATA factor assayed determine the outcomes. Genetics 181, 861–874; Correction (2010) Genetics182, 927 [DOI] [PMC free article] [PubMed] [Google Scholar]
- 26. Broach J. R. (2012) Nutritional control of growth and development in yeast. Genetics 192, 73–105 [DOI] [PMC free article] [PubMed] [Google Scholar]
- 27. Crespo J. L., Powers T., Fowler B., Hall M. N. (2002) The TOR-controlled transcription activators Gln3, Rtg1, and Rtg3 are regulated in response to intracellular levels of glutamine. Proc. Natl. Acad. Sci. U.S.A. 99, 6784–6789 [DOI] [PMC free article] [PubMed] [Google Scholar]
- 28. Jacinto E., Guo B., Arndt K. T., Schmelzle T., Hall M. N. (2001) TIP41 interacts with TAP42 and negatively regulates the TOR signaling pathway. Mol. Cell. 8, 1017–1026 [DOI] [PubMed] [Google Scholar]
- 29. Kuruvilla F. G., Shamji A. F., Schreiber S. L. (2001) Carbon- and nitrogen-quality signaling to translation are mediated by distinct GATA-type transcription factors. Proc. Natl. Acad. Sci. U.S.A. 98, 7283–7288 [DOI] [PMC free article] [PubMed] [Google Scholar]
- 30. Loewith R., Jacinto E., Wullschleger S., Lorberg A., Crespo J. L., Bonenfant D., Oppliger W., Jenoe P., Hall M. N. (2002) Two TOR complexes, only one of which is rapamycin sensitive, have distinct roles in cell growth control. Mol. Cell. 10, 457–468 [DOI] [PubMed] [Google Scholar]
- 31. Cox K. H., Tate J. J., Cooper T. G. (2002) Cytoplasmic compartmentation of Gln3 during nitrogen catabolite repression and the mechanism of its nuclear localization during carbon starvation in Saccharomyces cerevisiae. J. Biol. Chem. 277, 37559–37566 [DOI] [PMC free article] [PubMed] [Google Scholar]
- 32. Bertram P. G., Choi J. H., Carvalho J., Chan T. F., Ai W., Zheng X. F. (2002) Convergence of TOR-nitrogen and Snf1-glucose signaling pathways onto Gln3. Mol. Cell. Biol. 22, 1246–1252 [DOI] [PMC free article] [PubMed] [Google Scholar]
- 33. Chen E. J., Kaiser C. A. (2003) LST8 negatively regulates amino acid biosynthesis as a component of the TOR pathway. J. Cell Biol. 161, 333–347 [DOI] [PMC free article] [PubMed] [Google Scholar]
- 34. Carvalho J., Zheng X. F. (2003) Domains of Gln3p interacting with karyopherins, Ure2p, and the target of rapamycin protein. J. Biol. Chem. 278, 16878–16886 [DOI] [PubMed] [Google Scholar]
- 35. Wang H., Wang X., Jiang Y. (2003) Interaction with Tap42 is required for the essential function of Sit4 and type 2A phosphatases. Mol. Biol. Cell 14, 4342–4351 [DOI] [PMC free article] [PubMed] [Google Scholar]
- 36. Reinke A., Anderson S., McCaffery J. M., Yates J., 3rd, Aronova S., Chu S., Fairclough S., Iverson C., Wedaman K. P., Powers T. (2004) TOR complex 1 includes a novel component, Tco89p (YPL180w), and cooperates with Ssd1p to maintain cellular integrity in Saccharomyces cerevisiae. J. Biol. Chem. 279, 14752–14762 [DOI] [PubMed] [Google Scholar]
- 37. Cox K. H., Kulkarni A., Tate J. J., Cooper T. G. (2004) Gln3 phosphorylation and intracellular localization in nutrient limitation and starvation differ from those generated by rapamycin inhibition of Tor1/2 in Saccharomyces cerevisiae. J. Biol. Chem. 279, 10270–10278 [DOI] [PMC free article] [PubMed] [Google Scholar]
- 38. Tate J. J., Rai R., Cooper T. G. (2005) Methionine sulfoximine treatment and carbon starvation elicit Snf1-independent phosphorylation of the transcription activator Gln3 in Saccharomyces cerevisiae. J. Biol. Chem. 280, 27195–27204; Correction (2007) J. Biol. Chem.282, 13139 [DOI] [PMC free article] [PubMed] [Google Scholar]
- 39. Tate J. J., Feller A., Dubois E., Cooper T. G. (2006) Saccharomyces cerevisiae Sit4 phosphatase is active irrespective of the nitrogen source provided, and Gln3 phosphorylation levels become nitrogen source-responsive in a sit4-deleted strain. J. Biol. Chem. 281, 37980–37992 [DOI] [PMC free article] [PubMed] [Google Scholar]
- 40. Kulkarni A., Buford T. D., Rai R., Cooper T. G. (2006) Differing responses of Gat1 and Gln3 phosphorylation and localization to rapamycin and methionine sulfoximine treatment in Saccharomyces cerevisiae. FEMS Yeast Res. 6, 218–229 [DOI] [PMC free article] [PubMed] [Google Scholar]
- 41. Georis I., Tate J. J., Cooper T. G., Dubois E. (2008) Tor pathway control of the nitrogen-responsive DAL5 gene bifurcates at the level of Gln3 and Gat1 regulation in Saccharomyces cerevisiae. J. Biol. Chem. 283, 8919–8929 [DOI] [PMC free article] [PubMed] [Google Scholar]
- 42. Tate J. J., Georis I., Feller A., Dubois E., Cooper T. G. (2009) Rapamycin-induced Gln3 dephosphorylation is insufficient for nuclear localization. Sit4 and PP2A phosphatases are regulated and function differently. J. Biol. Chem. 284, 2522–2534 [DOI] [PMC free article] [PubMed] [Google Scholar]
- 43. Binda M., Péli-Gulli M. P., Bonfils G., Panchaud N., Urban J., Sturgill T. W., Loewith R., De Virgilio C. (2009) The Vam6 GEF controls TORC1 by activating the EGO complex. Mol. Cell 35, 563–573 [DOI] [PubMed] [Google Scholar]
- 44. Tate J. J., Georis I., Dubois E., Cooper T. G. (2010) Distinct phosphatase requirements and GATA factor responses to nitrogen catabolite repression and rapamycin treatment in Saccharomyces cerevisiae. J. Biol. Chem. 285, 17880–17895 [DOI] [PMC free article] [PubMed] [Google Scholar]
- 45. Georis I., Tate J. J., Cooper T. G., Dubois E. (2011) Nitrogen-responsive regulation of GATA protein family activators Gln3 and Gat1 occurs by two distinct pathways, one inhibited by rapamycin and the other by methionine sulfoximine. J. Biol. Chem. 286, 44897–44912 [DOI] [PMC free article] [PubMed] [Google Scholar]
- 46. Georis I., Tate J. J., Feller A., Cooper T. G., Dubois E. (2011) Intranuclear function for protein phosphatase 2A. Pph21 and Pph22 are required for rapamycin-induced GATA factor binding to the DAL5 promoter in yeast. Mol. Cell. Biol. 31, 92–104 [DOI] [PMC free article] [PubMed] [Google Scholar]
- 47. Bonfils G., Jaquenoud M., Bontron S., Ostrowicz C., Ungermann C., De Virgilio C. (2012) Leucyl-tRNA synthetase controls TORC1 via the EGO complex. Mol. Cell 46, 105–110 [DOI] [PubMed] [Google Scholar]
- 48. Feller A., Georis I., Tate J. J., Cooper T. G., Dubois E. (2013) Alterations in the Ure2 αCap domain elicit different GATA factor responses to rapamycin treatment and nitrogen limitation. J. Biol. Chem. 288, 1841–1855 [DOI] [PMC free article] [PubMed] [Google Scholar]
- 49. Rai R., Tate J. J., Nelson D. R., Cooper T. G. (2013) gln3 mutations dissociate responses to nitrogen limitation (nitrogen catabolite repression) and rapamycin inhibition of TorC1. J. Biol. Chem. 288, 2789–2804 [DOI] [PMC free article] [PubMed] [Google Scholar]
- 50. Tate J. J., Cooper T. G. (2013) Five conditions commonly used to down-regulate TorC1 generate different physiological situations exhibiting distinct requirements and outcomes. J. Biol. Chem. 288, 27243–27262 [DOI] [PMC free article] [PubMed] [Google Scholar]
- 51. Longtine M. S., McKenzie A., 3rd, Demarini D. J., Shah N. G., Wach A., Brachat A., Philippsen P., Pringle J. R. (1998) Additional modules for versatile and economical PCR-based gene deletion and modification in Saccharomyces cerevisiae. Yeast 14, 953–961 [DOI] [PubMed] [Google Scholar]
- 52. Park H. D., Luche R. M., Cooper T. G. (1992) The yeast UME6 gene product is required for transcriptional repression mediated by the CAR1 URS1 repressor binding site. Nucleic Acids Res. 20, 1909–1915 [DOI] [PMC free article] [PubMed] [Google Scholar]
- 53. Liu Z., Thornton J., Spírek M., Butow R. A. (2008) Activation of the SPS amino acid-sensing pathway in Saccharomyces cerevisiae correlates with the phosphorylation state of a sensor component, Ptr3. Mol. Cell. Biol. 28, 551–563 [DOI] [PMC free article] [PubMed] [Google Scholar]
- 54. Tate J. J., Rai R., Cooper T. G. (2006) Ammonia-specific regulation of Gln3 localization in Saccharomyces cerevisiae by protein kinase Npr1. J. Biol. Chem. 281, 28460–28469 [DOI] [PMC free article] [PubMed] [Google Scholar]
- 55. Miller J. H. (1972) Experiments in Molecular Genetics, p. 403, Cold Spring Harbor Laboratory, Cold Spring Harbor, NY [Google Scholar]
- 56. Baird S. D., Turcotte M., Korneluk R. G., Holcik M. (2006) Searching for IRES. RNA 12, 1755–1785 [DOI] [PMC free article] [PubMed] [Google Scholar]
- 57. Kozak M. (2002) Pushing the limits of the scanning mechanism for initiation of translation. Gene 299, 1–34 [DOI] [PMC free article] [PubMed] [Google Scholar]
- 58. Mauro V. P., Chappell S. A., Dresios J. (2007) Analysis of ribosomal shunting during translation initiation in eukaryotic mRNAs. Methods Enzymol. 429, 323–354 [DOI] [PubMed] [Google Scholar]
- 59. Fournier C. T., Cherny J. J., Truncali K., Robbins-Pianka A., Lin M. S., Krizanc D., Weir M. P. (2012) Amino termini of many yeast proteins map to downstream start codons. J. Proteome Res. 11, 5712–5719 [DOI] [PMC free article] [PubMed] [Google Scholar]
- 60. Nagalakshmi U., Wang Z., Waern K., Shou C., Raha D., Gerstein M., Snyder M. (2008) The transcriptional landscape of the yeast genome defined by RNA sequencing. Science 320, 1344–1349 [DOI] [PMC free article] [PubMed] [Google Scholar]
- 61. Vilela C., Linz B., Rodrigues-Pousada C., McCarthy J. E. (1998) The yeast transcription factor genes YAP1 and YAP2 are subject to differential control at the levels of both translation and mRNA stability. Nucleic Acids Res. 26, 1150–1159 [DOI] [PMC free article] [PubMed] [Google Scholar]
- 62. Frederiks F., Heynen G. J., van Deventer S. J., Janssen H., van Leeuwen F. (2009) Two Dot1 isoforms in Saccharomyces cerevisiae as a result of leaky scanning by the ribosome. Nucleic Acids Res. 37, 7047–7058 [DOI] [PMC free article] [PubMed] [Google Scholar]
- 63. Smith C. L., Debouck C., Rosenberg M., Culp J. S. (1989) Phosphorylation of serine residue 89 of human adenovirus E1A proteins is responsible for their characteristic electrophoretic mobility shifts, and its mutation affects biological function. J. Virol. 63, 1569–1577 [DOI] [PMC free article] [PubMed] [Google Scholar]
- 64. Soulard A., Cremonesi A., Moes S., Schütz F., Jenö P., Hall M. N. (2010) The rapamycin-sensitive phosphoproteome reveals that TOR controls protein kinase A toward some but not all substrates. Mol. Biol. Cell 21, 3475–3486 [DOI] [PMC free article] [PubMed] [Google Scholar]


