Abstract
Background:
Oral submucous fibrosis (OSF) is a pre-cancerous condition with features of chronic, inflammatory and progressive sub-epithelial fibrotic disorder of the buccal mucosa. In this study, malignant potentiality of OSF has been assessed by quantification of immunohistochemical expression of epithelial prime regulator-p63 molecule in correlation to its malignant (oral squamous cell carcinoma [OSCC] and normal counterpart [normal oral mucosa [NOM]). Attributes of spatial extent and distribution of p63+ expression in the epithelium have been investigated. Further, a correlated assessment of histopathological attributes inferred from H&E staining and their mathematical counterparts (molecular pathology of p63) have been proposed. The suggested analytical framework envisaged standardization of the immunohistochemistry evaluation procedure for the molecular marker, using computer-aided image analysis, toward enhancing its prognostic value.
Subjects and Methods:
In histopathologically confirmed OSF, OSCC and NOM tissue sections, p63+ nuclei were localized and segmented by identifying regional maxima in plateau-like intensity spatial profiles of nuclei. The clustered nuclei were localized and segmented by identifying concave points in the morphometry and by marker-controlled watersheds. Voronoi tessellations were constructed around nuclei centroids and mean values of spatial-relation metrics such as tessellation area, tessellation perimeter, roundness factor and disorder of the area were extracted. Morphology and extent of expression are characterized by area, diameter, perimeter, compactness, eccentricity and density, fraction of p63+ expression and expression distance of p63+ nuclei.
Results:
Correlative framework between histopathological features characterizing malignant potentiality and their quantitative p63 counterparts was developed. Statistical analyses of mathematical trends were evaluated between different biologically relevant combinations: (i) NOM to oral submucous fibrosis without dysplasia (OSFWT) (ii) NOM to oral submucous fibrosis with dysplasia (OSFWD) (iii) OSFWT-OSFWD (iv) OSFWD-OSCC. Significant histopathogical correlates and their corroborative mathematical features, inferred from p63 staining, were also investigated into.
Conclusion:
Quantitative assessment and correlative analysis identified mathematical features related to hyperplasia, cellular stratification, differentiation and maturation, shape and size, nuclear crowding and nucleocytoplasmic ratio. It is envisaged that this approach for analyzing the p63 expression and its distribution pattern may help to establish it as a quantitative bio-marker to predict the malignant potentiality and progression. The proposed work would be a value addition to the gold standard by incorporating an observer-independent framework for the associated molecular pathology.
Keywords: Dysplasia, graph theory, oral squamous cell carcinoma, oral submucous fibrosis, p63, quantitative immunohistochemistry
INTRODUCTION
Oral carcinoma is reported as a global health priority especially for the developing world and registers an annual incidence rate of over 263,900 new cases and over 128,000 mortality.[1,2] Pathogenesis of this cancer is often associated with progression through pre-cancerous lesions such as leukoplakia, erythroplakia, lichen planus etc., or through conditions like oral submucous fibrosis (OSF).[3] Among these pre-cancers, OSF is a high risk condition with prevalence of 0.3-3.2% in the Indian population and contributing to over one-thirds of all oral pre-cancers progressing into oral squamous cell carcinoma (OSCC).[4] OSF is a chronic, inflammatory and progressive fibrotic disorder of the oral mucosa.[5] Progression of OSF into carcinomatous conditions is often through dysplastic changes in the epithelial architecture. Dysplasia is associated with disturbance in the epithelial architecture and increased atypical manifestations in the cells constituting the squamous layer. OSF is graded into oral submucous fibrosis without dysplasia (OSFWT) and oral submucous fibrosis with dysplasia (OSFWD) based on histopathological findings of the architectural changes, loss of cellular maturation and stratification with a loss of cell-cell adhesion, cellular polarity, hyperplasia of basal cells, change in rete ridge shapes and thickness of basement membrane.[6] Despite the development of molecular markers for its assessment, the understanding of OSF's malignant potentiality and the mechanism responsible for its transformation is still not completely known and remains an open topic for investigation.[7]
In the context of assessment of malignant potentiality of OSF, proteomic study of epithelial master regulator – p63 has improved understanding of the state of progressive maturation process of epithelial cells in normal and disease conditions. This has been instrumental in resolving diagnostic ambiguities in the assessment of OSF.[8] p63 protein is responsible for maintaining the turnover and regulation of epithelial cell related to its proliferation, stratification, differentiation, maintenance and maturation of the oral squamous epithelium.[9] It promotes the viability and maintenance of basal epithelial and cancer cells and specifies the epithelial cell lineage promoting squamous differentiation. The expression pattern of p63 molecule is evaluated through immunohistochemistry (IHC) studies and its altered expressional state is a molecular signature predisposed toward malignancy.[8]
Computerized image analysis (CIA) based assessment of immunostaining pattern enables objective interpretation and quantification for differential diagnosis of the state of pathology elucidated by the tissue being investigated. Yaziji and Barry in their investigations on Diagnostic Immuhistochemistry reported the main biases in conventional methods of semi-quantitative diagnostic reporting viz. reaction bias (in specimen fixation, tissue processing, antigen retrieval and detection system) and interpretation bias (in the selection of antibody panels, sensitivity of the chosen panel, choice of antibody types and clones, results and literature interpretation).[10] In this context, CIA has been identified as an approach which can lead to wider applicability and standardization of IHC procedures. This approach is reported as immune to subjectivity and intra- and inter-observer bias of the Pathologist and is higher than conventional methods in terms of precision and quantitative reproducibility.[11,12]
Immunochemical reactivity has been reported within cells - in nucleus, membrane or cytoplasm or in the stroma. Assessment of the reactivity is conventionally two-fold, in relation to its intensity, or in relation to its extent; or both.[12] In the present work, p63 IHC expression has been observed to have attributes related to both intensity and the extent of expression. This expression has been established to augment the understanding of the altered state of arrangement, distribution, differentiation, maturation and population of the oral epithelial cells in atrophic or dysplastic conditions of OSF.[8,11] The phenotypic signatures of IHC expression related to its intensity are well-investigated and it has been conclusively reported that it increases during the progression of the disease (from normal to severe dysplasia).[8]
In the present work, the attributes on the spatial extent and distribution of the positive p63 expression in the affected epithelium have been investigated. The p63 molecular expression is predominantly nuclear and the presented approach reports a selected pool of computer extracted biologically relevant features, which would act as mathematical bio-markers and are aimed at characterizing object-level shape and morphology, the distribution density and spatial arrangement.[13] The spatial arrangement is assessed by constructing topological graphs (Voronoi spatial tessellations) using graph-theoretic approaches.[14] Using the constructed graph, spatial-relation metrics are automatically extracted, which characterize the tissue's pathological state and degree of tissue dysplasia. This subset of biologically potential mathematical biomarkers would help to reduce the ambiguity and augment specificity of our understanding of alterations in the p63 distribution pattern as disease progresses through OSF into carcinoma. It is envisaged that investigating OSF using these mathematical features would reduce inter and intra-observer variability associated with assessment of dysplasia, over and under grading of disease level and subjectivity in qualitative image analysis. The novel points about the proposed framework are as listed below
Value-addition to existing qualitative analysis of IHC expression of nuclear stains like p63.
Establishment of p63 as a reliable biomarker for assessment of malignant potentiality of OSF.
Increased prognostic value over classical histology for better reliability and reproducibility of results and associated inferences.
Increased robustness for assessment due to reduced methodological bias and reduced intra and inter observer variability.
First work on quantitative assessment of the extent and spatial arrangement of p63+ nuclei using graph theory in the context of OSF.
Extension of understanding of classical histopathological attributes for OSF assessment in the context of a correlative framework with quantitative features characterizing molecular pathological signatures.
The scope of the presented work is to improve the prognostic value of the histopathological findings by corroborating crucial molecular pathology attributes (as p63 is a master regulator of oral stratified epithelium) which has a significant impact in indicating alteration/deregulation in the homeostatic control of the oral stratified epithelium. The work is also aimed at improving the prognostic judgments of expert pathologists by providing a knowledgebase of observer-independent feature trends associated with different stages of OSF as inferred by computational image analysis and feature extraction on the IHC stained image being investigated.
SUBJECTS AND METHODS
Sample Collection
For the present study, a total of 61 incisional oral biopsy specimens were collected and histopathologically graded by expert pathologists. Among these, 42 specimens were confirmed as OSF with 22 graded as OSFWD and 20 as OSFWT. The OSCC was confirmed in 9 samples. Further for constituting a control study group, 10 tissue specimens were surgically excised as superfluous tissues during trans-alveolar and intra-alveolar root-canal extractions. The normal oral mucosa (NOM) tissue samples form the control group while the specimens graded as OSF form the case group. The above biopsies were performed at the Guru Nanak Institute of Dental Science and Research (GNIDSR), Kolkata, India. It was ensured that the specimens were collected under informed consent of patients and adhering to the ethical clearance of GNIDSR (GNIDSR/IEC/07/15).
The inclusion/exclusion criterions for specimen collection are as follows: All patients had deleterious oral habits such as smoking tobacco, chewing betel quid, areca nut etc., and presented characteristic clinicopathological symptoms of OSF; samples were histopathologically confirmed by oncopathologists and co-morbid samples were excluded; the minimal sub-epithelial thickness devoid of inflammation was set heuristically at 50 μm and non-compliant samples were excluded. The samples graded as dysplastic were confirmed to at least one of the following diagnostic features such as polymorphism, dyskeratosis, mitosis in supra-basal layer or atypical mitosis.
Tissue Processing
H&E Staining (Histopathological Gold Standard)
The excised tissue samples were fixed in 10% phosphate buffered formalin and processed for obtaining 5 μm thick paraffin sections and subsequently placed on albumin-coated (chicken-egg) glass slide. Following this, the slides were de-paraffinated by 10-20 min of xylene treatment. These sections were stained with Harris’ Hematoxylin (Cat. No. AG2AF62372, Merck, Mumbai, India) and counter-stained with eosin – yellowish (Cat. No. MI7M572117, Merck, Mumbai, India).
p63 IHC Staining
An adjoining tissue section was microtomed and subsequently placed on poly-L-lysine (Cat. No. P8920, Sigma Aldrich, St Louis, Missouri, USA) coated glass slides for p63 IHC staining. This tissue sections were subsequently baked for 1 h at 60°C for better attachment with the slides followed by 10-20 min xylene treatment for de-paraffinization and sections were then subjected to antigen retrieval (EZ-Retriever System V.2, BioGenex, San Ramon, CA, USA) in 10 mM Tris-ethylenediaminetetraacetic acid buffer (pH 9.0) for 20 min. Subsequently, the sections were immunostained using the IHC kit (Super Sensitive™ Polymer HRP IHC Detection System Cat. No: QD420 - YIKE BioGenex, San Ramon, CA, USA). The immunostained sections were then incubated at 37°C for 1 h with primary antibody (Anti-p63, human specific, monoclonal, EPR5701, Cat. No. 5353-1) in 1/500 dilution. Binding of primary antibody was detected by a HRP conjugated secondary antibody using the chromogen 3,3’diaminobenzidine and counterstained with Harris’ Hematoxylin (Cat. No. AG2AF62372, Merck, Mumbai, India).
Slides Digitization and Pathological Grading
The images were grabbed manually using a bright field inverted microscope (Zeiss Observer. Z1, Carl Zeiss, Germany) under × 10 A-plan objective (NA 0.25, with final magnification × 100) with a resolution of 0.63 μm. The images were digitized to a pixel range of 1388 × 1040 pixels using the charge-coupled device-camera (AxioCamMRc, pixel size 6.45 μm × 6.45 μm). The image grabbing and pre-processing software package was inbuilt into the support AxioVision 4.7.2 (Carl Zeiss, Germany) software platform. The pre-processing protocol included shading correction and auto-white balance to ensure consistency in image quality and chromogenic attributes. The grabbed images were evaluated for their suitability for the present study by the expert pathologists. The selected images were annotated with appropriate disease grading and pooled into four major study groups: NOM, OSFWT, OSFWD and OSCC.
Image Analysis Framework
Prerequisite to quantitative assessment of nuclei morphology, density and spatial arrangement is proper localization and faithful segmentation of the structures of interest (i.e. the nuclei with positive expression). For the proposed framework, the complete image analysis schema for processing the input p63 image to extract the associated representative feature set is graphically illustrated in Figure 1. The proposed schema for a localized structural segmentation of p63+ nuclei was organized into the following sub-modules (Image pre-processing and conditioning; tissue classification and region of interest extraction; nuclei localization and segmentation; segregation of aggregating nuclei) as discussed in the subsequent sections.
Figure 1.
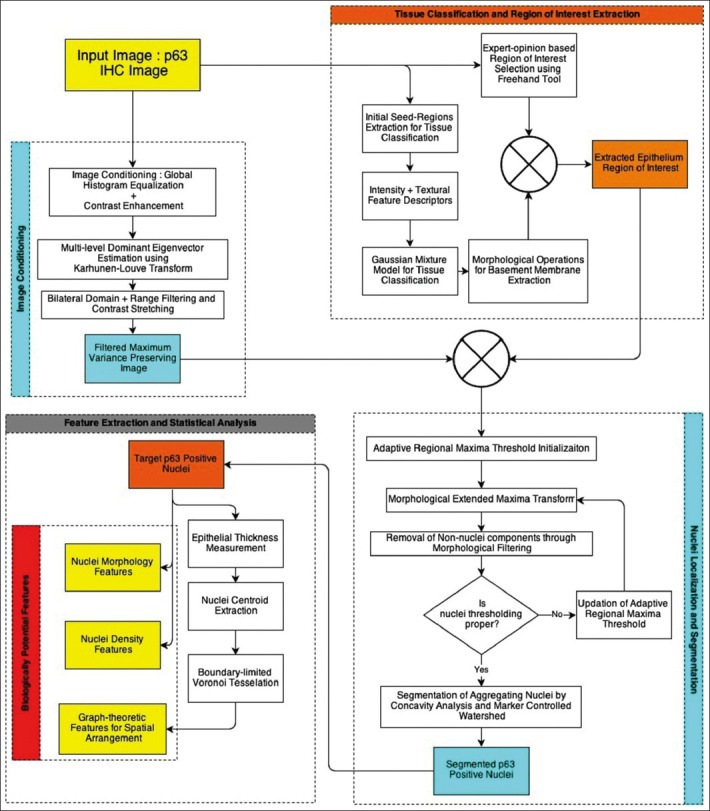
Framework for analysis and quantitative feature extraction from p63 immunohistochemistry images
Image Pre-processing and Conditioning
Prior to quantitative image analysis of histochemical images, normalization of images to a standard color scheme is required to minimize differences due to staining and illumination conditions during image scanning (such as exposure time, sample illumination intensity and user-defined white-balancing settings). Chroma-information associated with in IHC images was preserved in this image enhancement procedure as it was generally related to degree of expression of the target molecule. Therefore, in the proposed framework inter and intra-observer variability in staining and scanning was standardized using a chroma-preserving histogram-equalization framework. The original image acquired in the RGB color space was transformed into CIELa*b* color space. This color space optimally separated the luma component L from the chroma components a* and b*, thus facilitating normalization of illumination and preserving the color information.[15] In the proposed framework, the image appearance and quality were normalized using global histogram equalization based contrast enhancement. The L component of the corresponding La*b* channels was histogram equalized to render Leq (equalized L-channel), which was in turn used to get back the RGB color space using the inverse transformation (CIELa*b* to RGB). This proposed method has been observed to improve the contrast and enhance their white-balance of poorly illuminated images, thus increasing the information content (entropy) and enhancing the global visual appearance. The flow for a pre-processing of randomly-selected poorly illuminated image is illustrated in Figure 2a and b. There is an overall improvement in the perceptual quality of the image and the structures of interest (i.e. positive nuclei).
Figure 2.

Schema for color normalization, non-uniform illumination correction and maximum variance image generation from filtered enhanced image using Karhunen-Loùve transform
Following the histogram based color-preserving contrast enhancement, the maximal contrast image plane best suited for nuclei segmentation was to be extracted. The nuclei correspond to the brown-channel, which was not associated with any of the pure RGB channels or their complementary CMY channels. Investigations into dimensionality reduction methods, established that multi-level dominant eigenvector estimation using the Karhunen-Loùve Transform produced the plane best suited for nuclei segmentation. Figure 2b and c illustrated the maximal contrast plane estimation on a randomly selected image using the proposed framework. This procedure preserved over 97.6% variance of the image contrast and thus effectively compressed the available multi-channel information into a single unified channel.
The maximal variance image was further filtered using edge-preserving bilateral range and domain filtering to suppress any image compression artefacts, impulse noise and Gaussian noise. This method has been established to preserve edges as it effectively combines the local information derived from geometric closeness (measured using Manhattan distance) and their photometric similarity. This filter algorithm is discussed in detail in[16] and its technical design and implementation aspects are beyond the scope of the presented work. The optimal parameters for filter producing the maximal average Peak-Signal-to-Noise Ratio (PSNR) of 42.32 dB (Average Original PSNR value: 33.21 dB) was observed for geometric filter parameter σr = 30 and domain filter parameter σd = 10. This filtering procedure generated a filtered maximum-variance preserving image, which was used in further processing stages for nuclei extraction.
Tissue Classification and Region of Interest Extraction
In the presented work, analysis of epithelial dysplasia in OSF is performed in a region of interest selected and labeled by an expert oncopathologist. The region of interest encompassed the complete epithelial thickness between the basement membrane and the stratum corneum as shown in Figure 3. For ease of selection, the expert used a free-hand selection tool to label out in a rough fashion, which was further fine-tuned automatically. This fine-boundary extraction procedure required accurate segmentation of the basement membrane, which was performed using a learning model-based tissue classification approach. Basement membrane was structurally located at the interface between the epithelium and the sub-epithelial regions of the tissue. Thus by extracting these tissue regions we could extract the shared boundary, which corresponds to the basement membrane. For tissue classification, the expert selected tissue-specific seed regions are used to learn a Gaussian Mixture Model for tissue classification into three-classes: Epithelium, Sub-Epithelium and Background. The model's tissue feature descriptors were defined for the CIELa*b* color space and comprised of intensity (L-channel), chroma (a*-channel and b*-channel) and local texture descriptors (Range and Standard Deviation filters in a 5 × 5 window). The theoretical framework for GMM is presented in detail in Permuter et al., 2006 and is beyond the scope of the presented work. The learnt GMM model is applied to the unlabeled tissue regions and the corresponding tissue labels are allotted based on a Bayesian maxima a posteriori criterion.[17] The extracted tissue regions were further morphologically processed for removing stray tissue regions, fill holes and smoothen the tissue boundaries. The common boundary pixels between the epithelium and the sub-epithelium tissue regions were extracted and labeled as the basement membrane. The manually selected freehand region of interest was boundary limited by the epithelial tissue regions as obtained from the tissue classification procedure and the extracted epithelial region of interest was considered further for nuclei localization and segmentation procedures [Figure 4].
Figure 3.
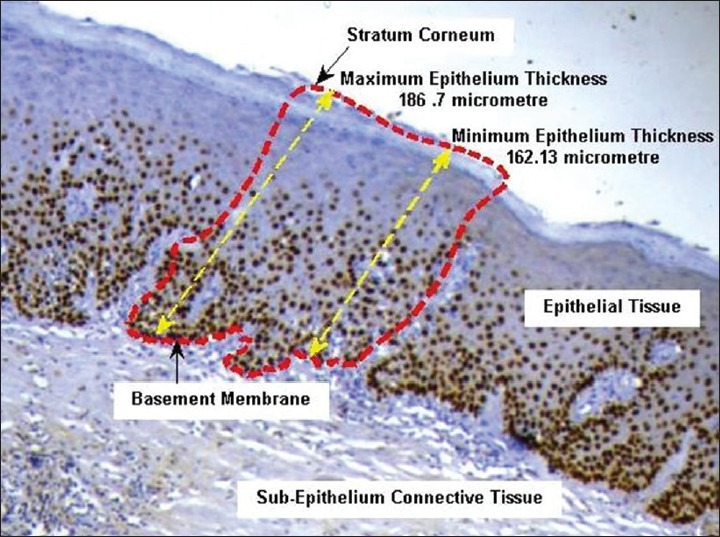
Epithelial thickness measurement in the region of interest
Figure 4.
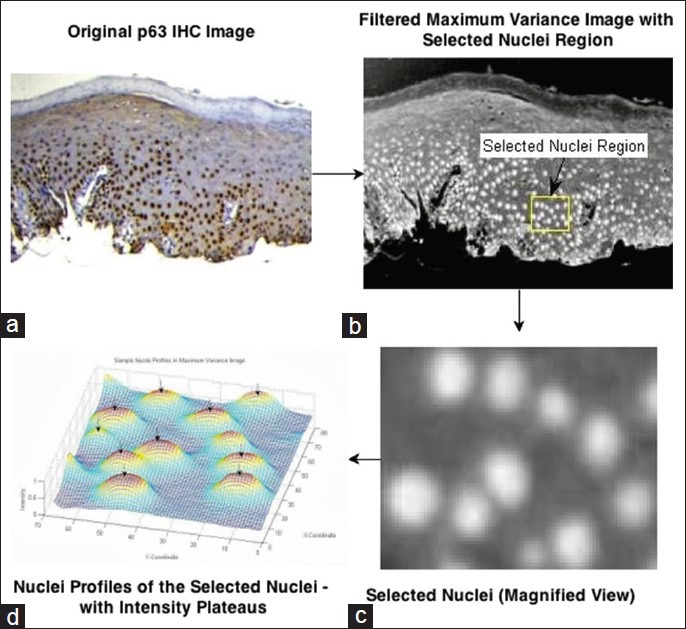
Plateau-like intensity spatial profiles of positive nuclei as observed in a randomly selected nuclei region within the maximum variance preserving image
Epithelial Thickness Measurement in the Region of Interest
The epithelial thickness of the oral mucosa is maintained due to interplay of factors governing the epithelial stratification such as proliferation, differentiation and apoptosis.[18] The epithelial thickness was measured specific to each region of interest and was evaluated as the mean value between the maximum and minimum margin between the basement membrane boundary and the stratum corneum layer measured in the direction of cellular stratification.

Nuclei Localization and Segmentation
In the proposed framework, the nuclei with positive expression of p63 in the IHC image were to be localized and faithfully segmented in the extracted epithelial region of interest. In the filtered maximum variance image, nuclei were often observed as regional maxima with a plateau of high intensity pixels. This was best illustrated by Figure 4a–d where the nuclei sample intensity profile in the highlighted sample region of the original image was shown. Nucleus boundary is defined as the point of maximal color intensity slope and intensity lesser than the full-width half maximum value of the intensity values observed in the nuclei plateau region. For such cases, the nuclei of interest were suitably extracted using the extended maxima transform that finds the regional maxima of the nuclei and searches iteratively for a possible nuclei boundary as per the initialized threshold difference value.[19] Further, the non-nuclear components and partially overlap nuclei were filtered by area closing and hole filling. The segmented image at this stage was presented to the expert user for visual-evaluation of the segmentation performance. If the nuclei were observed to be over segmented/highly cluttered, the extended maxima threshold was increased and for under segmented nuclei it was decreased and the above processes were repeated until visually-optimal nuclei segmentation reached.
Segregation of Aggregating Nuclei and Resolving Overlap
The proposed segmentation framework has to be further augmented with a nuclei segregation schema for resolving marginally overlapping nuclei. This procedure finds an optimal bounding line between touching nuclei at the sides of the touching zones. Such a potential boundary extraction was performed using a two-fold approach comprising of geometric and intensity based segregation procedures. The geometric approach utilized the overlapping nuclei morphometry to determine potential touching points, which were resolved using concavity analysis [Figure 5a–d]. True concave points were determined on the basis of concavity degree and concavity weight defined in Kong et al., 2011. The procedure to obtain the potential points and to determine boundaries was discussed in and its application to the problem was illustrated in Figure 5a–d. This procedure was observed to effectively segregate nuclei with <30% marginal overlap, which preserved the boundary-concavity.
Figure 5.
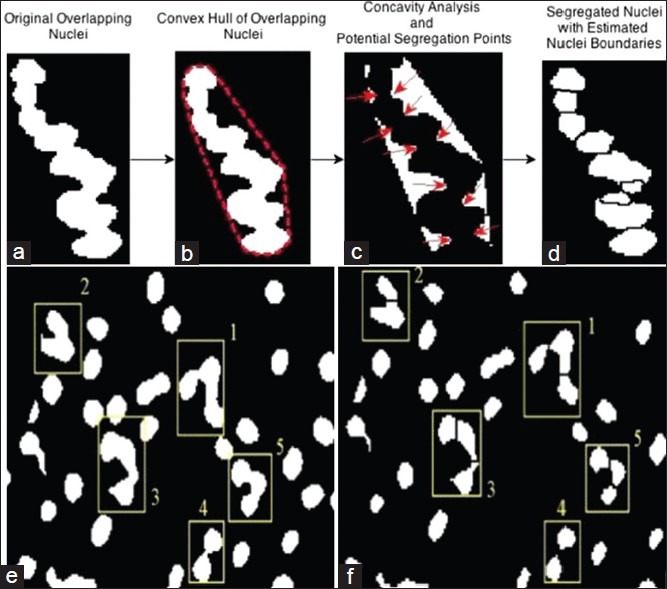
Schema for concavity analysis for geometric overlapping nuclei segregation (a-d) and composite geometric (concavity-analysis) and intensity (marker-controlled watershed) based nuclei segregation shown on randomly selected nuclei clusters (e and f)
For nuclei where the degree of overlap was higher than the threshold for geometric segregation, the above procedure may fail to find plausible boundary points. To resolve overlap in such nuclei, the well-established marker-controlled watershed algorithm was used, which utilized the complement of the intensity information derived from the maximum variance image to find potential watershed segmentation lines between the overlapping nuclei.[20] The final composite nuclei segregation procedure combined the geometric and intensity based segregation procedures and produces a more robust nuclei segmentation performance. Figure 5 illustrated this proposed nuclei segregation procedure in a sample aggregated nuclei randomly selected for the p63 image database. In Figure 5e and f, the cluster 1 where the marginal overlap was high, had been resolved by the intensity based marker-controlled watershed method while the other nuclei clusters 2-5 were segregated using geometric concavity analysis.
Feature Extraction for Quantitative Assessment
For quantitative assessment of pro-malignant attributes inferred from p63+ nuclei in OSF, it is a common practice to extract and evaluate biologically potential features. These features would act as mathematical bio-markers and are aimed at characterizing object-level shape and morphology, the distribution density and spatial arrangement.[14] Such a framework would reduce inter and intra-observer variability associated with assessment of dysplasia, the over and under grading of disease and subjectivity of qualitative image analysis.[11,12] The following sub-sections elicit the associated feature extraction procedures of three kinds of features: Graph theoretic features for spatial arrangement, nuclei morphology features and nuclei density (ND) features.
Graph Theoretic Features for Spatial Arrangement
The evaluation of tissue architecture with respect to the distribution of p63+ nuclei provided reliable insights about the degree of malignant potentiality in the selected region of interest of the epithelium. These features quantitated the spatial arrangement of the p63+ nuclei and assessed the degree of topological closeness and similarity considering the surrounding matrix.[17,19] In the proposed framework, topological graphs (spatial tessellations) were constructed to derive phenotypic signatures of the tissue's pathological state and computed spatial-relation metrics used for dysplasia analysis. The major steps in graph construction and feature extraction were described in the following subsections.
2-D Spatial Tessellation Construction
The constructed topological graph should preserve nuclei architecture information such as clustering of nuclei, connectivity and the inherent complexity of the distribution pattern. For the present application, Voronoi Spatial Tessellation was used due to its established topology preserving structure and the biological potentiality of the associated graph-theoretic features for assessing the spatial arrangement.[13]
The presented framework, considered the region of interest R to be bounded by boundary B. This region of interest consisted of NR pixels and K nuclei. The associated nuclei centroids were C1n, C2n,…Ckn The main stages in graph construction were.
Node Identification
The Voronoi tessellation seed points correspond to nuclei centroids, which act as the nodes for building the graph. The centroids are representative of the nuclei's spatial arrangement and graph-construction around these would preserve the architectural topology and the global connectivity information entailed in the graph.[13] The nuclei centroids were highlighted with yellow plus markers in Figure 6, which depicted the Voronoi graph components and features.
Figure 6.
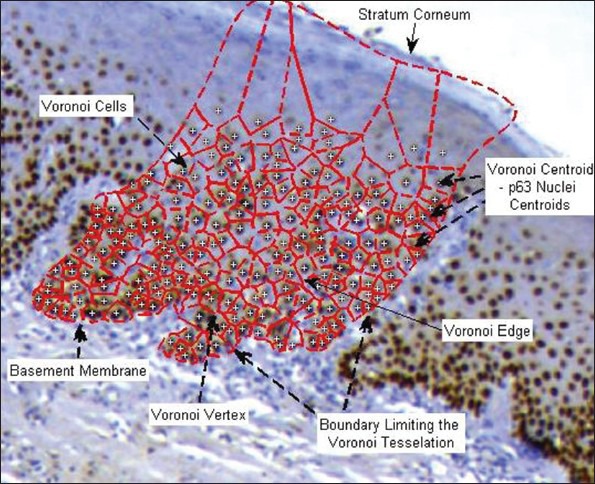
Voronoi spatial tessellation for characterizing p63+ nuclei distribution
Edge Establishment
The field of area limited by the boundary pixels B, is divided into a set of polygons P = {P1, P2, P3 ...PK}, each associated with one p63+ nucleus (graph node). Any pixel c in this boundary limited region R belonged to the Voronoi polygon Pz where

These convex polygons intersected with each other as shown in Figure 6, leading to family of Voronoi Edges associated with each polygon EK.
Tessellation Feature Extraction
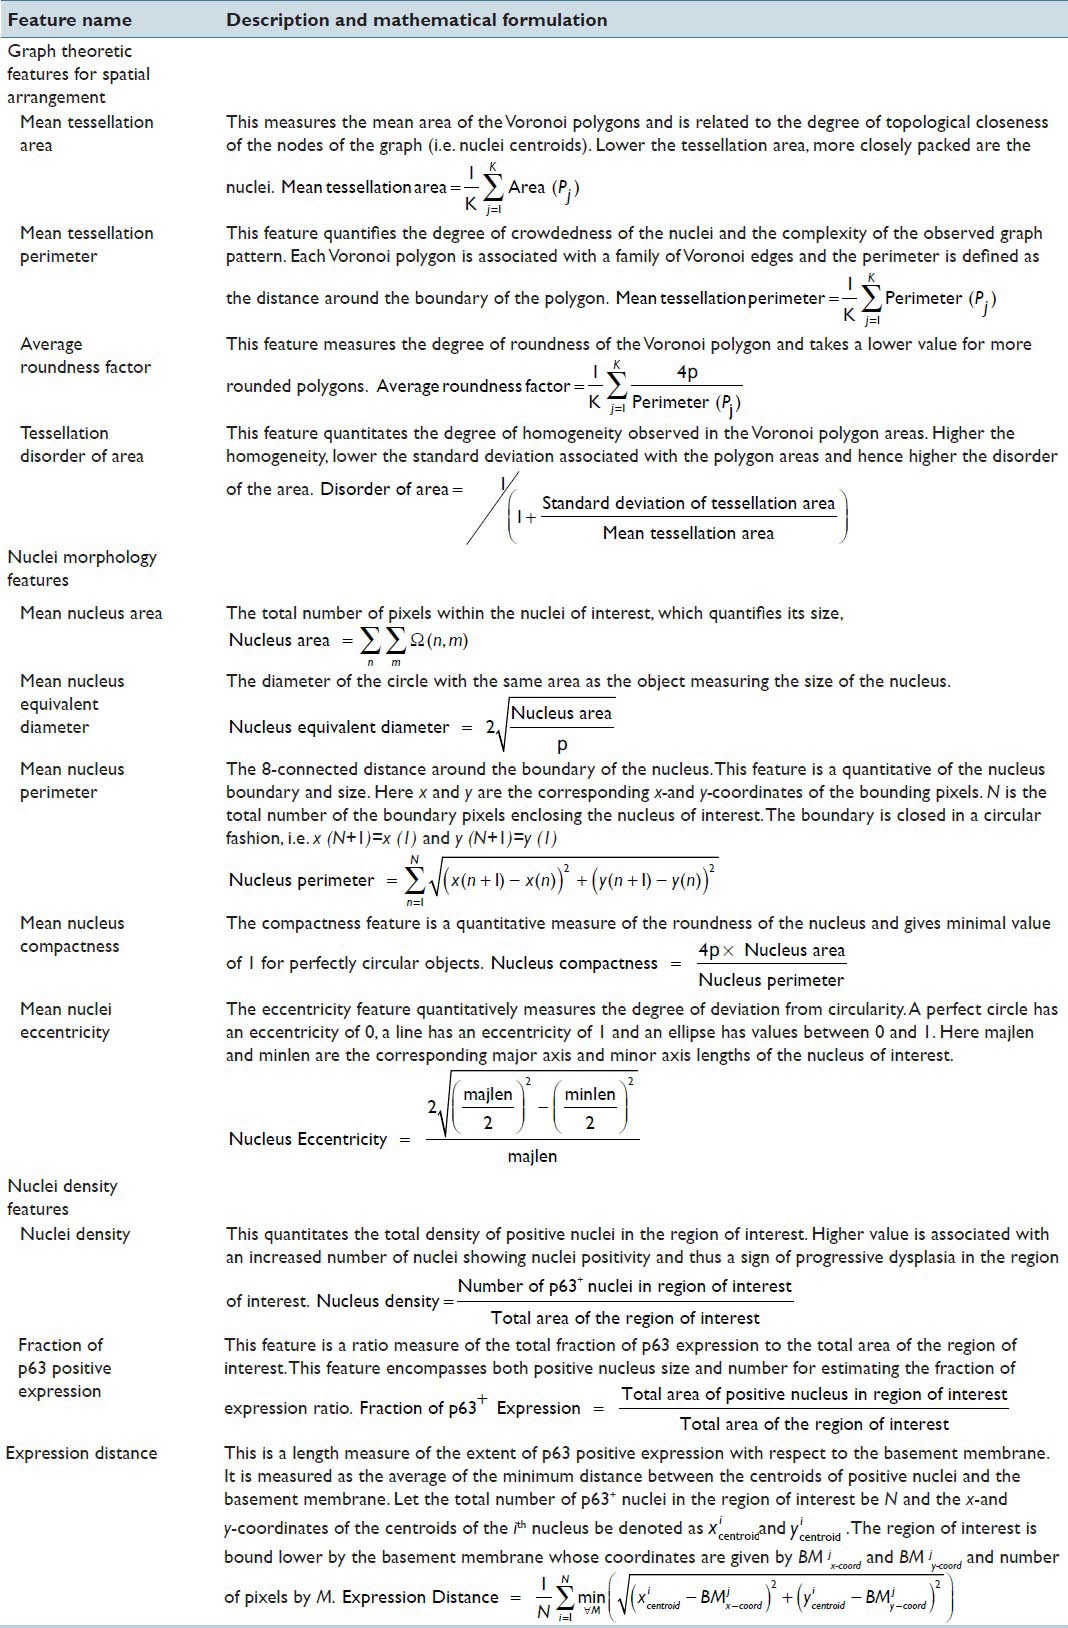
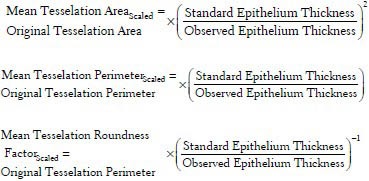
After constructing the Voronoi Tessellation of the nuclei pattern in the region of interest, the following features were extracted to assess the nuclei spatial arrangement.[13] These features included mean tessellation area (MTA), mean tessellation perimeter (MTP), tessellation disorder of area (TDA) and average roundness factor (ARF). The associated descriptions and mathematical formulations were tabulated in Table 1. As metrics quantifying spatial arrangement of nuclei are highly dependent on the epithelial thickness, they have to be rescaled to a standard thickness value for comparative evaluation. The scaled nuclei spatial arrangement features were mathematically derived from original features as shown below:
Table 1.
Description and mathematical formulation of extracted biologically relevant features
Nuclei Morphological Features Extraction
Quantifying the nuclei shape and size features is relevant towards understanding the associated changes in nuclei morphology as OSF progresses. These object-level metrics differ significantly and can effectively act as phenotypic signatures characterizing dysplasia.[14] The following discussion elicited the size and shape metrics extracted for the proposed framework and their mathematical formulations.[13] Let Ω (n, m) represent the binary object mask consisting of 1's within the nuclei of interest and 0's in the background, n and m represent the coordinates of the nuclei in the x-and the y-directions. The total numbers of pixels enclosing the nuclei of interest were represented by N. The features quantifying the morphology of the nucleus included nucleus area, nucleus equivalent diameter, nucleus perimeter, nucleus compactness and nucleus eccentricity. Their descriptions and mathematical formulations are listed in Table 1. These morphological features were extracted for each of the segmented nuclei in the region of interest. The trimmed average (5% trimming on either side) was extracted as a representative measure of the nuclei morphological parameters in the region of interest. The trimmed-average measure was adopted to handle possible outliers contributed by false-positive nuclear structures and unresolved nuclear clusters. It must be noted that the trimming percentage is heuristically chosen as a trade-off between preserving the actual value of the central-tendency measure (mean) of the extracted feature and robustness to outliers.
ND Feature Extraction
Increased nuclei positivity of p63 expression has been established as a reliable biomarker associated with dysplastic changes in the oral mucosa.[8,10] In the normal epithelia, p63 nuclear positivity was focally expressed in the basal and the parabasal layer (lower layers of oral epithelia), while as disease progresses; significantly higher p63+ expression has been reported in the higher epithelial layers.[8] In the proposed work, the features which quantitate this over-expression of p63: p63+ nucleus density; fraction of expression and extent of expression with respect to the basement membrane were extracted. These mathematical features could aid in assessment of the expression density of p63 and thus also aid in the evaluation of the disease. Their descriptions and mathematical formulations are listed in Table 1. It must be noted that as elicited earlier nuclear density is a feature that is dependent on the epithelial thickness and must be standardized to the mean selected epithelial thickness before comparative evaluation. The scaled nuclear density is given by the following expression:

RESULTS
For quantitative assessment of malignant potentiality of a pre-cancerous condition like OSF, oral oncopathology requires a conformal standard and an objective criterion for diagnosing and grading of the associated epithelial dysplasia. During progression toward malignancy, basal atypical cells progressively express at higher epithelial layers and detection of the same through histopathology has been widely accepted in terms of its universality and reproducibility.[18] Figure 7 depicted histopathological gold standard (H&E staining) with corresponding p63 IHC staining for the considered study groups. However, this grading system is subjected to the high degree of intra- and inter-observer variability and motivates development of molecular markers, which have a higher prognostic value over classical histology.
Figure 7.
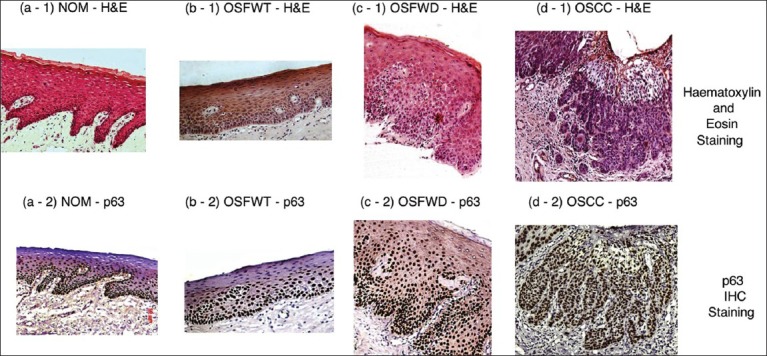
Histopathological gold standard (H&E staining) with corresponding p63 immunohistochemical staining for study groups (a-1, a-2) normal oral mucosa, (b-1, b-2) oral submucous fibrosis without dysplasia, (c-1, c-2) oral submucous fibrosis with dysplasia and (d-1, d-2) oral squamous cell carcinoma. All images are at ×100 magnification
The present study endeavored to establish a logical co-relation between qualitative molecular pathology features observed in IHC expression of epithelial master regulator molecule - p63 and quantitative biologically relevant mathematical features extracted using CIA techniques. These correlative relationships were established in the context of assessing epithelial dysplasia and advancement of the disease toward malignancy. Table 2 tabulates the status of biological correlates associated with disease progression and malignant potentiality and discusses their variations across different study combinations and lists the corroborative mathematical features derived from the image analysis. The relation between the mathematical features and the histopathological correlates is inferred through expert knowledge transfer between highly-experienced oral onco-pathologists and image analysis specialists. The features quantify changes related alterations in spatial arrangement of nuclei, their morphological patterns and associated ND features. It must be noted that histopathological correlates have a direct contributory influence on the alterations of the associated pool of mathematical features as statistically established in the latter part of this paper [Table 3]. This was performed with a notion to improve the prognostic value of the histopathological findings by corroborating crucial molecular pathology attributes (as p63 is a master regulator of oral stratified epithelium) which has a significant impact in indicating alteration/deregulation in the homeostatic control of the oral stratified epithelium. Hence, this study seemed to be impactful in the context of demonstrating prognosis of the disease conditions.
Table 2.
Status of histopathological biological correlates and their variations across different study combinations
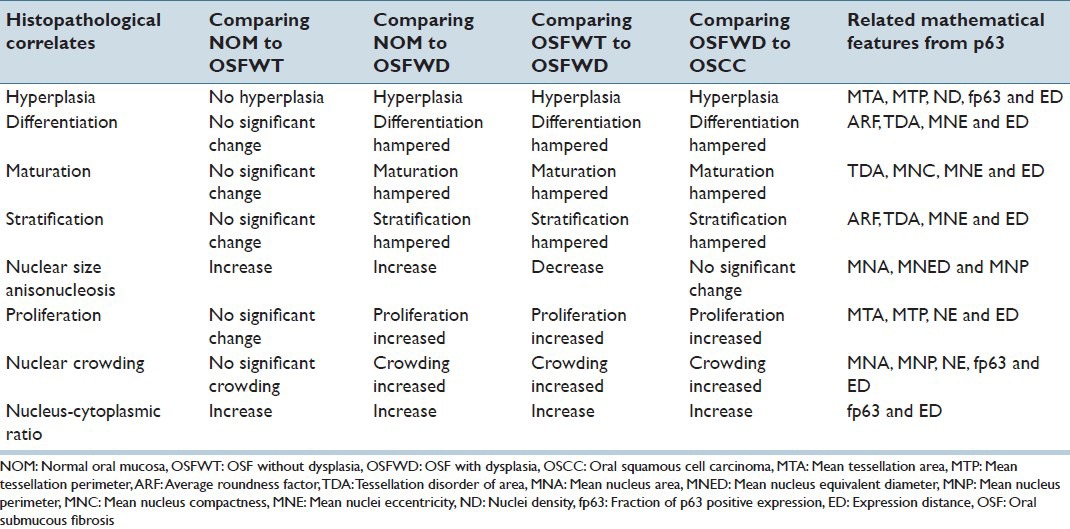
Table 3.
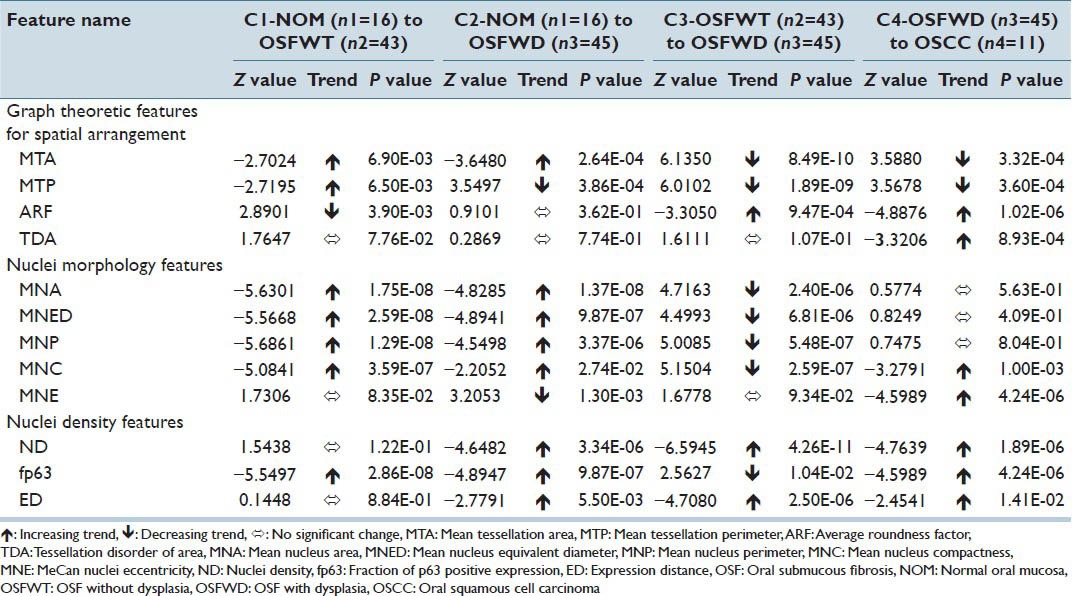
Statistical test for significant different and trend analysis
IHC image analysis for p63+ nuclei images resulted in a pool of 12 biologically (four - Graph Theoretic; five - Nuclear Morphology and three - ND) relevant features quantifying their nuclear morphology, density and spatial arrangement of the expression pattern. The notch-box plots of these biologically relevant features are illustrated in Figures 7 and 8.
Figure 8.
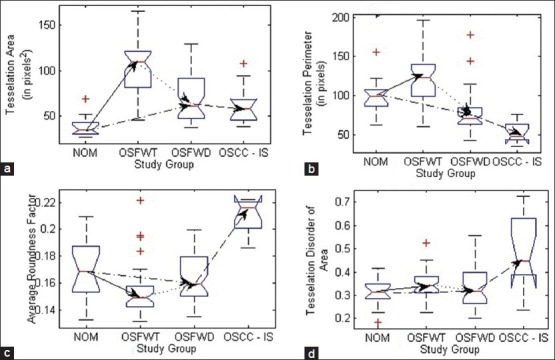
Notch box plots of graph theoretic features for spatial arrangement depicting their trends during different stages of the disease and progression toward malignancy. (a) Mean tessellation area, (b) Mean tessellation perimeter, (c) Average roundness factor and (d) Tessellation disorder of area
The following sections discussed the quantification strategy for assessment of traditional qualitative biological correlates such as hyperplasia, cellular stratification, differentiation and maturation, anisonucleosis, proliferation patterns, status of mitotic figures, nuclear crowding etc., of oral sub mucous fibrosis associated with OSCC.[7] Further, their associations and trends with the corresponding extracted mathematical features were evaluated for different study groups (C1 – NOM to OSFWT; C2-NOM to OSFWD; C3-OSFWT to OSFWD and C4-OSFWD to OSCC-IS). Table 3 and Figures 8 and 9 depicted the status and trends of the biologically relevant mathematical attributes the disease toward cancer as well as draws representative diagnostic inferences on their corresponding biological correlates. For the purpose of identifying significant trends of the mathematical feature from one study group to another, we have proposed to use the non-parametric Mann-Whitney U-test, which test the null hypothesis that both populations are same against the alternate hypothesis that a particular population has higher/lower values than the other. For statistically measuring the class separability values of features extracted from the two study groups, the z-statistic equivalent derived from the Mann-Whitney U-statistic has been proposed. Higher this class separability measure, higher the associated statistical significance in separating the two study groups.
Figure 9.
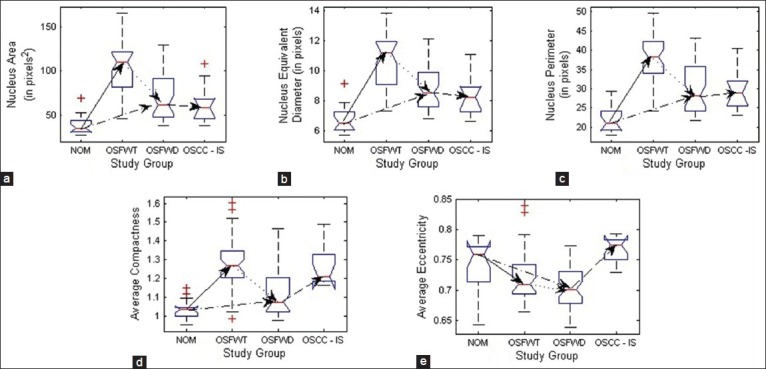
Notch box plots of nuclei morphology features depicting their trends during stages of the disease and progression toward malignancy. (a) Mean nucleus area, (b) Mean nucleus equivalent diameter, (c) Mean nucleus perimeter, (d) Mean nuclear compactness and (e) Mean nuclear eccentricity
DISCUSSION
Graph-theoretic features characterizing spatial arrangement of p63+ nuclei with specific histopathological association would help to recognize the importance of these attributes related to the epithelial architectural and molecular alteration in different stages of this pre-cancer and its transformation into malignancy. Furthermore, the prevailing uncertainty in respect to the utility of this molecular marker (p63) for predicting malignant potentiality in dysplastic and non-dysplastic OSF could be better judged by the proposed quantitative approach and the measurements explored.[8] Therefore, the mathematical features having biological correlates became effective in indicating oral epithelial alterations due to cell crowding, cell proliferation and impairment in cellular maturation processes in the different stages of the disease. Comparative interpretations between biological processes and graph spatial models have established equivalency between biological architecture and the graph geometry. The biological mitosis has been related to new node addition, cell-cell adhesion to edge/links, cell volume to the graph cell surface area and cell surface area to graph cell perimeter.[18,21]
A stratified architecture in a normal oral epithelium has characteristic signatures, which due to atypical manifestations under disease pathogenesis get altered. Thus extracting mathematical features indicative of these alterations would lead to a quantitative framework for analysis devoid of methodological bias and subjectivity in histopathological cum molecular pathology assessment.
A pool of graph theoretic features was considered in the present work which included MTA, MTP, ARF and TDA. Inferring from Table 3, the feature MTA was indicative of average area of influence of each p63+ nucleus which increased from NOM to OSFWT, but decreased as the disease was in dysplastic condition (OSFWD). This decreasing trend continued towards malignancy (OSCC). A similar trend was observed in case of MTP differing only in case of NOM to OSFWD transition. This trend could be suggestive of an increase in inter-cellular crowding and dense packing in upper epithelial layers with characteristic basaloid appearance as the disease progresses. Further, the feature ARF assessed the roundness of the Voronoi cell area surrounding a particular p63+ nucleus which observed to be increased from NOM to OSFWT but decreased through OSFWT to OSFWD to OSCC. It indicated that Voronoi cells became more rounded in shape as the disease progresses and thus attains a higher degree of homogeneity in their distribution. Whereas, TDA feature was indicative (inversely related) of variability of the Voronoi cell areas due to the stratification process in the oral epithelium. However, the loss of stratification in the disease resulted in a significant increase in TDA and this trend in OSFWD to OSCC was indicative of the disease progression.
To derive a more comprehensive picture of molecular pathology involving the variation of p63 expression for understanding the OSF conditions and degree of progression to malignancy, analysis of nuclear morphology and density of expression was also performed in the present work. The changes in p63+ nuclear morphology were characterized by features related to: (i) Size such as mean nucleus area (MNA), mean nucleus equivalent diameter (MNED) and mean nucleus perimeter (MNP) and (ii) shape like mean nucleus compactness (MNC) and mean nuclei eccentricity (MNE). As inferred from Table 3, MNA, MNED and MNP followed consistent trends of increment from NOM to OSFWT and then declined from OSFWT to OSFWD. They exhibited no significant changes on transformation into OSCC. This trend was suggestive that each stage of the disease often manifested a unique signature with respect to attributes of nuclear size due to a complex interplay of factors regulating cellular proliferation, abnormal mitosis and disrupted cellular maturation and differentiation.[22] Manifestations in nuclear shape indicated by MNC and MNE again suggested increase in degree of nuclear atypism and deviations in different OSF conditions from the normal counterpart. Density of p63+ positive nuclei and the extent of expression were characterized by the mathematical attributes including ND, fraction of p63 positive expression (fp63) and expression distance (ED). As indicated in Table 3, increase in ND with advancing stages of the disease indicated enhanced nuclei positivity to p63 and thus implied the upregulation of this master regulator with disease progression, which was in agreement with the previous qualitative observation of Das et al.[8] and possibly indicated increased nuclear proliferation in this pathogenesis. As mentioned in Table 3, the extent of p63+ nuclear expression increased consistently with disease progression.[23]
In the context of OSF progression towards OSCC, there was increased number of atypical nuclei in the epithelium. This biological condition was quantitated using a pool of mathematical features including MTA, MTP, ND, fp63 and ED. Inferring from Figures 7 and 8 and Table 4, decreasing trend of MTA and MTP (increasing cellular crowding; decreasing inter-nuclei distance – dense packing) with increasing ND (increased nuclear density), fp63 (increased NC ratio) and ED (increasing extent of expression) indicated hyperplasia in C2, C3 and C4 study groups and absence of such significant conformal trends of these features indicates no significant hyperplastic changes in C1.
Table 4.
Qualitative inference of biological correlates in OSF and OSCC with corroborative mathematical features
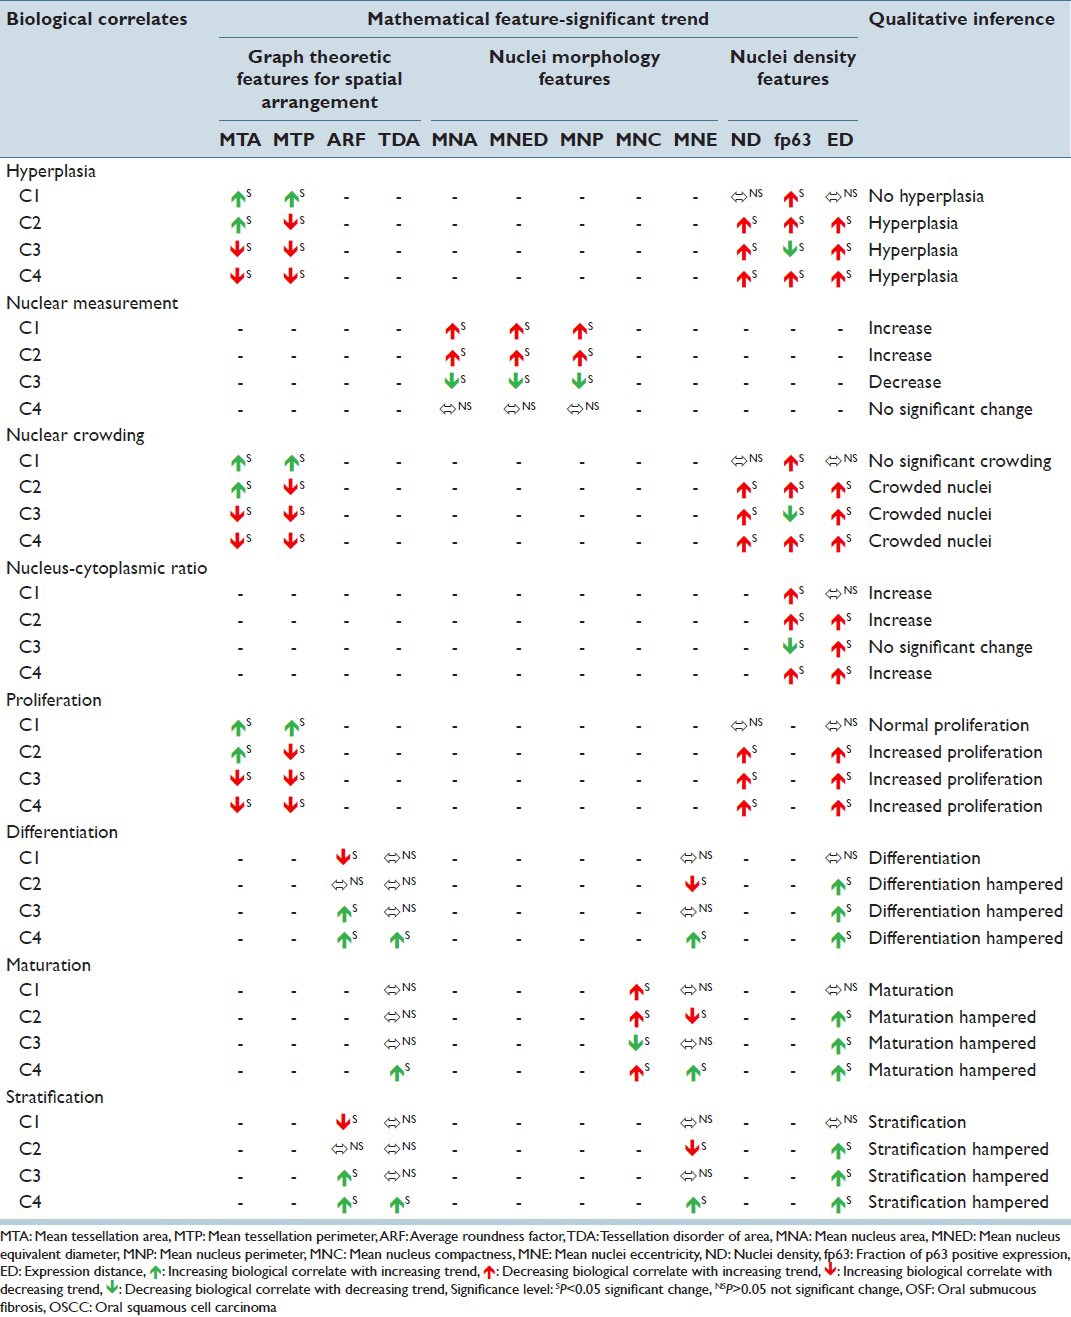
The nuclear morphology as well as expression and distribution pattern based signatures of p63+ nuclei are crucial in the context of maintenance of cellular homeostasis embedded with cellular proliferation, differentiation, stratification, maturation in normal, onset and progression of the pre-cancer. The biological attributes include nuclear morphology features viz. nuclear size, nuclear shape, nuclear population density and nucleus-cytoplasm ratio. Nuclear measurements were assessed by a group of quantitative features including MNA, MNED and MNP. In study combinations C1 and C2, increasing trends of these factors suggest increasing nuclear size and thus shows emerging patterns of nuclear atypism. This pattern reverses in case of C3, but no significant change occurs in C4. Nuclear crowding is quantified using features including MTA, MTP, ND, fp63 and ED. In study combinations of C2, C3 and C4, decreased MTA and MTP (decreasing inter-nuclei distance – dense packing), increasing ND (increasing number density of positive nuclei), fp63 (increased p63 positivity) and ED (increasing extent of positive expression) are strongly indicative of higher nuclear population density. Nucleo-cytoplasmic ratio is established to increase as the disease advances[7] and our observations are consistent and are quantified by mathematical features including fp63 and ED. Increasing trend of fp63 (increased p63 positivity) and ED (increasing extent of positive expression) in C1, C2, C3 and C4 suggests higher nucleo-cytoplasmic ratio in the context of the disease progression toward malignancy.
Advancement of disease is accompanied by enhanced cellular proliferation, which is mathematically characterized by MTA, MTP, ND and ED. As depicted in Figures 8–10 and tabulated in Table 4, the increased proliferative ability is indicated by decreasing pattern of MTA and MTP (increasing cellular crowding; decreasing inter-nuclei distance – dense packing) and increasing ND (increased positive ND) and ED (increasing extent of expression). From these patterns, it is inferred that C1 has no significant change in proliferative ability, which is highly enhanced in C2, C3 and C4. This change leads to progressive disruption of epithelial cellular maturation process as established further. During the onset and advancement of the disease toward cancer, epithelial differentiation, stratification and maturation are gradually disrupted leading to loss of epithelial homeostasis.[24] The altered state of these correlates manifests as changes in the nuclear morphology and the extent of presence of these atypical nuclei in the upper epithelial layers. It was in agreement with the related histopathological findings of other studies.[23]
Figure 10.

Notch box plots of nuclei density features depicting their trends during different stages of the disease and progression toward malignancy. (a) Nuclear density (b) Fraction of expression and (c) Expression distance
Epithelial differentiation and stratification is characterized by ARF, TDA, MNE and ED; and Maturation is quantified by TDA, MNC, MNE and ED. From Table 4 and Figures 8–10, it is observed that the increasing trend of ARF (increasing roundness), TDA (increased homogeneity in spatial arrangement), MNE (increased nuclear atypism) and ED (increasing extent of expression) is indicative of hampered epithelial differentiation and stratification process in C3 and C4. Cellular maturation process is also subsequently disturbed as indicated by the increasing trend of TDA (increased homogeneity in spatial arrangement), MNE (increased nuclear atypism) and ED (increasing extent of expression) and decreasing pattern of MNC (increased nuclear atypism).
A robust nuclei segmentation and localization method using regional maxima in plateau-like intensity spatial profiles of nuclei coupled with a hybrid intensity and geometric cluster segregation algorithm has been investigated into. The progression of oral sub-mucous fibrosis and its transformation into carcinoma is characterized by a subset of biologically relevant mathematical features derived by using a Voronoi spatial tessellation based graph theoretic approach. Further, a correlative analysis of various study combinations identified possible inter-relationships between the extracted mathematical features and their biological correlates. In summary, a quantitative logical framework has been proposed for assessment of the IHC expression of p63 (epithelial prime regulator molecule) for value addition to the evaluation of malignant potentiality of oral sub-mucous fibrosis. This would augment the establishment of p63 as a reliable bio-marker because of its characteristic quantitative signatures, which change distinctly as the disease progresses. Further it is conceived that investigating OSF and OSCC using this framework would reduce inter and intra-observer variability and thus may prevent the over and under grading of disease stages. Hence, proposed work could be a value addition to the gold standard histopathological practices by logically incorporating a robust molecular pathology attributes toward achieving improved diagnostic specificity regarding progression of the pre-cancer (oral sub-mucous fibrosis).
Footnotes
Available FREE in open access from: http://www.jpathinformatics.org/text.asp?2013/4/1/35/124006
REFERENCES
- 1.Jemal A, Bray F, Center MM, Ferlay J, Ward E, Forman D. Global cancer statistics. CA Cancer J Clin. 2011;61:69–90. doi: 10.3322/caac.20107. [DOI] [PubMed] [Google Scholar]
- 2.Coelho KR. Challenges of the oral cancer burden in India. J Cancer Epidemiol 2012. 2012 doi: 10.1155/2012/701932. 701932. [DOI] [PMC free article] [PubMed] [Google Scholar]
- 3.Nair DR, Pruthy R, Pawar U, Chaturvedi P. Oral cancer: Premalignant conditions and screening – An update. J Cancer Res Ther. 2012;8(Suppl 1):S57–66. doi: 10.4103/0973-1482.92217. [DOI] [PubMed] [Google Scholar]
- 4.Murti PR, Bhonsle RB, Pindborg JJ, Daftary DK, Gupta PC, Mehta FS. Malignant transformation rate in oral submucous fibrosis over a 17-year period. Community Dent Oral Epidemiol. 1985;13:340–1. doi: 10.1111/j.1600-0528.1985.tb00468.x. [DOI] [PubMed] [Google Scholar]
- 5.Cox SC, Walker DM. Oral submucous fibrosis. A review. Aust Dent J. 1996;41:294–9. doi: 10.1111/j.1834-7819.1996.tb03136.x. [DOI] [PubMed] [Google Scholar]
- 6.Warnakulasuriya S, Reibel J, Bouquot J, Dabelsteen E. Oral epithelial dysplasia classification systems: Predictive value, utility, weaknesses and scope for improvement. J Oral Pathol Med. 2008;37:127–33. doi: 10.1111/j.1600-0714.2007.00584.x. [DOI] [PubMed] [Google Scholar]
- 7.Bouquot JE, Speight PM, Farthing PM. Epithelial dysplasia of oral mucosa-diagnostic problems and prognostic features. Curr Diagn Pathol. 2006;12:11–2. [Google Scholar]
- 8.Das RK, Pal M, Barui A, Paul RR, Chakraborty C, Ray AK, et al. Assessment of malignant potential of oral submucous fibrosis through evaluation of p63, E-cadherin and CD105 expression. J Clin Pathol. 2010;63:894–9. doi: 10.1136/jcp.2010.078964. [DOI] [PubMed] [Google Scholar]
- 9.Celardo I, Grespi F, Antonov A, Bernassola F, Garabadgiu AV, Melino G, et al. Caspase-1 is a novel target of p63 in tumor suppression. Cell Death Dis. 2013;4:e645. doi: 10.1038/cddis.2013.175. [DOI] [PMC free article] [PubMed] [Google Scholar]
- 10.Yaziji H, Barry T. Diagnostic immunohistochemistry: What can go wrong? Adv Anat Pathol. 2006;13:238–46. doi: 10.1097/01.pap.0000213041.39070.2f. [DOI] [PubMed] [Google Scholar]
- 11.Walker RA. Quantification of immunohistochemistry-issues concerning methods, utility and semi quantitative assessment I. Histopathology. 2006;49:406–10. doi: 10.1111/j.1365-2559.2006.02514.x. [DOI] [PubMed] [Google Scholar]
- 12.Walker RA. Quantification of immunochemistry-issues concerning methods, utility and semi quantitative assessment-II. Histopathology. 2006;49:411–24. doi: 10.1111/j.1365-2559.2006.02514.x. [DOI] [PubMed] [Google Scholar]
- 13.Gurcan MN, Boucheron LE, Can A, Madabhushi A, Rajpoot NM, Yener B. Histopathological image analysis: A review. IEEE Rev Biomed Eng. 2009;2:147–71. doi: 10.1109/RBME.2009.2034865. [DOI] [PMC free article] [PubMed] [Google Scholar]
- 14.Landini G, Othman IE. Architectural analysis of oral cancer, dysplastic, and normal epithelia. Cytometry A. 2004;61:45–55. doi: 10.1002/cyto.a.20082. [DOI] [PubMed] [Google Scholar]
- 15.Gonzalez RC. Ch. 6. NJ, USA: Pearson Education; 2009. Digital Image Processing. [Google Scholar]
- 16.Tomasi C, Manduchi R. IEEE Int Conf Comput Vis. It is a IEEE International conference proceedings (02/1/1998; DOI 10.1109/ICCV.1998.710815 ISBN: 81-7319-221-9 In proceeding of: Computer Vision, 1998); 1998. Bilateral figuring for gray and color images; pp. 839–46. [Google Scholar]
- 17.Permuter H, Francos J, Jismyn I. A study of Gaussian mixture models of color and texture features for image classification and segmentation. Pattern Recognit. 2006;39:695–706. [Google Scholar]
- 18.Gunduz C, Yener B, Gultekin SH. The cell graphs of cancer. Bioinformatics. 2004;20(Suppl 1):i145–51. doi: 10.1093/bioinformatics/bth933. [DOI] [PubMed] [Google Scholar]
- 19.Soille P. NY, USA: Springer-Verlag; 1999. Morphological Image Analysis: Principles and Applications; pp. 170–1. [Google Scholar]
- 20.Kong H, Gurcan M, Belkacem-Boussaid K. IEEE Symp Biomed Imaging. Chicago, Illinois: It is a conference proceeding IEEE ISBI 2011, 30 March-2 April 2011; 2011. Splitting touching cell-clusters on histopathological images; pp. 08–11. [Google Scholar]
- 21.Bange L, Baskaran A, Yuan D, Oztan B, Yener B, et al. IEEE Int ConfBioinform Biomed. Vol. 1. The referenfce has been cited into the text part (page number 25, line number 523-525); 2012. A novel dynamic graph-based computational model for predicting salivary gland branching morphogenesis. IEEE Int Conf Bioinform Biomed 2012;1-8; pp. 1–8. [Google Scholar]
- 22.Mommers EC, Poulin N, Sangulin J, Meijer CJ, Baak JP, van Diest PJ. Nuclear cytometric changes in breast carcinogenesis. J Pathol. 2001;193:33–9. doi: 10.1002/1096-9896(2000)9999:9999<::AID-PATH744>3.0.CO;2-Q. [DOI] [PubMed] [Google Scholar]
- 23.Rajendran R, Sivapathasundharam B. 7th ed. India: Elsevier; 2012. Shafer's Textbook on Oral Pathology. [Google Scholar]
- 24.Schneider MR, Dahlhoff M, Horst D, Hirschi B, Trülzsch K, Müller-Höcker J, et al. A key role for E-cadherin in intestinal homeostasis and paneth cell maturation. PLoS One. 2010;5:e14325. doi: 10.1371/journal.pone.0014325. [DOI] [PMC free article] [PubMed] [Google Scholar]


