Summary
Background
The purpose of this study was to diagnose the hypoxic impairment by Magnetic resonance spectroscopy (MRS), an advanced MR imaging technique, which could not be visualised by routine imaging methods in patients with obstructive sleep apnea (OSA).
Material/Methods
20 OSA patients and 5 controls were included in this prospective research. MRS was performed on these 25 subjects to examine cerebral hypoxemia in specific regions (periventricular white matter and both hippocampi). Polysomnography was assumed as the gold standard. Statistical analysis was assessed by Mann-Whitney U test and Receiver operating characteristics (ROC) curve for NAA/Cho, NAA/Cr and Cho/Cr ratios.
Results
In the periventricular white matter, NAA/Cho ratio in OSA patients was significantly lower than in the control group (p<0.05). There were no statistical differences between the OSA and the control group for NAA/Cho, NAA/Cr and Cho/Cr ratios for both hippocampal regions. Additionally, Cho/Cr ratio in the periventricular white matter region of OSA group was higher than in the control group (p<0.05).
Conclusions
Hypoxic impairment induced by repeated episodes of apnea leads to significant neuronal damage in OSA patients. MRS provides valuable information in the assessment of hypoxic ischemic impairment by revealing important metabolite ratios for the specific areas of the brain.
Keywords: magnetic resonance spectroscopy, sleep apnea syndromes, magnetic resonance, sleep disorders, polysomnography
Background
Obstructive sleep apnea (OSA) affects 2% of women and 4% of men in the general population and up to 25% of the elderly with respect to large epidemiologic studies [1,2]. This syndrome is characterized by chronically fragmented sleep and intermittent hypoxia caused by repetitive episodes of upper airway obstruction [3,4].
Cognitive impairment has been reported in OSA patients in previous studies [5]. General intellectual functioning, attention, memory and particular executive functions, such as problem solving, planning of goal-oriented behaviour and mental flexibility, are the most frequently affected skills [6,7].
H-MRS (Proton MR Spectroscopy) is an advanced MRI technique that provides non-invasive in vivo assessment of brain metabolism by determining important metabolites of the central nervous system. H-MRS has been applied in many brain disorders, such as brain tumors, Alzheimer’s disease, multiple sclerosis, epilepsy, mitochondrial disorders and leukodystrophies [8–10].
In this study, we performed 2D-H-MRS on OSA patients to assess hypoxic and metabolic impairment of periventricular white matter and both hippocampi.
Material and Methods
Research was approved by the institutional review board, a written informed consent was provided by all the patients prior to imaging. Between March 2010 and December 2010; 25 patients (17 males and 8 females) suspected of having OSA, were included in this prospective study. Their age ranged between 23 and 68 years with mean age of 46.88. In order to eliminate other ischemic conditions or any predisposing factors for ischemia, such as diabetes, cardiac insufficiency, high blood pressure or history of stroke, only those patients who did not suffer from these ischemic factors were referred to our unit from the department of chest diseases after undergoing polysomnography (PSG) testing. The observer was unaware of polysomnography results and cranial MRI was performed on all of the patients. Thirty-four patients who had ischemic lesions (33 patients with lacunar infarcts and 1 patient with encephalomalacia) on MR images, were excluded from the study. H-MRS was performed on the remaining group. In the study group, 2 patients had (asymptomatic) Chiari 1 malformation with borderline tonsillar herniation, 1 patient had rheumatoid arthritis while the remaining patients had no specific disease. Following the evaluation of H-MRS ratios, patients were classified as “patient group” or “control group” based on polysomnography results, using apnea-hypopnea index (AHI), which was the current standard of reference in the assessment of OSA [11,12].
According to the guidelines, patients were classified as having OSA if the AHI was ≥5. Twenty patients were classified as “OSA” and “patient” group, 5 patients were classified as “normal” with respect to this criteria [13[.
H-MRS was applied to periventricular white matter, right hippocampus and left hippocampal region. White matter adjacent to the right lateral ventricle and both hippocampal heads were studied. NAA (N-Asetyl Aspartate)/Cho (Choline), NAA/Cr (Creatine), Cho/Cr ratios were evaluated for all 3 regions.
H-MRS acquisitions were performed under an 8 channel Philips Achieva Medical Systems-Netherlands 1.5T magnet with standard head coil used. For HMRS, 2D- spin echo PRESS (point resolved spectroscopy) sequence was applied.
Voxel size was 1×1×0.5 cm. Time domain data were multiplied with Gaussian function of 90 (Center 0, halfwidth 256 ms), 2D Fourier transformed phase and baseline corrected, quantified by means of frequency domain curve fitting with the assumption of a Gaussian line shape by using the Philips software. Automatic shimming of the linear x, y, z channels was used to optimize field homogeneity. Water resonance and water suppression pulse were optimized. Proton spectra were recorded in axial and coronal planes with T2 weighted images via TR; 1500 ms, TE;144 ms, FOV; 24×24 cm, 1–1.5 cm section thickness, 256×256 matrix and 24×24 phase encoding. Spectral analysis and last processing were carried out using Philips 8 channel Achieva Netherland work-shop software.
All statistical analyses were performed using a software program (SPSS for Windows, SPSS 15.0, Chicago-Illinois). Statistical correlations were assessed by Mann-Whitney U-test. P<0.05 was considered to indicate a statistically significant difference. Receiver operating characteristics (ROC) curve was also fitted to obtain cut-off values for NAA/Cho, NAA/Cr and Cho/Cr ratios by using area under the curve (AUC).
Results
All patient data, including age, gender, AHI and NAA/Cho, NAA/Cr, Cho/Cr ratios is shown in Table 1 for OSA group and Table 2 for the control group.
Table 1.
The datas of OSA patients.
| Number | Name | Age | Gender | MRS Findings | AHI | ||||||||
|---|---|---|---|---|---|---|---|---|---|---|---|---|---|
| NAA/Cho | NAA/Cr | Cho/Cr | |||||||||||
| PWM | RH | LH | PWM | RH | LH | PWM | RH | LH | |||||
| 1 | F.Y. | 23 | M | 2.08 | 2.08 | 1.81 | 2.98 | 1.27 | 2.18 | 1.43 | 0.61 | 2.17 | 7.8 |
| 2 | A.Ü.S. | 42 | M | 1.07 | 2.04 | 2.18 | 2.21 | 1.76 | 1.86 | 2.05 | 0.86 | 0.85 | 78.4 |
| 3 | B.Y. | 51 | M | 2.77 | 0.55 | 1.56 | 0.94 | 1.18 | 0.69 | 0.34 | 2.14 | 0.44 | 11.5 |
| 4 | A.K. | 59 | F | 1.11 | 5.00 | 1.02 | 2.15 | 1.30 | 3.17 | 1.93 | 0.26 | 3.10 | 35.8 |
| 5 | H.K. | 62 | M | 2.13 | 2.58 | 2.14 | 1.88 | 2.34 | 1.79 | 0.88 | 0.91 | 0.84 | 72.3 |
| 6 | H.Ü. | 42 | M | 2.10 | 2.21 | 2.36 | 1.53 | 2.54 | 1.71 | 0.73 | 1.04 | 0.72 | 41 |
| 7 | L.Y.B. | 38 | M | 2.77 | 0.87 | 1.87 | 1.74 | 4.60 | 2.22 | 0.63 | 5.28 | 1.19 | 5.4 |
| 8 | O.K. | 31 | M | 1.78 | 2.50 | 1.64 | 1.60 | 3.66 | 1.39 | 0.94 | 1.48 | 0.84 | 35.6 |
| 9 | R.P. | 48 | M | 1.23 | 1.98 | 2.06 | 1.08 | 1.52 | 2.31 | 0.88 | 0.77 | 1.12 | 19.4 |
| 10 | S.Z. | 47 | M | 2.17 | 1.47 | 1.66 | 1.21 | 1.54 | 2.00 | 0.55 | 1.06 | 1.20 | 36.5 |
| 11 | Ş.Ç. | 33 | M | 2.63 | 1.58 | 1.88 | 1.51 | 1.62 | 1.81 | 0.58 | 1.02 | 0.96 | 49.4 |
| 12 | S.K. | 49 | F | 2.36 | 2.18 | 2.35 | 2.53 | 2.20 | 2.44 | 1.07 | 1.01 | 1.04 | 9.6 |
| 13 | Z.T. | 60 | M | 0.99 | 1.10 | 1.67 | 1.78 | 3.06 | 1.85 | 1.80 | 2.80 | 1.11 | 11.5 |
| 14 | A.G. | 57 | M | 2.19 | 2.35 | 2.07 | 2.46 | 2.28 | 2.20 | 1.12 | 0.97 | 1.06 | 24.8 |
| 15 | B.Y. | 43 | M | 1.49 | 0.96 | 1.57 | 1.90 | 0.37 | 1.44 | 1.28 | 0.39 | 0.92 | 19.8 |
| 16 | A.Y. | 49 | F | 1.49 | 1.10 | 0.34 | 1.97 | 0.65 | 0.28 | 1.33 | 0.58 | 0.86 | 10.2 |
| 17 | M.Ç. | 68 | M | 2.22 | 4.76 | 1.85 | 1.54 | 1.61 | 2.62 | 0.70 | 0.34 | 1.41 | 6.8 |
| 18 | N.D. | 42 | F | 1.21 | 2.94 | 2.92 | 1.32 | 1.17 | 1.87 | 1.09 | 0.40 | 0.64 | 47.3 |
| 19 | Z.B. | 63 | M | 1.81 | 4.54 | 2.84 | 1.58 | 2.51 | 2.04 | 0.87 | 0.55 | 0.71 | 31.7 |
| 20 | S.K. | 46 | F | 1.33 | 2.17 | 1.33 | 1.47 | 4.80 | 1.90 | 1.10 | 2.21 | 1.43 | 30.2 |
Table 2.
The datas of control group.
| Number | Name | Age | Gender | MRS Findings | AHI | ||||||||
|---|---|---|---|---|---|---|---|---|---|---|---|---|---|
| NAA/Cho | NAA/Cr | Cho/Cr | |||||||||||
| PWM | RH | LH | PWM | RH | LH | PWM | RH | LH | |||||
| 1 | A.Y. | 46 | M | 2.27 | 2.86 | 2.94 | 1.38 | 2.60 | 2.33 | 0.61 | 0.91 | 0.80 | 4.9 |
| 2 | M.C. | 41 | F | 2.68 | 2.87 | 2.31 | 1.86 | 2.31 | 2.12 | 0.72 | 0.81 | 0.92 | 4 |
| 3 | Ş.B. | 42 | F | 2.63 | 1.35 | 1.83 | 0.99 | 3.42 | 1.71 | 0.38 | 2.53 | 0.93 | 2.7 |
| 4 | Z.B. | 47 | F | 1.89 | 2.04 | 2.52 | 1.52 | 1.71 | 2.47 | 0.80 | 0.84 | 0.98 | 3.7 |
| 5 | K.A. | 43 | M | 3.44 | 2.74 | 1.03 | 1.87 | 2.34 | 2.98 | 0.54 | 0.85 | 2.90 | 4.7 |
The average NAA, Cho and Cr levels in the periventricular white matter were respectively 2.421±0.873, 1.438+0.644, 1.354±0.253 in the patient group and 2.014±0.635, 0.806±0.273, 1.312±0.207 in the control group. The average NAA, Cho and Cr levels in the right hippocampus were respectively 1.665±0.767, 0.933±0.774, 0.821±0.131 in the patient group and 2.196±0.274, 1.036±0.529, 0.914±0.140 in the controls. NAA, Cho and Cr levels in left hippocampus were respectively 1.475±0.449, 0.857±0.366, 0.786±0.124 in the patient group and 2.532±0.496, 2.322±0.466, 0.932±0.085 in the control group.
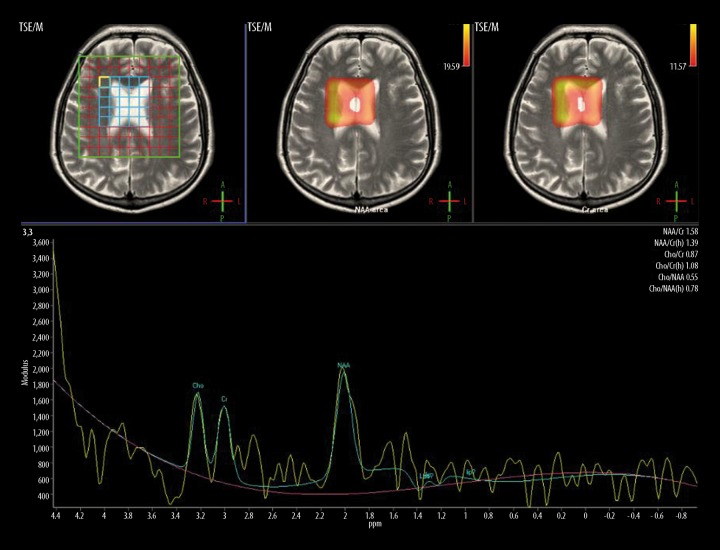
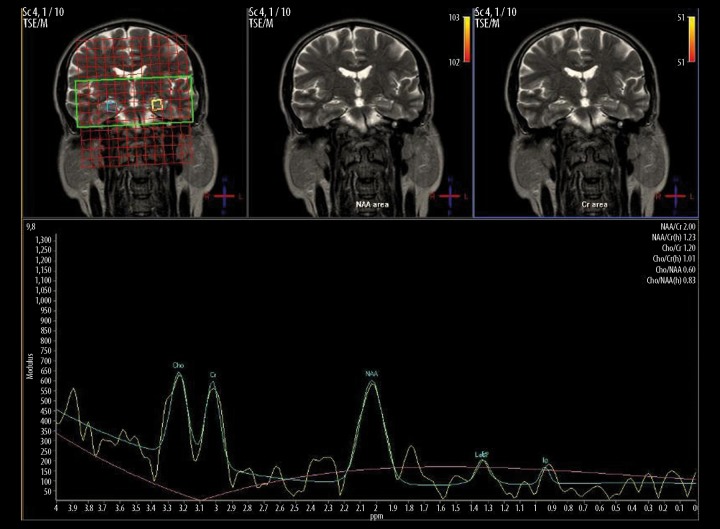
Table 3 shows the mean values for NAA/Cho ratio in the periventricular white matter (PWM), right hippocampus (RH) and left hippocampus (LH) of OSA patients, with comparison to the control group. There was a statistically significant difference between the OSA and the control group for NAA/Cho ratio in PWM region, the mean NAA/Cho ratio was lower than in the control group (p=0.032) (Figure 1).
Table 3.
NAA/Cho ratio (mean values) in PWM, RH, LH regions of OSA patients in comparison with the control group.
| Region | Group | N | Mean | Std. deviation | P value |
|---|---|---|---|---|---|
| PWM | Control | 5 | 2.58 | 0.58 | 0.032* |
| OSA | 20 | 1.85 | 0.58 | ||
| RH | Control | 5 | 2.37 | 0.67 | 0.434 |
| OSA | 20 | 2.25 | 1.26 | ||
| LH | Control | 5 | 2.13 | 0.73 | 0.308 |
| OSA | 20 | 1.86 | 0.58 |
p<0.05.
Figure 1.
H-MRS of periventricular white matter (AHI=31.7) in a 63-year-old, male OSA patient. NAA peak is decreased and NAA/Cho ratio is 1.81 (mean value of control group was 2.58±0.58).
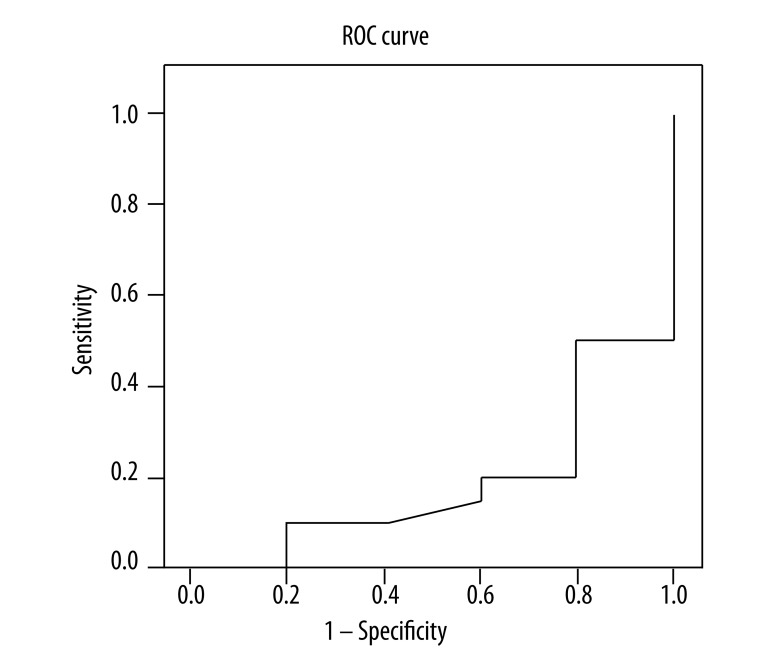
In the ROC curve, the cut off value for NAA/Cho ratio under AUC: 0.185±0.097 was 1.985. Threshold value equal to or less than the cut off level, indicated sensitivity 50–100% while values over the cut-off point predicted specificity 20–100% (Figure 2).
Figure 2.
The ROC curve analysis of NAA/Cho ratio in PWM for OSA patients.
Table 4 shows the mean values of NAA/Cr ratio in PWM, RH and LH regions of OSA patients compared with the control group. There was no statistically significant difference between the OSA patients and the control group for this ratio.
Table 4.
NAA/Cr ratio (mean values) in PWM, RH, LH regions of OSA patients in comparison with the control group.
| Region | Group | N | Mean | Std. deviation | P value |
|---|---|---|---|---|---|
| PWM | Control | 5 | 1.52 | 0.37 | 0.308 |
| OSA | 20 | 1.77 | 0.51 | ||
| RH | Control | 5 | 2.48 | 0.62 | 0.185 |
| OSA | 20 | 2.10 | 1.19 | ||
| LH | Control | 5 | 2.32 | 0.47 | 0.144 |
| OSA | 20 | 1.89 | 0.63 |
Table 5 shows the mean values of Cho/Cr ratio in PWM, RH and LH regions of OSA patients compared with the control group. There was a statistically significant difference between the OSA patients and the control group for Cho/Cr ratio in PWM region. The mean Cho/Cr ratio was higher than the control group (p=0.021).
Table 5.
Cho/Cr ratio (mean values) in PWM, RH, LH regions of OSA patients in comparison with the control group.
| Region | Group | N | Mean | Std. deviation | P value |
|---|---|---|---|---|---|
| PWM | Control | 5 | 0.61 | 0.16 | 0.021* |
| OSA | 20 | 1.07 | 0.46 | ||
| RH | Control | 5 | 1.19 | 0.75 | 0.919 |
| OSA | 20 | 1.23 | 1.17 | ||
| LH | Control | 5 | 1.31 | 0.89 | 0.973 |
| OSA | 20 | 1.13 | 0.59 |
p<0.05.
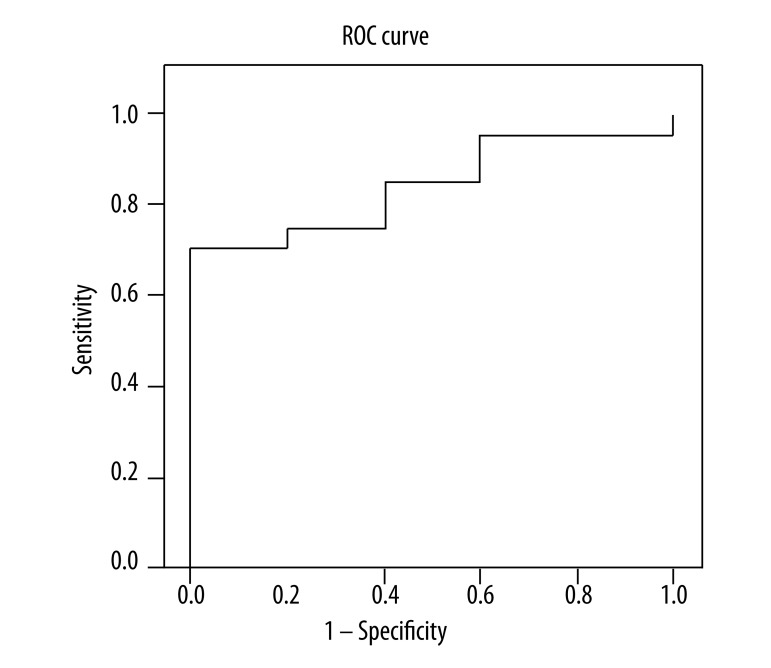
With regard to the Cho/Cr ratio, 70% sensitivity and 100% specificity was observed with threshold cut-off value of 0.835 in the ROC curve and AUC: 0.840±0.080 for the diagnosis of OSA. Specificity remained 100% at all levels.
Values over and less than the 0.835 cut-off point, predicted sensitivity ranging from 70 to 95% (Figure 3)
Figure 3.
The ROC curve analysis of Cho/Cr ratio in PWM for OSA patients.
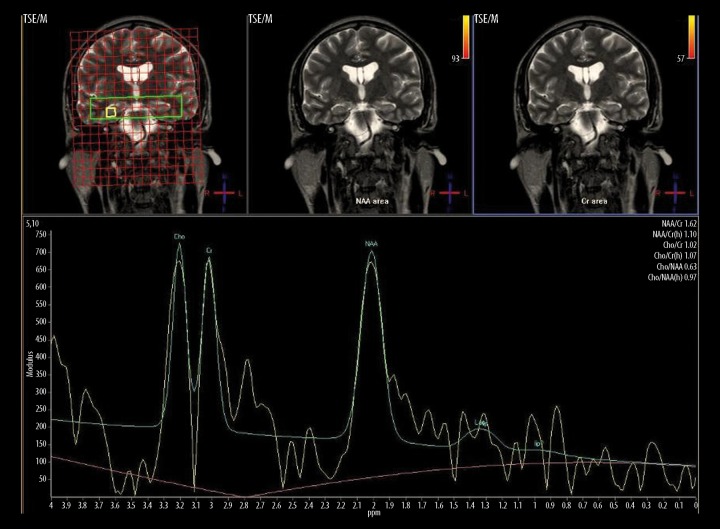
According to these results, all 3 ratios analyzed in this OSA research had no statistically significant differences when compared with the control group for both hippocampal regions (Figures 4 and 5).
Figure 4.
H-MRS of right hippocampus (AHI=49.4) in a 33-year-old, male OSA patient. NAA peak reduction is prominent and NAA/Cho ratio is 1.58 (mean value of control group was 237±0.67).
Figure 5.
H-MRS of left hippocampus (AHI=36.5) in a 47-year-old, male OSA patient. NAA peak reduction is prominent and NAA/Cho ratio is 1.66 (mean value of control group was 2.13±0.73).
Discussion
OSA patients are regarded as mild (5≤ AHI <15), moderate (15≤ AHI <30) and severe (AHI ≥30) according to AHI values [13]. However, AHI value is not the only important criterion. Daytime symptoms (snoring, excessive daytime sleepiness leading to substantial deterioration in the quality of life, difficulty of learning new tasks, reduction in mental performance) and comorbidity (cardiovascular diseases, stroke, myocardial infarction and congestive heart failure) also play a crucial role in the treatment.
H-MRS is a non-invasive technique used to evaluate the pathophysiology of various pathologic processeses [10]. Relative increase or decrease in the levels of some crucial neurotransmitters and amino acids, such as N-acetylaspartate (NAA), myo-inositol (MI), creatine (Cr), choline (cho), lactate (lac), glutamine and glutamate (glx) provide important clues regarding cranial pathology.
Analysis of the functions of these metabolites is crucial to the interpretation of spectral peaks and ratios of these metabolites. In this research; NAA, Cho and Cre are used and NAA/Cho, NAA/Cr and Cho/Cr ratios are mentioned.
NAA is a marker of neuronal viability [14]. NAA decreases in all forms of infltrative, degenerative or destructive brain damage [15–19]. MR spectroscopy provides in vivo quantitative analysis of neuronal loss or damage, which is one of the most important benefits of this technique [20,21].
Increase in Cho resonance reflects an increased cell membrane synthesis and turnover in such abnormal processes as tumor cell proliferation and active demyelinating plaques [15–17,22–24].
Cr and phosphocreatine are ubiquitous metabolites of the ATP/ADP cycle, therefore Cr is considered to be an indicator of energy metabolism. Cr levels generally increase in chronic MS plaques and decrease in acute MS and in glial tumors. Brain tumors generally show decreased Cr levels [15–17,19,22–26]. Cr peak remains relatively stable, therefore it is frequently used as a reference peak to normalize metabolite signal intensities [5].
Decreased levels of NAA in the frontal white matter of OSA patients indicate axonal loss and/or dysfunction [8,9]. Previous studies based on MR spectroscopy have demonstrated reduction in the NAA/Cho ratio in the posterior periventricular white matter along with lactate production in the cerebral white matter of OSA patients during sleep, indicating anaerobic glycolysis caused by hypoxia [27–29].
Deep white matter seems to be selectively affected in OSAS [5]. It has been thought that arterial supply of the deep white matter is not sufficient enough to compensate for the decreased and fluctuating cerebral perfusion. As a result, impaired cerebral vascular autoregulation has been reported in OSA patients [27,30,31]. In fact, arterial network of the deep white matter consists of terminals with no collaterals or anastomoses [32].
Alchanatis et al. [5] reported that NAA/Cr and Cho/Cr ratios were significantly lower in the frontal white matter of patients (n=22) with severe obstructive sleep apnea.
Kamba et al. [28] classified patients (n=23) into two groups based on polysomnography results as mild OSA group and moderate to severe OSA group. A statistically significant difference between the groups was found for the NAA/Cho ratio in the posterior periventricular white matter. This ratio was significantly lower in patients with moderate to severe OSA than in those with mild OSA or healthy subjects. They also reported a modest decrease in NAA/Cre ratio and modest increase in Cho/Cr ratio between the groups but no statistically significant difference was found.
Algin et al. [33] reported that the measurements in the frontal white matter of OSA (n=24) patients exhibited significantly lower NAA/Cho and NAA/Cr ratios compared with those of the control group.
Our findings were nearly parallel to the results of Kamba et al. NAA/Cho ratio of OSA patients in frontal deep white matter was significantly lower than the control group, but in our research patients were not classified according to severity of OSA symptoms. Algin et al. [33] also came to a similar conclusion concerning this ratio in frontal white matter. On the other hand, OSA group displayed higher Cho/Cr ratio compared with the control group in our research, contrary to Alchanatis et al. Our results may indicate that the increase in Cho level was more prominent than the decrease of NAA level.
There are voxel-based morphometry studies in the literature that indicate decreased gray matter density in some areas of the brain in patients with OSA. Some focal structural changes and loss of gray matter in frontal, temporal, parietal and left hippocampal regions were reported. Additionally, some of these voxel-based morphometry studies were supported by functional MRI and cognitive function tests [3].
However, some studies indicate non-significant difference between hippocampi of OSA patients and control groups in terms of a remarkable volume deficit or NAA-containing compounds. In 2004, Bartlett et al. investigated hippocampal regions of 8 OSA patients and 5 controls. Their study revealed no statistically significant difference between these groups with regard to NAA levels. They also reported that NAA/Cr levels in OSA patients were higher than in the control group. This may be related to a decrease in Cr level rather than an increase of NAA levels in this region [34].
In our research, there was no significant difference between hippocampi of OSA patients and controls with regard to NAA/Cho, NAA/Cr and Cho/Cr levels as Bartlett et al. reported.
There were some limitations in this research. None of our patients had temporal lobe epilepsy [35] or schizophrenia [36,37], but there were asymmetric metabolite ratios found in hippocampal regions of our patients. Gender effect could be responsible for this result [38], however, our younger patients were also found to have asymmetric ratios.
In terms of MRS applications, analysis of hippocampal region with MRS has some handicaps because of the adjacent structures, such as bone and cerebrospinal fluid, which may cause interactions and inaccurate spectral results. These irregular values may be due to the difficulty of the technique. In addition, our study consisted of a small number of subjects in both patient and control groups. These results may be validated with a larger number of patients and controls.
Via H-MRS applications in periventricular white matter of OSA patients, NAA/Cho ratio might be an important indicator of hypoxic cerebral impairment in OSA. There were important datas indicating this result when focused and implicated together with prior studies. Further investigations detailed on cerebal metabolism of OSA patients may widen our horizons to find accurate cerebral metabolic changes for this disease.
References
- 1.Young T, Palta M, Dempsey J, et al. The occurrence of sleep-disordered breathing among middle-aged adults. N Engl J Med. 1993;328:1230–35. doi: 10.1056/NEJM199304293281704. [DOI] [PubMed] [Google Scholar]
- 2.Duran J, Esnaola S, Rubio R, et al. Obstructive sleep apnea-hypopnea and related clinical features in a population-based sample of subjects aged 30 to 70 yr. Am J Respir Crit Care Med. 2001;163:685–89. doi: 10.1164/ajrccm.163.3.2005065. [DOI] [PubMed] [Google Scholar]
- 3.Deseilles M, Dang-Vu TD, Schabus M, et al. Neuroimaging insights into the patophysiology of sleep disorders. SLEEP. 2008;31(6):777–94. doi: 10.1093/sleep/31.6.777. [DOI] [PMC free article] [PubMed] [Google Scholar]
- 4.Zimmerman ME, Aloia MS. A review of neuroimaging in obsstructive sleep apnea. J Clin Sleep Med. 2006;2(4):461–71. [PubMed] [Google Scholar]
- 5.Alchanatis M, Deligiorgis N, Zias N, et al. Frontal brain lobe impairment in obstructive sleep apnoea: a proton MR spectroscopy study. Eur Respir J. 2004;24:980–86. doi: 10.1183/09031936.04.00127603. [DOI] [PubMed] [Google Scholar]
- 6.Decary A, Rouleau I, Monplaisir J. Cognitive deficits associated with sleep apnoea syndrome: a proposed neuropsychological test battery. Sleep. 2000;23:369–81. [PubMed] [Google Scholar]
- 7.Engelman HM, Kingshot RN, Martin SE, et al. Cognitive function in the sleep apnoea/hypopnoea syndrome (SAHS) Sleep. 2000;23:102–8. [PubMed] [Google Scholar]
- 8.Rudkin TM, Arnold DL. Proton magnetic resonance spectroscopy for the diagnosis and management of cerebral disorders. Arch Neurol. 1999;56:919–26. doi: 10.1001/archneur.56.8.919. [DOI] [PubMed] [Google Scholar]
- 9.Castillo M, Kwock L, Mukherji SK. Clinical applications of proton MR spectroscopy. Am J Neuroradiol. 1996;17:1–15. [PMC free article] [PubMed] [Google Scholar]
- 10.Aydın H, Sipahioglu S, Oktay NA, et al. The Value of Proton MR-Spectroscopy in the Differentiation of Brain Tumours from Non-neoplastic Brain Lesions. JBR-BTR. 2010;94:3–12. [PubMed] [Google Scholar]
- 11.Patel NP, Ahmed M, Rosen I. Split-Night Polysomnography. Chest. 2007;131:1664–71. doi: 10.1378/chest.06-1801. [DOI] [PubMed] [Google Scholar]
- 12.Lee-Chiong TL., Jr Monitoring respiration during sleep. Clin Chest Med. 2003;24:297–306. doi: 10.1016/s0272-5231(03)00021-2. [DOI] [PubMed] [Google Scholar]
- 13.The Report of an American Academy of Sleep Medicine Task Force. Sleeprelated breathing disorders in adults: recommendations for syndrome definition and measurement techniques in clinical research. Sleep. 1999;22:667–89. [PubMed] [Google Scholar]
- 14.Xu S, Yang J, Shen J. Measuring N-acetylaspartate synthesis in vivo using proton magnetic resonance spectroscopy. J Neurosci Methods. 2008;172(1):8–12. doi: 10.1016/j.jneumeth.2008.04.001. [DOI] [PMC free article] [PubMed] [Google Scholar]
- 15.Papanagiotou P, Backens M, Grunwald IQ, et al. MR-Spektroskopie bei Hirntumoren. Radiologe. 2007;47:520–29. doi: 10.1007/s00117-007-1522-8. [DOI] [PubMed] [Google Scholar]
- 16.Magalhaes A, Godfrey W, Shen Y, et al. Proton magnetic resonance Spectroscopy of brain tumours correlated with pathology. Acad Radiol. 2005;12:51–57. doi: 10.1016/j.acra.2004.10.057. [DOI] [PubMed] [Google Scholar]
- 17.Hartmann W, Herminghaus S, Krings T, et al. Clinical application of proton magnetic resonance spectroscopy in the diagnosis of intracranial mass lesions. Neuroradiology. 2002;44:371–81. doi: 10.1007/s00234-001-0760-0. [DOI] [PubMed] [Google Scholar]
- 18.Poptani H, Gupta R, Roy R, et al. Characterization of Intracranial mass lesions with in vivo Proton MR Spectroscopy. Am J Neuroradiol. 1995;16:1593–603. [PMC free article] [PubMed] [Google Scholar]
- 19.Callot V, Galanaud D, Le Fur Y, et al. H-MR spectroscopy of human brain tumours, A practical approach. Eur J Radiol. 2008;67:268–74. doi: 10.1016/j.ejrad.2008.02.036. [DOI] [PubMed] [Google Scholar]
- 20.Ramin L, Tognolo WA, Spotti AR. Proton MR Spectroscopy: Clinical applications in patients with brain lesions. Sao Paulo Med J. 2003;121(6):254–59. doi: 10.1590/S1516-31802003000600008. [DOI] [PMC free article] [PubMed] [Google Scholar]
- 21.Roitberg B, Khan N, Tuccar E. Chronic ischemic stroke model in cynomolgus monkeys: behavioral, neuroimaging and anatomical study. Neurol Res. 2003;258:68–78. doi: 10.1179/016164103101200950. [DOI] [PubMed] [Google Scholar]
- 22.Mader I, Rauer S, Gall P, et al. H-MR spectroscopy of inflammation, infection and ischemia of te brain. Eur J Radiol. 2008;67:250–57. doi: 10.1016/j.ejrad.2008.02.033. [DOI] [PubMed] [Google Scholar]
- 23.Majos C, Aguilera C, Alonso J, et al. Proton-MR spectroscopy improves discrimination between tumour and pseudo-tumoral lesion in solid brain masses. Am J Neuroradiol. 2009;30:544–51. doi: 10.3174/ajnr.A1392. [DOI] [PMC free article] [PubMed] [Google Scholar]
- 24.Papanagiotou P, Grunwald IQ, Farmakis G, et al. MR-Spektroskopie bei entzündlichen Hirnerkrankungen. Radiologe. 2008;48:582–87. doi: 10.1007/s00117-008-1696-8. [DOI] [PubMed] [Google Scholar]
- 25.Sibtain NA, Howe FA, Saunders DE. The clinical value of proton magnetic resonance spectroscopy in adult brain tumours. Clin Radiol. 2007;62:109–19. doi: 10.1016/j.crad.2006.09.012. [DOI] [PubMed] [Google Scholar]
- 26.Parmar H, Lim TC, Yin H, et al. Multi-voxel MR Spectroscopic imaging of the brain: Utility in clinic al setting-initial results. Eur J Radiol. 2005;55:401–8. doi: 10.1016/j.ejrad.2005.01.002. [DOI] [PubMed] [Google Scholar]
- 27.Kamba M, Inoue Y, Higami S, et al. Cerebral metabolic impairment in patients with obstructive sleep apnoea syndrome: an independent association of obstructive sleep apnoea with white matter change. J Neurol Neurosurg Psychiatry. 2001;71:334–39. doi: 10.1136/jnnp.71.3.334. [DOI] [PMC free article] [PubMed] [Google Scholar]
- 28.Kamba M, Suto Y, Ohta Y, et al. Cerebral metabolism in sleep apnoea: evaluation by magnetic resonance spectroscopy. Am J Resp Crit Care Med. 1997;156:296–98. doi: 10.1164/ajrccm.156.1.9611063. [DOI] [PubMed] [Google Scholar]
- 29.Kamba M, Inoue Y, Higami S, et al. Age-related changes in cerebral lactate metabolism in sleep-disordered breathing. Neurobiol Aging. 2003;24:753–60. doi: 10.1016/s0197-4580(02)00191-4. [DOI] [PubMed] [Google Scholar]
- 30.Leung RST, Bradley TD. Sleep apnoea and cardiovascular disease. Am J Respir Cri Care Med. 2001;164:2147–65. doi: 10.1164/ajrccm.164.12.2107045. [DOI] [PubMed] [Google Scholar]
- 31.Derdeyn CP, Khosla A, Videen TO, et al. Severe hemodynamic impairment and border zone-region infraction. Radiology. 2001;220:195–201. doi: 10.1148/radiology.220.1.r01jl09195. [DOI] [PubMed] [Google Scholar]
- 32.Pantoni L, Garcia JH. Pathogenesis of leukoaraiosis: a review. Stroke. 1997;28:652–59. doi: 10.1161/01.str.28.3.652. [DOI] [PubMed] [Google Scholar]
- 33.Algin O, Gokalp G, Ocakoglu G, et al. Neurochemical-structural changes evaluation of brain in patients with obstructive sleep apnea syndrome. Eur J Radiol. 2012;81(3):491–95. doi: 10.1016/j.ejrad.2010.12.092. [DOI] [PubMed] [Google Scholar]
- 34.Bartlett DJ, Rae C, Thompson CH, et al. Hippocampal area metabolites relate to severity and cognitive function in obstructive sleep apnea. Sleep Med. 2004;5:593–96. doi: 10.1016/j.sleep.2004.08.004. [DOI] [PubMed] [Google Scholar]
- 35.Kuzniecky R, Hugg JW, Hetherington H, et al. Relative utility of H spectroscopic imaging and hippocampal volumetry in the lateralization of mesial temporal lobe epilepsy. Neurology. 1998;51:66–71. doi: 10.1212/wnl.51.1.66. [DOI] [PubMed] [Google Scholar]
- 36.Heckers S. Neuroimaging Studies of the Hippocampus in Schizophrenia. Hippocampus. 2001;11:520–28. doi: 10.1002/hipo.1068. [DOI] [PubMed] [Google Scholar]
- 37.Delamillieure P, Constans JM, Fernandez J, et al. Proton magnetic resonance spectroscopy (H-MRS) in schizophrenia: Investigation of the right and left hippocampus, talamus and prefrontal cortex. Schizophrenia Bulletin. 2002;28(2):329–39. doi: 10.1093/oxfordjournals.schbul.a006942. [DOI] [PubMed] [Google Scholar]
- 38.Nagae-Poetscher LM, Bonekamp D, Barker PB, et al. Asymmetry and gender effect in functionally lateralized cortical regions: A proton MRS imaging study. J Magn Reson Imaging. 2004;19(1):27–33. doi: 10.1002/jmri.10429. [DOI] [PubMed] [Google Scholar]


