Abstract
Background:
Iraq fought three wars in three consecutive decades, Iran-Iraq war (1980-1988), Persian Gulf War in 1991, and the Iraq's war in 2003. In the nineties of the last century and up to the present time, there have been anecdotal reports of increase in cancer in Ninawa as in all provinces of Iraq, possibly as a result of exposure to depleted uranium used by American troops in the last two wars. This paper deals with cancer incidence in Ninawa, the most importance province in Iraq, where many of her sons were soldiers in the Iraqi army, and they have participated in the wars.
Materials and Methods:
The data was derived from the Directorate of Health in Ninawa. The data was divided into three sub periods: 1980-1990, 1991-2000, and 2001-2010. The analyses are performed using Poisson regressions. The response variable is the cancer incidence number. Cancer cases, age, sex, and years were considered as the explanatory variables. The logarithm of the population of Ninawa is used as an offset. The aim of this paper is to model the cancer incidence data and estimate the cancer incidence rate ratio (IRR) to illustrate the changes that have occurred of incidence cancer in Ninawa in these three periods.
Results:
There is evidence of a reduction in the cancer IRR in Ninawa in the third period as well as in the second period. Our analyses found that breast cancer remained the first common cancer; while the lung, trachea, and bronchus the second in spite of decreasing as dramatically. Modest increases in incidence of prostate, penis, and other male genitals for the duration of the study period and stability in incidence of colon in the second and third periods. Modest increases in incidence of placenta and metastatic tumors, while the highest increase was in leukemia in the third period relates to the second period but not to the first period. The cancer IRR in men was decreased from more than 33% than those of females in the first period, more than 39% in the second period, and regressed to 9.56% in the third period.
Conclusion:
Our paper confirms the media reports that there are increases in the number of cancer cases, but when it analyzed statistically with population growth in the Ninawa province, there are decreases in incidence rates in most cancer types.
Keywords: Cancer, incidence rate ratio, Ninawa, Poisson regression
INTRODUCTION
Ninawa is a second biggest province in Iraq after Baghdad (Capital of Iraq), it is located in the north of Iraq. It has an area of 37,323 square kilometers and an estimated population of 3,270,422 people in 2011 according to the Central Organization for Statistics (the population data were estimated based on the results of the 1997 census).[1] Ninawa bordering Syria and Turkey, the provincial capital is Mosul.
In Ninawa there are three specialized cancer treatment center, which are the Mosul Oncology and Nuclear Medicine Hospital for the treatment of patients with cancer, Specialist Center for Breast Diseases, and Ibn Al-Atheer Hospital for Leukemia. Cancer is one of the serious diseases in Ninawa that leads to the death in many cases. Figure 1 displays the cancer incidence and death by cancer (the data of cancer deaths is not available between 1980 and 1992). The figure reflects the fact that, in most cases, the patients with cancer in Ninawa are dying, this because most of the cancer cases are detected at an advanced stage, treatment, and care are seriously deficient.[2] Figure 2 displays the incidence rate (the number of incidences divided by the (100,000) population per year) for all cancer sites combined between 1980 and 2010. Incidence rates of all cancers combined have overall increased in Ninawa since 1985. The highest incidence rates were in the 1993, where rates steadily increased from 23.8707 in 1980 to 44.9808 in the 1993, incidence rates have leveled off since then, decreasing to 40.1746 in 1999 and increasing during 2000-2004 to 43.4496 except 2002, oscillatory rate during 2005-2010. The incidence rate in 2010 was 35.5373.
Figure 1.
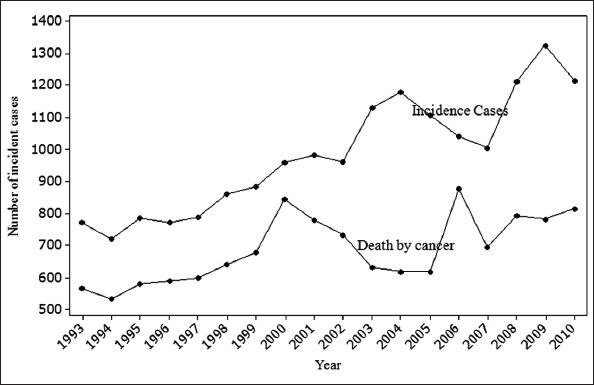
Deaths for all cancers vs incidence cases, Ninawa/Iraq 1993-2010
Figure 2.
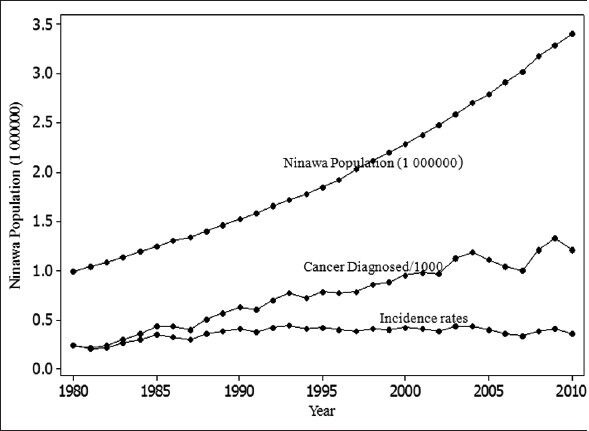
Ninawa population, cancers diagnosed for all cancers and incidence rates, Ninawa/Iraq, 1980-2010
Breast cancer, the most common cancer in Ninawa with 3,563 cases from 1980 to 2010 accounted for 15.3% of all cancers diagnosed in Ninawa [Figure 3]. Lung, trachea, and bronchus is the second most common cancer (13.6%), non-Hodgkin lymphoma (NHL) cancer is the third (6%), larynx is the fourth (5.9%), and the fifth most common cancer is the leukemia (5.3%). The account of these five cancers is 46.1% of all cancers diagnosed in Ninawa from 1980 to 2010.
Figure 3.
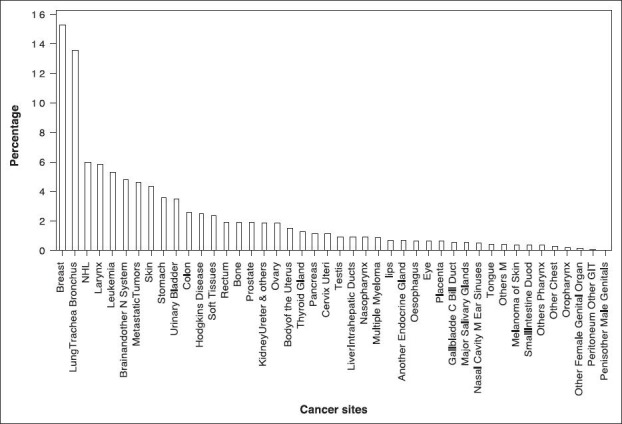
Percentage distribution for all cancer types, males and females combined, Ninawa/Iraq 1980-2010
Lung, trachea and bronchus accounts for more than one in five (22.6%) cases diagnosed in male [Figure 4]. Other common cancers for males is larynx, NHL, leukemia, urinary bladder, and brain and other nervous system (9.1, 6.7, 5.7, 5.7, and 5.1%); these six cancer site diseases account for 54.9% of cases diagnosed in males from 44 cancer sites. About a third (32.6%) of cases diagnosed in females is breast cancer [Figure 5], NHL, leukemia, skin, and brain and other nervous system. Metastatic tumors account for 5.1, 4.8, 4.8, 4.5, 4.2% of cases, respectively; these six cancer site diseases account for 56% of cases diagnosed in females.
Figure 4.
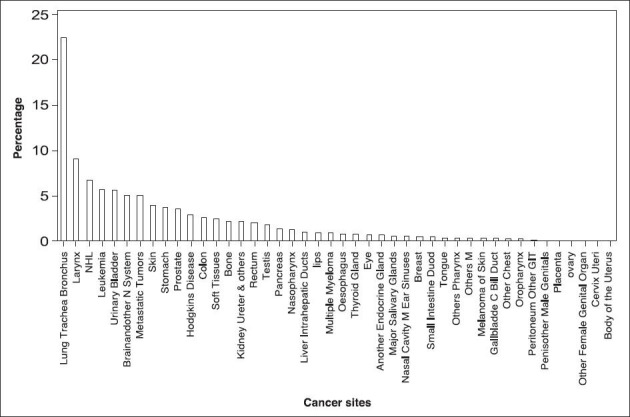
Percentage distribution for all cancer types, males, Ninawa/Iraq 1980-2010
Figure 5.
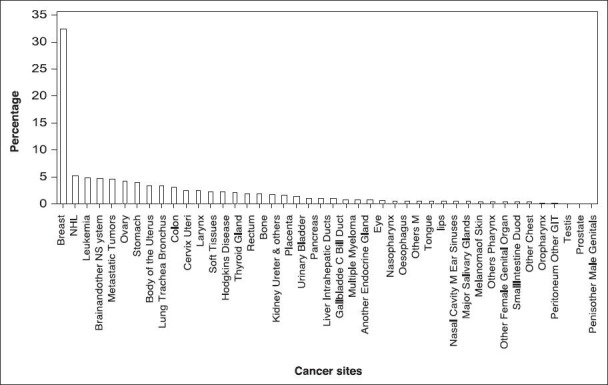
Percentage distribution for all cancer types, females, Ninawa/Iraq 1980-2010
Cancer is more common among older people, and relatively rare in children, the incidence rates increasing with age for most cancers. Form Figure 6 we observe 15.2% of cancer cases diagnosed in people aged 70 and over; for the people aged 60-64, 50-54, 55-59, 65-69, 45-49, 40-44, 35-39, 30-34, and 0-4 years, the accounts are 13.1, 11.8, 9.3, 9.2, 8.4, 7.0, 5.3, 3.9, and 3.2%, respectively. Which stands out in this figure is the category 0-4 which precede the aged 5-9, 10-14, 15-19, 20-24, and 25-29 which accounts for 3.1, 2.8, 2.6, 2,6 and 2.2%. This requires in depth study of the causes of incidence in this age.
Figure 6.
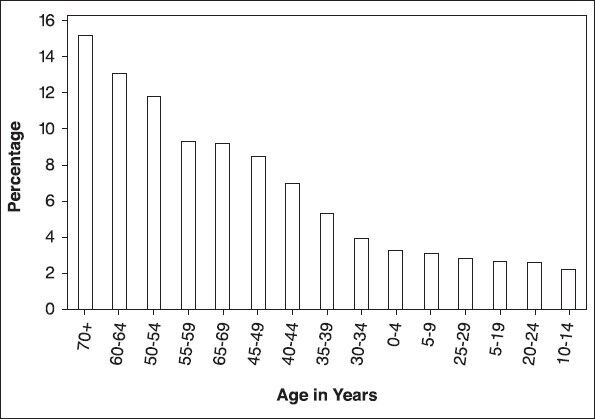
Cancers diagnosed by age, Ninawa/Iraq, 1980-2010
There have been media reports of increase in cancer in Ninawa as in all provinces of Iraq and have been blamed for some time on mutagenic and carcinogenic agents (like depleted uranium) employed in the wars of 1991 and 2003.[3] Increase in childhood leukemia in Basrah have recently been investigated and the findings confirm that there has indeed been a significant increase since 1991,[4] in Fallujah also have recently been investigated and confirm the reported increase in cancer and infant mortality which are alarmingly high.[3] To investigate the media reports of increase in cancer in Ninawa, the most importance provinces in Iraq, where many of her sons were soldiers in the Iraqi army, and they have participated in the three wars, as it were, the last bastions of resistance after the fall of Saddam Hussein. The data was divided into three sub periods: The first between 1980 and 1990 [Figure 7] which includes the period of the Iran-Iraq war (1980-1988), the second between 1991 and 2000 [Figure 8] which include the Persian Gulf War, and followed by economic sanctions on Iraq, the last from 2001-2010 which [Figure 9] include the Iraq war and followed by a 7-year occupation and a complete destruction of the infrastructure. In the last two wars, the depleted uranium munitions have been used in Iraq.[4,5]
Figure 7.
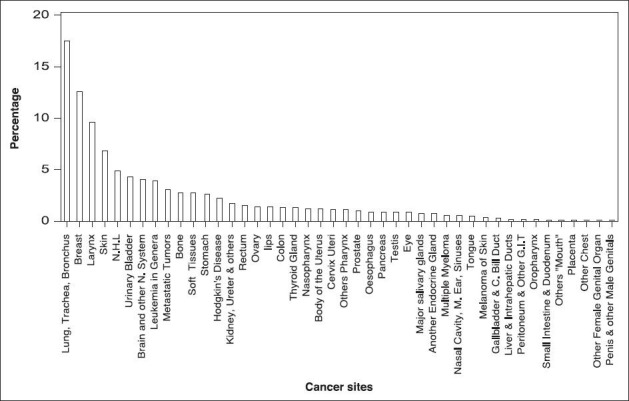
Percentage distribution for all cancer sites, males and females combined, Ninawa/Iraq 1980-1990
Figure 8.
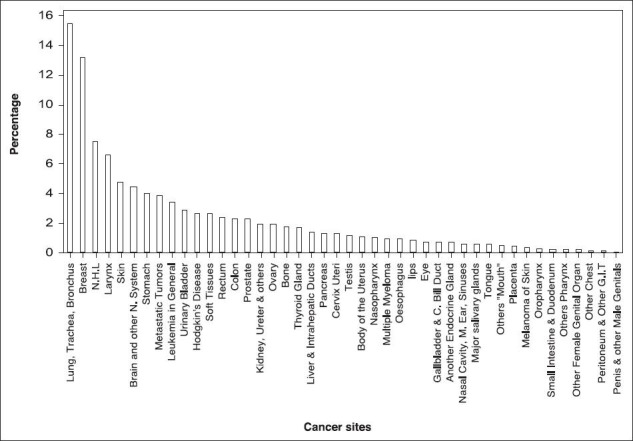
Percentage distribution for all cancer sites, males and females combined, Ninawa/Iraq 1991-2000
Figure 9.
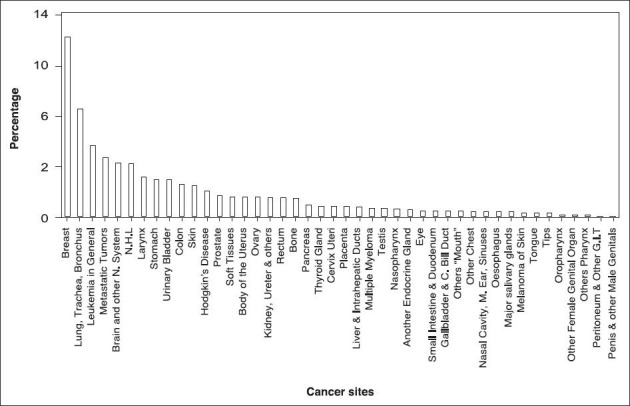
Percentage distribution for all cancer sites, males and females combined, Ninawa/Iraq 2001-2010
For the most common cancer, we observed a substantially decrease in lung, trachea, and bronchus. The rates decreased from 17.5% in 1980-1990 to 15.5% in 1991-2000 and to 10.8% in 2001-2010. Similarly, larynx and skin also decreased from 9.6 and 6.9% in 1980-1990 to 6.6 and 4.7% in 1990-2000 and to 3.9 and 3.1% in 2001-2010, respectively. In contrast, an increase in breast, brain and other nervous system, and metastatic tumors during the same time period from 12.6, 4.0, and 3.1% in 1980-1990 to 13.1, 4.4, and 3.8% in 1991-2000 and to 17.9, 5.4, and 5.8% in 2001-2010, respectively. Urinary bladder and leukemia incidence rates has leveled off, decreased from 4.3 and 3.9% in 1980-1990 to 2.9 and 3.4% in 1990-2000 and increased to 3.6 and 7.1% in 2001-2010, respectively. In contrast, NHL increased from 4.9% in 1980-1990 to 7.5% in 1991-2000 and decreased to 5.3% in 2010.
MATERIALS AND METHODS
Data were derived from the Directorate of Health in Ninawa-Mosul Continuing Medical Education Center who published the results of Mosul Cancer Registry annually.[6] The data were collected from all hospitals in Ninawa Province and contained all cancer cases by site, age, and sex that registered in Mosul. Population data were derived from the Central Organization for Statistics, Ministry of Planning.[1] The data analyzed for each sub period 1980-1990, 1991-2000, and 2001-2010 using the Poisson regression with a log link function. The mean, μi, of the number of incidence cases in Ninawa, which is a count variable and considered as response variable related to the factors year, cancer site, age, and sex (which considered as the explanatory variables) for observation i by:
log(μi) = log(popi) + α + yeari(j)βj + cancersitei(k)γk + agei (l) δl + sexi (n)θn. (1)
The indicator variables yeari (j), cancer sitei (k), agei (l), and sexi (n) are associated with the (j,k,l,n) levels of the variables year, cancer site, age, and sex for observation i. The α, βs, γs, δs, and θs are regression coefficients that represent the expected change in the log of the mean per unit change in the explanatory variables, the logarithm of the variable (pop) which is a known quantity, used as an offset. A log linear relationship between the mean and the factors year, cancer site, age, and sex were specified by the log link function.
The factors as follows:
Year (j) group is a categorical predictor with 11 levels for the period 1980-1990, 10 levels for the period 1991-2000, and 10 levels for the period 2001-2010.
cancersite (k) group is a categorical predictor with 44 levels: The diagnostic groups were coded based on the International Classification of Diseases (ICD 9th revision) [Table 1].
Table 1.
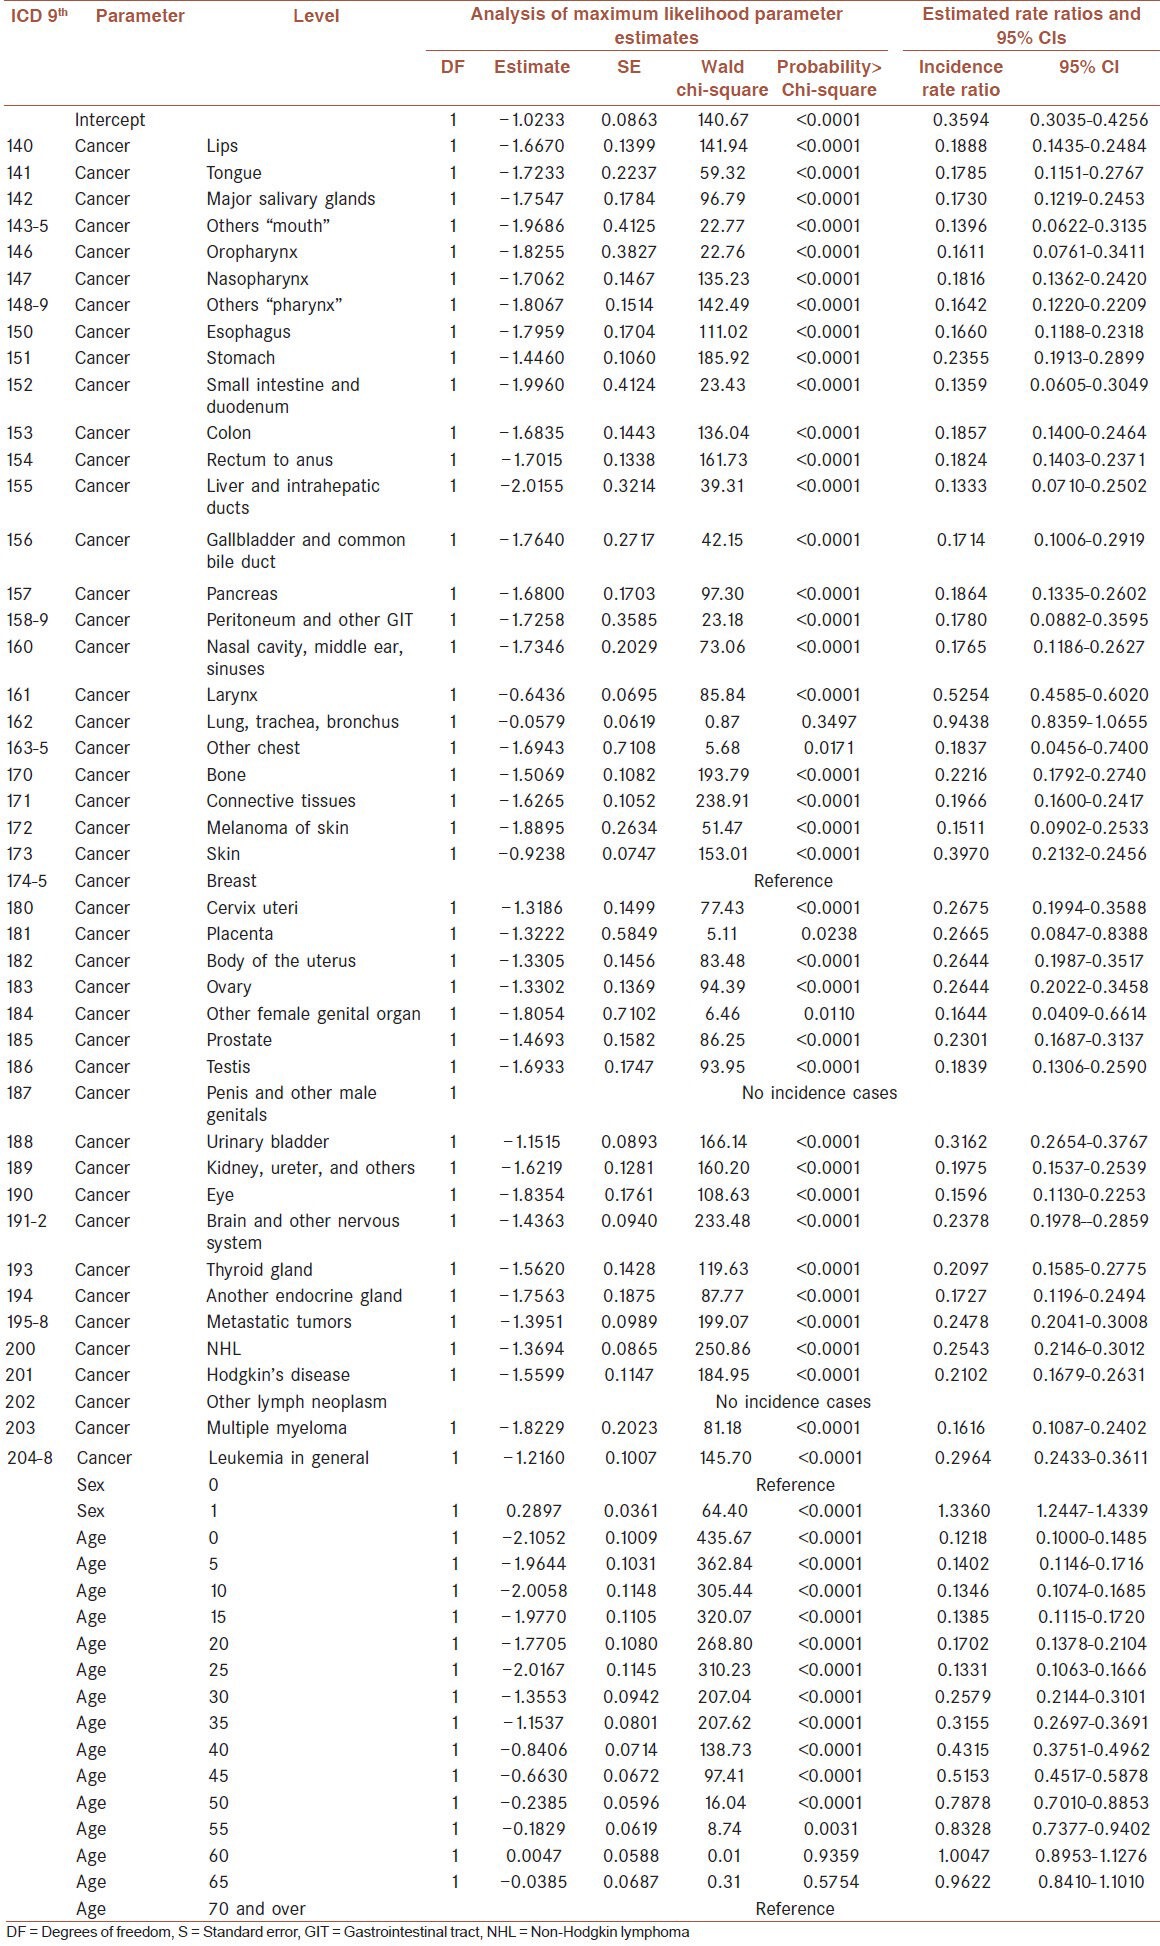
The ninth revision of the International Classification of Diseases which coded the cancer site (ICD 9th). Analysis of maximum likelihood parameter estimates, incidence rate ratio, and 95% confidence intervals (CIs) for the period (1980-1990)
age (l) group is a categorical predictor with 15 levels: 0-4, 5-9, 10-14, 15-19, 20-24, 25-29, 30-34, 35-39,40-44, 45-49, 50-54, 55-59, 60-64, 65-69, and 70 and over were coded as 0, 5, 10, 15, 20, 25, 30, 35, 40, 45, 50, 55, 60, 65, and 70, respectively.
sex (n) is a categorical predictor group with two levels: 0 = female and 1 = male.
The incidence rate ratio (IRR) with its 95% confidence intervals was calculated. The IRR corresponds to the exponential of the coefficients that estimated, IRR = exp (estimate of the parameters).
The data were analyzed with Statistical Analysis Software (SAS) 9.2 by Genmod procedure[7] to fit the Poisson regression analysis and the IRR. The references values are female breast cancer, the age 70 years and over, and year is 1980.
RESULTS
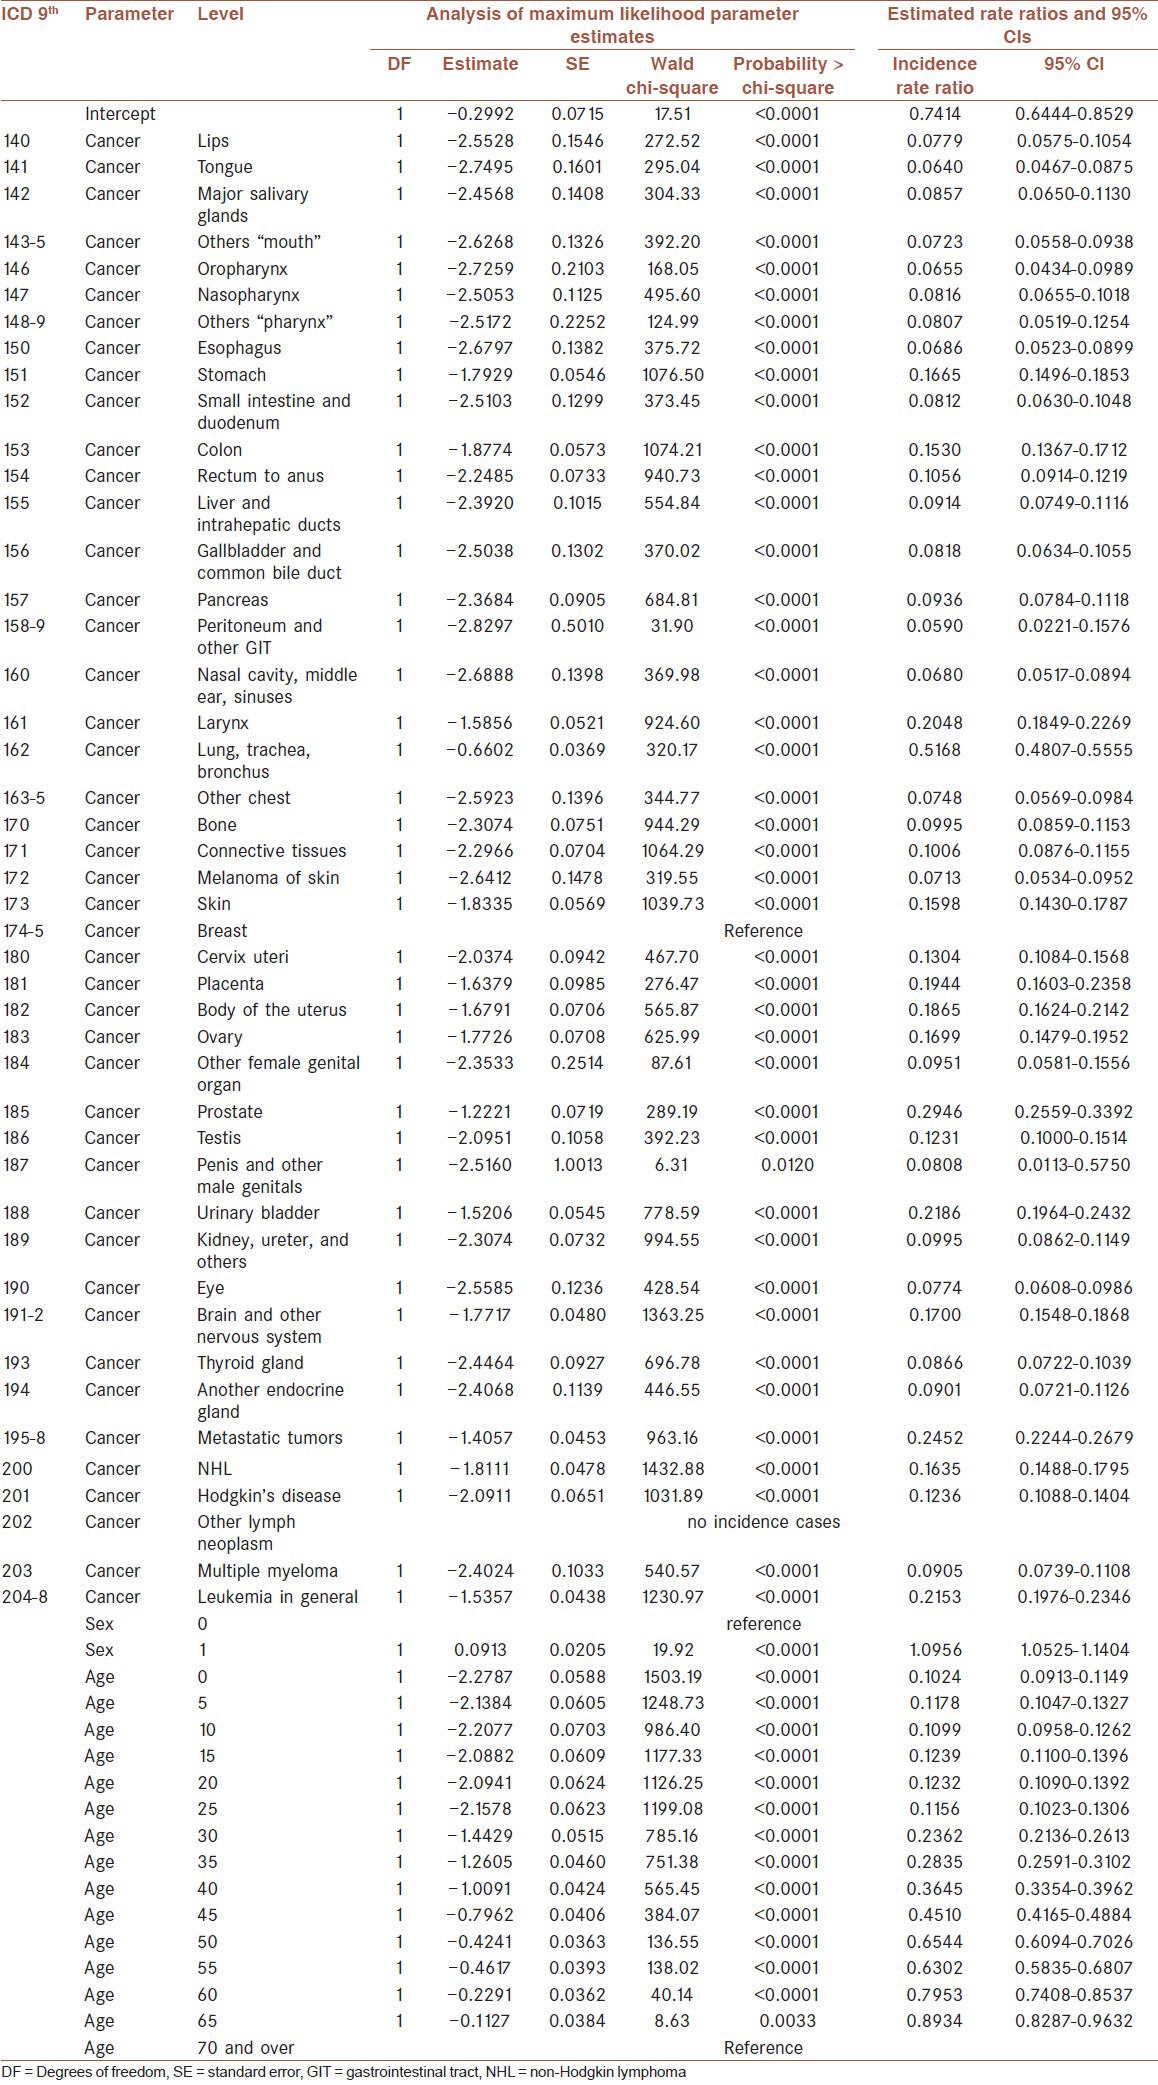
Tables 1, 2, and 3 displays the analysis of parameter estimates and the IRR for the periods 1980-1990, 1991-2000, and 2001-2010, respectively, excluding the year variable which is not significant. The tables contains the Ninth Revision of the International Classification of Diseases which coded the cancer sites (ICD 9th), the parameter and the levels for each parameter, the analysis of maximum likelihood parameter estimates, which summarizes the results of the iterative parameter estimation process, contains the degrees of freedom (DF), the estimated parameter value, the standard error (SE) of the parameter estimate and the Wald chi-square statistic and associated P-value for testing the significance of the parameter to the model as well as the IRR with its 95% confidence intervals (95% CIs).
Table 2.
The ninth revision of the International Classification of Diseases which coded the cancer site (ICD 9th). Analysis of maximum likelihood parameter estimates, incidence rate ratio, and 95% confidence intervals (ICs) for the period (1991-2000)
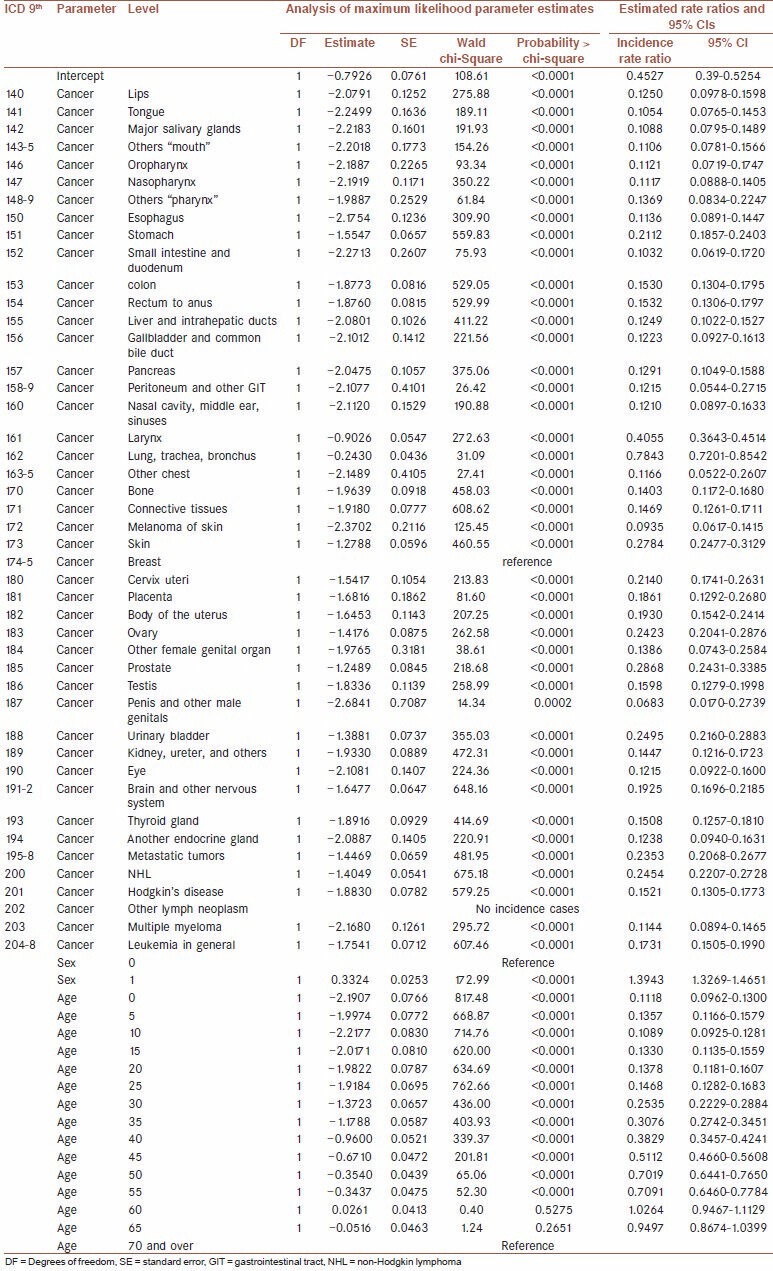
Table 3.
The ninth revision of the International Classification of Diseases which coded the cancer site (ICD 9th). Analysis of maximum likelihood parameter estimates, incidence rate ratio and 95% confidence intervals (CIs) for the period (2001-2010)
The ICD 9th, analysis of maximum likelihood parameter estimates, IRR, and 95% CIs for the period 1980-1990 are shown in Table 1. There have been statistically significant with a significance level of 0.01 in rate ratio for all cancer sites (except lung, trachea, and bronchus), males as a level of the factor sex and for all ages (except ages 60 and 65 years) in comparison with the reference values.
From Table 1 and Figure 10, the estimated coefficient of the levels for the cancer sites parameter is comparing to breast cancer, given the other variables are held constant. The difference in the logs of expected counts of the response variable is expected to be less for the all levels of the cancer sites compared to breast cancer, while holding the other variables constant. Breast on top of the list, lung cancer is the second most frequently diagnosed cancer, and larynx is the third; skin, urinary bladder, leukemia, cervix uteri, placenta, and body of the uterus and ovary are the 10 most commonly diagnosed cancers during the period from 1980 to 1990. For the age parameter, the estimated coefficient of levels for the age parameter is comparing to age 70 and over, given the other variables is held constant. The difference in the logs of expected counts of the response variable is expected to be 0.0047 unit higher for the age 60 compared to age 70 and over, while the ages 65, 55, 50, 45, 40, 35, 30, 20, 5, 15, 10, 25, and 0 (sorted by decreasing) less than 70 and over, holding the other variables constant. For the males, the estimated coefficient comparing males to females, given the other variables are held constant. The difference in the logs of expected counts of the response variable is expected to be 0.2897 units higher for males compared to females, while holding the other variables constant.
Figure 10.
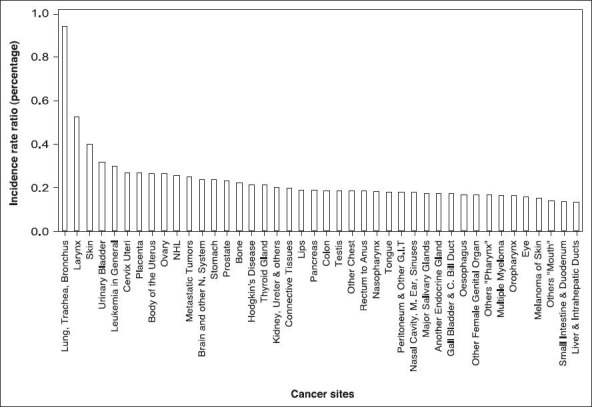
Distribution for all cancer sites (reference cancer site=Female breast), males and females combined according to incidence rate ratio, Ninawa/Iraq 1980-1990
From Table 2 and Figure 11, the estimated coefficient of the levels for the cancer sites parameter is comparing to breast cancer, given the other variables are held constant. The difference in the logs of expected counts of the response variable is expected to be less for the all levels of the cancer sites compared to breast cancer, while holding the other variables constant. Breast on top of the list, lung cancer is the second most frequently diagnosed cancer, and larynx is the third; prostate, skin, urinary bladder, NHL, ovary, metastatic tumors, and cervix uteri, these the 10 most commonly diagnosed cancers during the period from 1991 to 2000. For the age parameter, the estimated coefficient of levels for the age parameter is comparing to age 70 and over, given the other variables is held constant. The difference in the logs of expected counts of the response variable is expected to be 0264 unit higher for the age 60 compared to age 70 and over, while the ages 65, 55, 50, 45, 40, 35, 30, 25, 20, 5, 15, 0, and 10 (sorted by decreasing) less than 70 and over, holding the other variables constant. For the males, the estimated coefficient comparing males to females, given the other variables are held constant. The difference in the logs of expected counts of the response variable is expected to be 0.3324 units higher for males compared to females, while holding the other variables constant.
Figure 11.
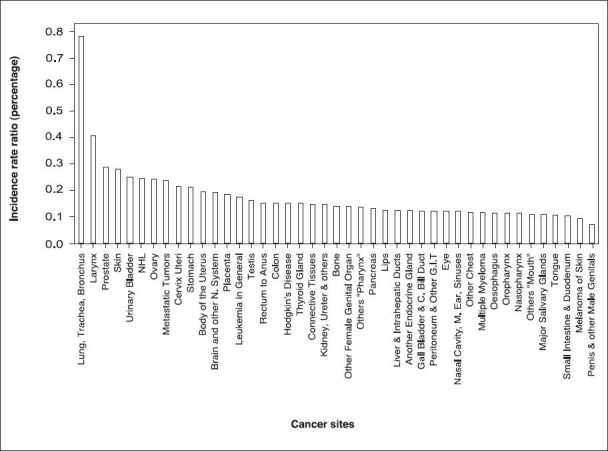
Distribution for all cancer sites (reference cancer site=Female breast), males and females combined according to incidence rate ratio, Ninawa/Iraq 1991-2000
From Table 3 and Figure 12, the estimated coefficient of the levels for the cancer sites parameter is comparing to breast cancer, given the other variables are held constant. The difference in the logs of expected counts of the response variable is expected to be less for the all levels of the cancer sites compared to breast cancer, while holding the other variables constant. Breast on top of the list, lung cancer is the second most frequently diagnosed cancer, and prostate is the third; metastatic tumors, urinary bladder, leukemia, larynx, placenta, body of uterus, and brain and other nervous system, these the 10 most commonly diagnosed cancers during the period from 2001 to 2010. For the age parameter, the estimated coefficient of levels for the age parameter is comparing to age 70 and over, given the other variables is held constant. The difference in the logs of expected counts of the response variable is expected to be less for the all ages compared to age 70 and over, while the ages 65, 60, 50, 55, 45, 40, 35, 30, 15, 20, 5, 25, 10, and 0 (sorted by decreasing) less than 70 and over, holding the other variables constant. For the males, the estimated coefficient comparing males to females, given the other variables are held constant. The difference in the logs of expected counts of the response variable is expected to be 0.0913 units higher for males compared to females, while holding the other variables constant.
Figure 12.
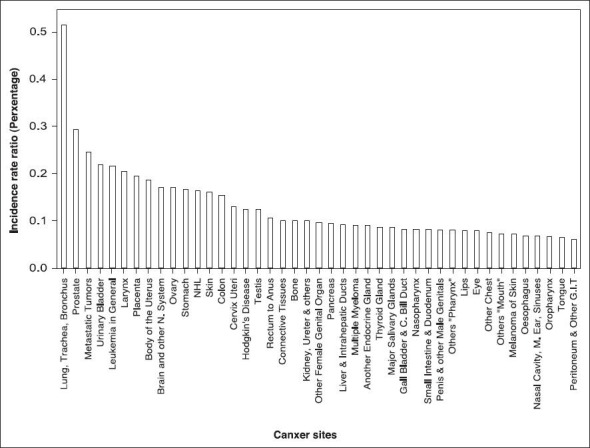
Distribution for all cancer sites (reference cancer site=Female breast), males and females combined according to Incidence rate ratio, Ninawa/Iraq 2001-2010
DISCUSSION
From the analysis, we can observe that there is a significant decrease in most of the cancer IRR in Ninawa in the second and third period relates to the first period. For the three periods, there was no significant difference in the years, indicating that the trend over time between the groups is the same for each of the three periods. The cancer IRR in men is decreased from more than 33% than those of females in the first period, and more than 39% in the second period, regressed to 9.56% in the third period, holding the other variables constant. Female breast cancer IRR is in the top list of the three periods, while the lung, trachea, and bronchus decrease from 5.75% less than breast in the first period to 21.5 and to 48.5% less than breast in the second and third period, respectively. A significant decrease of the cancer IRR for the age 60-64 in the third period, it is 20.5% less than age 70 and over, while it is in the first and second period 0.47 and 2.64% more than age 70 and over, respectively. The other age groups revealed modestly in decreasing, its few rate ratio in younger age groups, while its substance in the older age groups. Larynx decrease significantly from 47.5% less than breast in the first period to 59.5 and 79.5% less than breast in the second and third periods, respectively. Cervix uteri and body of the uterus and ovary, as the most commonly diagnosed cancers in females, approximately 73.5% less than breast in the first period, are decreased to 78.5, 80.5, and 76% respectively in the second period and to the 87, 81.5, and 83%, respectively in the third period. Placenta decreased from 73.5% less than breast in the first period to 81.5% in the second period, an increase in the third period to 80.5%, but it is less than it was in the first period. Stomach, colon, small intestine and duodenum, rectum to anus, liver and intrahepatic ducts, gallbladder, and common bile duct and pancreas decrease from 76.5, 81.5, 86.5, 82%, 87, 83, and 81.5%, respectively, less than breast in the first period to 79, 85, 90, 85%, 87.5, 88, and 87%, respectively, less than breast in the second period to 83.5, 85, 92, 89.5, 91, 92, and 91%, respectively, less than breast in the third period. Lips, tongue, major salivary glands, oropharynx, nasopharynx, esophagus, peritoneum and other gastrointestinal (GIT), nasal cavity, middle ear, sinuses, other chest, bone, melanoma of skin, eye, and multiple myeloma decrease in the third period by some 30% than in the second period and by some 50% than in the first period. Others “mouth”, others “pharynx”, skin, kidney, ureter and others, connective tissues, another endocrine gland, eye, and thyroid gland decrease in the second period by some 20% than in the first period, decreased in the third period by some 35% than in the second period and by some 50% than in the first period. Brain and other nervous system and NHL decrease in the third period by some 30% than in the first period, while Hodgkin's disease have decreased by some 40% than in the first period. Prostate and penis and other male genitals increase from 77 and 100% respectively, less than breast in the first period to 71.5 and 95%, respectively, in the second period to the 70.5 and 92%, respectively in the third period. Metastatic tumors remained relatively stable throughout the duration of the study period. Leukemia regressed 70.5% in the first period to 82.5% less than breast in the second period, then rose to 78.5% less than breast in the third period.
Overall, it is encouraging that there is evidence of a reduction in the cancer IRR in Ninawa in the third period as well as in the second period. Our analyses found that breast cancer remained the most common cancer, while the lung, trachea, and bronchus the second in spite of decreasing as dramatically. Modest increases in incidence of prostate, penis, and other male genitals for the duration of the study period, and stability in incidence of colon in the second and third periods, modest increases in incidence of placenta and metastatic tumors; while the highest increase is in leukemia in the third period relates to the second period, but not to the first period. The result of leukemia is consistent with those of Busby et al.,[3] who found high risk in all leukemia; Alrudainy et al.,[4] and Hagopian et al.,[8] found a high incidence in children in Basrah in compared with other countries. Leukemia is a concern and requires further epidemiological studies.
CONCLUSION
Our paper confirms the media reports that there is increase in the number of cancer cases, but when it analyzed statistically with the population growth in the Ninawa province, there were decrease in incidence rates of the most cancer types.
ACKNOWLEDGEMENT
This study was supported by the Ministry of Higher Education and Scientific Research/University of Mosul/Iraq.
Footnotes
Source of Support: Nil
Conflict of Interest: None declared.
REFERENCES
- 1.Statistics Cof. Annual Abstract of Statistics 2010-2011 (Baghdad) 2010-2011. [last accessed September 30, 2012]. Available from: http://www.cosit.gov.iq/english/section_2.php .
- 2.Ala’din A. 2nd edition. Baghdad: Ministry of Health; 2004. Dec, MD, FRCP, FFPH. Health in Iraq, the Current situation, our vision for the future and areas of work. Available from: http://www.who.int/hac/crises/irq/background/Iraq_Health_in_Iraq_second_edition.pdf . [Google Scholar]
- 3.Busby C, Hamdan M, Ariabi E. Cancer, infant mortality and birth sex-ratio in Fallujah, Iraq 2005-2009. Int J Environ Res and Public Health. 2010;7:2828–37. doi: 10.3390/ijerph7072828. [DOI] [PMC free article] [PubMed] [Google Scholar]
- 4.Alrudainy L, Mahmood Salih H, Mohammed AK. Incidence and pattern of childhood leukaemia in Basrah, Iraq during 2003−2007. Iran J Blood Cancer. 2009;2:11–17. [Google Scholar]
- 5.Giannardi C, Dominici D. Military use of depleted uranium: Assessment of prolonged population exposure. J Environ Radioact. 2003;64:227–36. doi: 10.1016/s0265-931x(02)00051-6. [DOI] [PubMed] [Google Scholar]
- 6.Ismail A, Al-Ramadani A. Cancer in Mosul, incidence and mortality results of Mosul registry; Mosul Continuing Medical Education Center, Directorate of Health in Ninawa, Mosul. 2010 [Google Scholar]
- 7.Cary, NC: SAS Institute, Inc; 2005. SAS Institute Inc. SAS statistical software. Release 9.2. [Google Scholar]
- 8.Hagopian A, Lafta R, Hassan J, Davis S, Mirick D, Takaro T. Trends in childhood leukemia in Basrah, Iraq, 1993-2007. Am J Public Health. 2010;100:1081–7. doi: 10.2105/AJPH.2009.164236. [DOI] [PMC free article] [PubMed] [Google Scholar]


