

Abstract
Building on a unique exposure assessment project in New York, New York, we examined the relationship of particulate matter with aerodynamic diameter less than 2.5 μm and nitrogen dioxide with birth weight, restricting the population to term births to nonsmokers, along with other restrictions, to isolate the potential impact of air pollution on growth. We included 252,967 births in 2008–2010 identified in vital records, and we assigned exposure at the residential location by using validated models that accounted for spatial and temporal factors. Estimates of association were adjusted for individual and contextual sociodemographic characteristics and season, using linear mixed models to quantify the predicted change in birth weight in grams related to increasing pollution levels. Adjusted estimates for particulate matter with aerodynamic diameter less than 2.5 μm indicated that for each 10-µg/m3 increase in exposure, birth weights declined by 18.4, 10.5, 29.7, and 48.4 g for exposures in the first, second, and third trimesters and for the total pregnancy, respectively. Adjusted estimates for nitrogen dioxide indicated that for each 10-ppb increase in exposure, birth weights declined by 14.2, 15.9, 18.0, and 18.0 g for exposures in the first, second, and third trimesters and for the total pregnancy, respectively. These results strongly support the association of urban air pollution exposure with reduced fetal growth.
Keywords: air pollution, birth weight, nitrogen dioxide, particulate matter, pregnancy
Over the past decade, the literature suggesting possible adverse effects of air pollution on pregnancy has grown considerably (1, 2). Air pollution may affect pathways involving oxidative stress and chronic inflammation, which are believed to influence the course and outcome of pregnancy (3). Studies have generated results that support possible adverse effects of particulate matter with aerodynamic diameter less than 2.5 μm (PM2.5), particulate matter with aerodynamic diameter less than 10 μm, nitrogen dioxide, and carbon monoxide on fetal growth, preterm birth, preeclampsia, birth defects, and infant mortality (3, 4). Although the volume and quality of studies have grown considerably, the evidence remains inconclusive.
Several sources of uncertainty limit confidence in the findings (3). Exposure assessment methods are often based on regulatory monitoring data, which lack the spatial resolution to capture intraurban differences in exposure at the neighborhood or individual level. Air pollution levels are often highest in the most socioeconomically deprived areas, and adjustment for confounding by socioeconomic deprivation is incomplete. Definition of health endpoints varies across studies, which hinders attempts at replication. Finally, data analysis is challenging, with multiple candidate time windows for adverse effects, pregnancy duration that spans seasons with varying exposures, and both temporal and spatial determinants of exposure with differing susceptibility to measurement error and confounding.
We report findings on exposures to PM2.5 and nitrogen dioxide and birth weight among term births from a study with uniquely detailed exposure assessment data from the New York City Community Air Survey (NYCCAS) (5). NYCCAS data, which provide far greater spatial resolution than was available in previous birth outcome studies, were linked to individual addresses for a large number of births in a setting where lower socioeconomic status is not associated with higher air pollution exposure, reducing the potential for confounding.
MATERIALS AND METHODS
Study population
Birth records of 348,585 livebirths to residents of New York, New York, in New York City hospitals during the years 2008–2010 (Figure 1) were available for analysis, excluding the estimated 4% of livebirths to New York residents that occurred at hospitals outside the city of New York. Our interest was in variation in normal fetal growth, so we included only singleton births free of congenital malformations to nonsmoking mothers with 37–42 completed weeks' gestation. We sought a cohort of conceptions in a defined time period that resulted in term livebirths, and therefore excluded births with an estimated date of conception more than 22 weeks before July 31, 2007, or less than 42 weeks after March 12, 2010, to avoid the fixed-cohort bias (6). We also excluded those missing residence information for assigning exposure, those with implausible birth weights (<500 or >5,000 g), and those with missing covariate information (Figure 1). This left 252,967 births for the analysis of air pollution and birth weight.
Figure 1.

Population source and exclusions for the study of air pollution and birth weight, New York, New York, 2008–2010.
Exposure assignment
We used 2 sources of air pollution data to estimate exposures to PM2.5 and nitrogen dioxide at each mother's address at the birth of her child, 1 to generate a spatial surface of exposure and the other to temporally adjust the spatial estimates to match gestational exposure time windows (7, 8). Briefly, as part of NYCCAS (5, 9), 2-week average concentrations at street level (10–12 feet above the ground; 1 foot = 30.5 cm) of several pollutants, including PM2.5 and nitrogen dioxide, were collected in each of the 4 seasons for the period December 2008 through December 2010. These measurements were used to generate annual averages at the monitoring locations (9). The annual average estimates for December 2008–December 2009 were used to fit spatial models for each pollutant as described below, and data from December 2009–December 2010 were used for validation of the spatiotemporal model.
The approach for development of the spatial component of the exposure models is described in detail elsewhere (9, 10). Briefly, geographic information systems were used to compute variables on emissions and land use within buffer regions around each monitoring location. Each of these variables was tested for inclusion in regression models predicting the annual average pollutant concentrations across the 790 km2 of the city. The final regression models included the strongest predictor variables and were extended to account for residual spatial autocorrelation using kriging with external drift (11). These models were applied to estimate average pollutant concentrations within 300 m of each maternal address. The spatial exposure surface described above (based on annual average concentrations) was then temporally adjusted to match pregnancy time windows using a citywide time series computed from continuous regulatory monitors. In a validation, the R2 values for predictions of 2-week average concentrations of PM2.5 and nitrogen dioxide against actual concentrations measured during year 2 at the 150 NYCCAS distributed sites were 0.83 and 0.79, respectively.
Birth outcome and covariates
With the restrictions noted above, we considered births in the 37- to 42-week range and examined the impact of air pollution on a continuous measure of birth weight in grams. We considered and adjusted as needed for covariates known or suspected to be associated with birth weight, including maternal age, race/ethnicity (non-Hispanic white, black, Hispanic, Asian, other, or unknown), education (<9, 9–11, 12, 13–15, 16, or >16 years), parity (0, 1, 2, or ≥3), gestational age at birth (37, 38, 39, 40, 41, or 42 weeks), and Medicaid status (no/yes), identifying women of low income who qualified for this program. Mothers who reported smoking were excluded from the analysis. We assigned maternal residence according to the 2,140 US Census tracts (mean = 118 births/tract) and developed a social deprivation index for addressing potential confounding by neighborhood socioeconomic status. We adapted the approach of Messer et al. (12), using principal components analysis to derive a composite index, which included the following 7 contextual variables: percent with college degree, percent unemployment, percent management/professional occupation, percent residential crowding, percent below 200% of the federal poverty line, percent of households receiving public assistance, and percent nonwhite race. We adjusted for year of conception because pollution levels and birth weight varied by year, and we considered adjustment for season and for month of conception in sensitivity analyses.
Statistical analysis
Associations between PM2.5, nitrogen dioxide, and birth weight
We estimated the associations between PM2.5, nitrogen dioxide, and birth weight by using linear mixed models with a random intercept for mother's census tract of residence. We considered exposure in the first trimester (weeks 1–12), second trimester (weeks 13–26), and third trimester (weeks 27 and onward) of pregnancy, as well as the average exposure over the entire pregnancy. For each exposure window and each pollutant (PM2.5 and nitrogen dioxide), we considered 3 models that included increasingly extensive sets of covariates, as follows: 1) unadjusted; 2) adjusted for all of the individual-level covariates described above, an indicator of socioeconomic status in the census tract, and a categorical variable for conception year (“routine adjustment model”); and 3) routine adjustment plus average temperature over the exposure window (“fully adjusted model”).
Sensitivity analyses
First, because the pollutants' association with birth weight may come from either temporal or spatial components of exposure, we examined the distinct contribution of each component with birth weight. More specifically, we considered exposure derived from the citywide temporal variation alone (the average pollutant concentrations from regulatory monitors during the entire pregnancy and during specific trimesters for each study birth) and exposure derived from spatial variation only (the estimated annual average pollutant concentrations from the NYCCAS spatial model based on the 300-m buffer from maternal address). Second, we considered adjusting PM2.5 and nitrogen dioxide for one another, recognizing that measurement accuracy and temporal versus spatial contributions vary for the 2 pollutants (“2-pollutant model”). Third, we investigated whether the pollutant–birth weight association was nonlinear by fitting penalized spline models (13, 14) for each exposure window and each pollutant. In contrast to our previous sensitivity analysis to adjust for seasonality, which used spline models with fixed degrees of freedom, the penalized spline model used here allows the data to determine the degree of smoothing in order to flexibly estimate the air pollutant–birth weight exposure-response function.
RESULTS
Descriptive statistics
The study population is ethnically diverse, covers a wide range of maternal age and educational levels, and includes few births of less than 2,500 g after restriction to term deliveries (Table 1). The interquartilve range for PM2.5 exposure (Figure 2) ranged from 2.5 µg/m3 for average exposure over the entire pregnancy to 3.3 µg/m3 in the first trimester, whereas the interquartile range for nitrogen dioxide ranged from 6.2 ppb for average exposure over the entire pregnancy to 8.0 ppb in both the first and second trimesters. For each pollutant, PM2.5 and nitrogen dioxide, higher exposure was correlated with slightly lower census tract–level social deprivation (Pearson's ρ was approximately −0.1 for each pollutant and each exposure window).
Table 1.
Demographic Characteristics, Periods of Conception, and Birth Weights of the Study Population, New York, New York, 2008–2010
| Characteristic | No. | % |
|---|---|---|
| Maternal age, years | ||
| <20 | 16,717 | 6.6 |
| 20–24 | 52,378 | 20.7 |
| 25–29 | 67,139 | 26.5 |
| 30–34 | 66,954 | 26.5 |
| 35–39 | 38,727 | 15.3 |
| ≥40 | 11,052 | 4.4 |
| Maternal ethnicity | ||
| Non-Hispanic white | 70,994 | 28.1 |
| Black | 54,201 | 21.4 |
| Hispanic | 85,117 | 33.7 |
| Asian | 37,261 | 14.7 |
| Other | 5,079 | 2.0 |
| Unknown | 315 | 0.1 |
| Maternal education, years | ||
| <9 | 20,577 | 8.1 |
| 9–11 | 44,250 | 17.5 |
| 12 | 60,378 | 23.9 |
| 13–15 | 55,233 | 21.8 |
| 16 | 41,316 | 16.3 |
| >16 | 31,213 | 12.3 |
| Parity | ||
| 0 | 117,937 | 46.6 |
| 1 | 74,638 | 29.5 |
| 2 | 34,210 | 13.5 |
| ≥3 | 26,182 | 10.4 |
| Season and year of conception | ||
| Summer 2007 (July–August) | 8,461 | 3.3 |
| Fall 2007 (September–November) | 24,615 | 9.7 |
| Winter 2007/2008 (December–February) | 25,211 | 10.0 |
| Spring 2008 (March–May) | 24,575 | 9.7 |
| Summer 2008 (June–August) | 24,002 | 9.5 |
| Fall 2008 (September–November) | 24,318 | 9.6 |
| Winter 2008/2009 (December–February) | 23,858 | 9.4 |
| Spring 2009 (March–May) | 23,697 | 9.4 |
| Summer 2009 (June–August) | 23,200 | 9.2 |
| Fall 2009 (September–November) | 23,791 | 9.4 |
| Winter 2009/2010 (December–February) | 23,973 | 9.5 |
| Spring 2010 (March) | 3,266 | 1.3 |
| Birth weight, g | ||
| <1,500 | 94 | 0.04 |
| 1,500–2,499 | 6,698 | 2.7 |
| 2,500–3,999 | 228,371 | 90.3 |
| ≥4,000 | 17,804 | 7.0 |
| Medicaid | ||
| No | 98,789 | 39.1 |
| Yes | 154,178 | 61.0 |
| Gestational age (clinical estimate), weeks | ||
| 37 | 20,496 | 8.1 |
| 38 | 46,720 | 18.5 |
| 39 | 87,358 | 34.5 |
| 40 | 74,848 | 29.6 |
| 41 | 21,798 | 8.6 |
| 42 | 1,747 | 0.7 |
Figure 2.
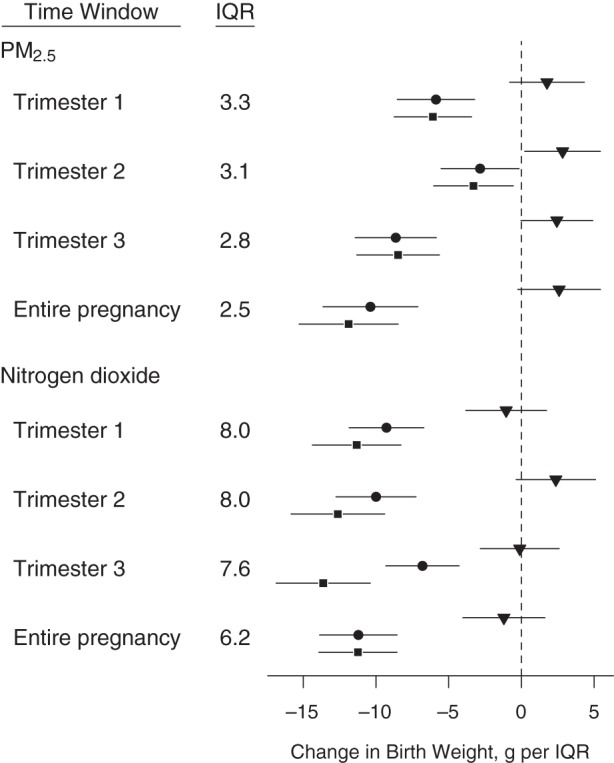
Change in birth weight in grams per interquartile range (IQR) of particulate matter with aerodynamic diameter less than 2.5 μm (PM2.5) and nitrogen dioxide with 95% confidence intervals for each exposure time window based on models with the following different degrees of confounder adjustment: unadjusted (triangles), routine adjustment (circles), and fully adjusted (squares), New York, New York, 2008–2010. Corresponding numerical values are in Web Table 1, available at http://aje.oxfordjournals.org/.
Because of seasonal patterns in air pollution in relationship to the duration of pregnancy, trimester-specific exposures are correlated to varying degrees (Table 2). The seasonality of PM2.5 is bimodal and peaks both in summer and winter (9), and adjacent pregnancy windows were less correlated than the first and third trimesters. In contrast, the seasonality of nitrogen dioxide is monomodal and peaks in winter (9), which leads to higher correlation between adjacent trimesters than between distant trimesters. The correlation (Pearson's ρ) between PM2.5 and nitrogen dioxide exposure was 0.63 within the first trimester, 0.59 within the second trimester, 0.53 within the third trimester, and 0.81 for the entire pregnancy.
Table 2.
Correlation (Pearson's ρ) Between Exposures for PM2.5 and Nitrogen Dioxide Within the Different Pregnancy Windows, New York, New York, 2008–2010
| Period of Exposure by Pollutant | Period of Exposure to PM2.5 |
Period of Exposure to Nitrogen Dioxide |
||||||
|---|---|---|---|---|---|---|---|---|
| First Trimester | Second Trimester | Third Trimester | All Pregnancy | First Trimester | Second Trimester | Third Trimester | All Pregnancy | |
| PM2.5 | ||||||||
| First trimester | 0.27 | 0.75 | 0.84 | 0.63 | 0.39 | 0.61 | 0.63 | |
| Second trimester | 0.27 | 0.66 | 0.58 | 0.59 | 0.40 | 0.60 | ||
| Third trimester | 0.85 | 0.62 | 0.62 | 0.53 | 0.69 | |||
| All pregnancy | 0.77 | 0.69 | 0.65 | 0.81 | ||||
| Nitrogen dioxide | ||||||||
| First trimester | 0.69 | 0.46 | 0.81 | |||||
| Second trimester | 0.67 | 0.92 | ||||||
| Third trimester | 0.84 | |||||||
| All pregnancy | ||||||||
Abbreviation: PM2.5, particulate matter with aerodynamic diameter less than 2.5 μm.
Statistical model of the associations between PM2.5, nitrogen dioxide, and birth weight
When we considered the covariates alone (Table 3), increasing gestational age was strongly predictive of increased birth weight, and children of black and Asian mothers, younger mothers, less educated mothers, and those who were born in later study years and in more socioeconomically deprived census tracts tended to have lower birth weights. Outdoor temperature and Medicaid status were essentially unrelated to birth weight after adjustment for the other covariates.
Table 3.
Coefficients for Covariates From the Fully Adjusted Model for Total Pregnancy Period, New York, New York, 2008–2010a
| Covariate | Birth Weight, g | 95% CI |
|---|---|---|
| Ethnicity | ||
| Black | −73.3 | −79.1, −67.5 |
| Hispanic | 0.7 | −4.7, 6.1 |
| Asian | −105.6 | −111.5, −99.7 |
| Other | −55.8 | −67.7, −43.8 |
| Unknown | −52.7 | −98.6, −6.8 |
| Age, years | ||
| 20–24 | 31.1 | 23.6, 38.6 |
| 25–29 | 70.9 | 63.3, 78.6 |
| 30–34 | 93.6 | 85.6, 101.7 |
| 35–39 | 107.2 | 98.5, 115.9 |
| ≥40 | 98.9 | 88.0, 109.8 |
| Education, years | ||
| 9–11 | 8.8 | 1.8, 15.8 |
| 12 | 12.8 | 6.0, 19.6 |
| 13–15 | 29.0 | 22.0, 36 |
| 16 | 25.6 | 17.6, 33.6 |
| >16 | 23.7 | 15.0, 32.4 |
| Parity | ||
| 1 | 73.4 | 69.4, 77.3 |
| 2 | 86.4 | 81.0, 91.8 |
| ≥3 | 88.5 | 82.1, 94.9 |
| Has Medicaid | ||
| Yes | 3.3 | −0.9, 7.6 |
| Gestational age, weeks | ||
| 38 | 198.1 | 191.3, 204.9 |
| 39 | 348.0 | 341.7, 354.3 |
| 40 | 456.2 | 449.8, 462.6 |
| 41 | 590.8 | 582.8, 598.7 |
| 42 | 655.2 | 634.9, 675.5 |
| Census tract SDIb | −3.8 | −6.3, −1.3 |
| Conception year | ||
| 2008 | −13.6 | −19.2, −8.0 |
| 2009 | −20.5 | −27.6, −13.4 |
| 2010 | −33.1 | −43.7, −22.4 |
| Temperature per 10° Fc | −0.1 | −5.8, 5.5 |
Abbreviations: CI, confidence interval; SDI, social deprivation index.
a Reference categories are as follows: ethnicity, white; age, <20 years; education, <9 years; parity, 0; has Medicaid, no; and conception year, 2007.
b SDI was adapted from the approach of Messer et al. (12), using principal components analysis to derive a composite index, which included the following 7 contextual variables: percent with college degree, percent unemployment, percent management/professional occupation, percent residential crowding, percent below 200% of the federal poverty line, percent of households receiving public assistance, and percent nonwhite race.
c Average outdoor temperature over the exposure window.
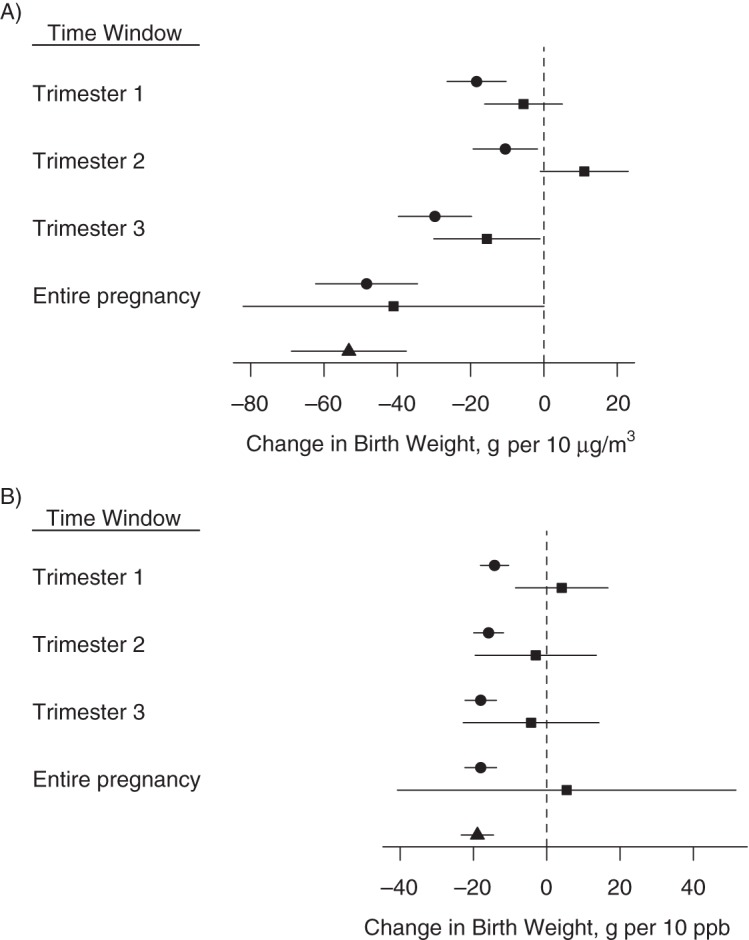
Figure 2 shows the estimated association between exposures to PM2.5 and nitrogen dioxide and birth weight per IQR (Web Table 1, available at http://aje.oxfordjournals.org/, provides the corresponding values). Results are expressed as grams of birth weight per 10-unit change in air pollutant exposure (10 µg/m3 for PM2.5 or 10 ppb for nitrogen dioxide) (Figure 3), as well as per interquartile range change in air pollutant exposure. Before covariate adjustment, pollutant exposure and birth weight were essentially unrelated for nitrogen dioxide and had weakly positive coefficients for PM2.5 across exposure windows. Adjustment had a substantial impact, primarily due to higher levels of exposure and higher birth weights among non-Hispanic whites, among older mothers, and in earlier calendar years. With or without adjustment for temperature, results indicated that higher PM2.5 and nitrogen dioxide exposures in all pregnancy windows were associated with lower birth weights. Among the trimester-specific exposure windows, for PM2.5, the strongest associations occurred in the first and third trimesters; for nitrogen dioxide, there was a less notable difference in the estimated associations across exposure windows.
Figure 3.

Change in birth weight in grams A) per 10 μg/m3 of particulate matter with aerodynamic diameter less than 2.5 μm, and B) per 10 ppb of nitrogen dioxide with 95% confidence intervals for each exposure time window based on models with the following 3 degrees of confounder adjustment: unadjusted (triangles), routine adjustment (circles), and fully adjusted (squares), New York, New York, 2008–2010. Corresponding numerical values are in Web Table 1, available at http://aje.oxfordjournals.org/.
Sensitivity analyses
Figure 4 compares estimates of the association between pollutant exposure and birth weight, where exposure was assigned based solely on either temporal or spatial variation to estimates from our primary analysis (Figure 3) where exposure was assigned based on both sources of variation (Web Table 2). To aid in the interpretation of health-effect estimates associated with exposures with different degrees of variability, Web Figure 1 shows box plots of the spatial and temporal components for PM2.5 and nitrogen dioxide. Whereas for nitrogen dioxide, the spatial component exhibited greater variability than the temporal component, for PM2.5 the temporal component was more variable. For PM2.5, the associations based on both sources of variation in exposure lie between the estimates based on only spatial or only temporal variation, suggesting that both sources of variability contribute to the PM2.5 associations. On the other hand, for nitrogen dioxide, the estimates based on both temporal and spatial variation are nearly identical to the estimates based on spatial variation only, providing evidence that the association between nitrogen dioxide and birth weight is driven almost completely by the variation in exposure across mothers' residences and not over time.
Figure 4.
Change in birth weight in grams A) per 10 μg/m3 of particulate matter with aerodynamic diameter less than 2.5 μm, and B) per 10 ppb of nitrogen dioxide with 95% confidence intervals for each exposure time window based on the fully adjusted model for the following 3 exposure metrics: temporal variation only (squares), spatial variation only (triangles), and combined temporal and spatial variation (circles), New York, New York, 2008–2010. Corresponding numerical values are in Web Table 1, available at http://aje.oxfordjournals.org/, (combined temporal and spatial variation) and Web Table 2 (temporal variation only and spatial variation only).
When we adjusted the pollutants for one another (2-pollutant model), higher nitrogen dioxide remained independently associated with lower birth weight, whereas PM2.5 was no longer associated with birth weight (except for during the second trimester, in which higher exposure was associated with higher birth weight) (Figure 5).
Figure 5.
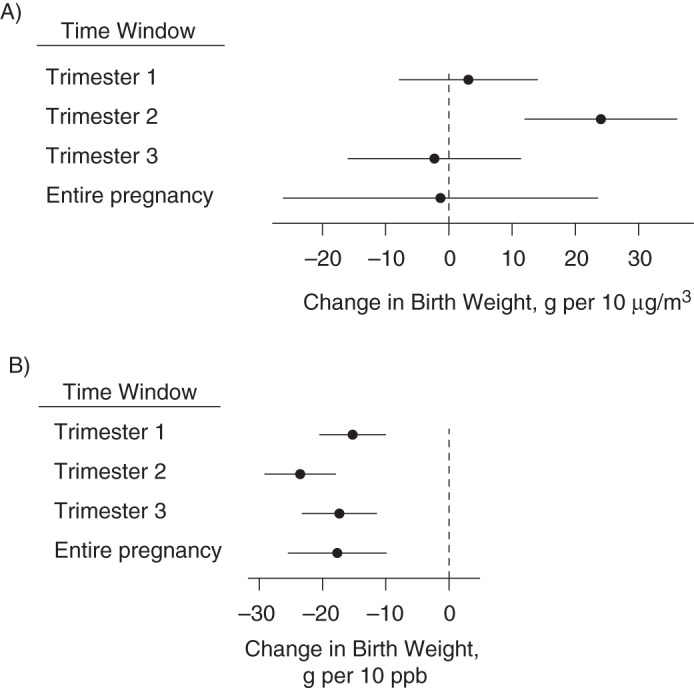
Change in birth weight in grams A) per 10 μg/m3 of particulate matter with aerodynamic diameter less than 2.5 μm, and B) per 10 ppb of nitrogen dioxide with 95% confidence intervals for each exposure time window based on the 2-pollutant model, New York, New York, 2008–2010. Corresponding numerical values are in Web Table 3, available at http://aje.oxfordjournals.org/.
In sensitivity analyses allowing for a potential nonlinear exposure-response relationship, PM2.5 exhibited no evidence of a nonlinear relationship with birth weight for any of the exposure windows (Web Figure 2). For average nitrogen dioxide exposure over the study period, birth weights decreased with increasing levels of exposure until approximately 20 ppb, after which they leveled off and remained flat until approximately 35 ppb and then continued to decrease over the remaining range of the data (Web Figure 2). The form of the exposure-response function was similar for the other time windows of nitrogen dioxide exposure.
DISCUSSION
Our finding of a relationship between both PM2.5 and nitrogen dioxide in relation to birth weight is consistent with those of some other studies but somewhat greater in magnitude than has typically been reported (2). For comparison, the estimates based on absolute change (per 10 µg/m3 for PM2.5 or per 10 ppb for nitrogen dioxide) are most readily compared, because the exposure ranges across studies, and thus the effects of interquartile shifts, are not comparable. Our estimated birth weight effects of PM2.5 of approximately 20 g for first-trimester exposure, 30 g for third-trimester exposure, and 40 g for total pregnancy exposure per 10 µg/m3 are broadly in the range observed in some studies (15–20) and much greater than was found in other studies (21–25).
Our findings for nitrogen dioxide suggest a birth weight reduction of approximately 18 g per 10 ppb for exposure in the first or third trimester and for the total pregnancy. These estimates are broadly comparable to some studies (16, 24, 26–28), much greater than those found in others (8, 29, 30), and markedly weaker than a large but imprecise estimate reported in Valencia, Spain (31).
Some of the differences in estimated effect sizes across studies could be due to the exposure assignment methods used and their spatial resolutions. For example, Kloog et al. (25) estimated PM2.5 exposure on the basis of aerosol optical depth at a 10-km spatial resolution. Our study incorporated information about local emission sources to estimate exposure within 300 m of the maternal address. Among the candidate explanations besides exposure assignment accuracy are particle composition and toxicity, contributions from spatial and temporal variations in pollution, exact definition of the birth weight measure, exclusions, covariates used in adjustment, varying susceptibility to socioeconomic confounding, and analytical methods. The most distinctive features of our study, which potentially resulted in somewhat stronger effects, are the enhanced exposure assessment (i.e., high spatial resolution) from NYCCAS and restriction of the study population to those individuals and outcome measures most purely indicative of growth, excluding births in which pathology caused a reduction in size (e.g., preterm births or congenital defects). On the other hand, the more modest and irregular association of air pollution and socioeconomic status and the exclusion of smokers may well reduce apparent effect size to the extent that incomplete adjustment has affected other studies. A systematic evidence review, which is beyond the scope of this paper, would be needed to draw inferences about which of the many variables related to study setting and design may be responsible for variable findings across studies.
A major concern for studies of pregnancy is the distinctive contributions of spatial and temporal variations in exposure. A recent multicountry meta-analysis found that studies using temporal assignment found stronger inverse associations of particulate matter and birth weight (32). However, given that the quality of exposure assignment based on these 2 determinants likely differs, and the susceptibility to confounding clearly differs, the observed patterns are not easily interpreted. Comparable effect sizes for the 2 sources for PM2.5 might suggest a causal effect (assuming that mass concentration is the biologically relevant measure of exposure), in that it is highly unlikely that both indices would be confounded by other factors. The isolation of nitrogen dioxide associations to spatial, not temporal, variation may support either a true effect that reflects the more accurate indicators of spatial variation or confounding of 1 or both of the measures. This spatial/temporal distinction is embedded in our attempts to examine mutually adjusted results and makes the predominance of nitrogen dioxide over PM2.5 of uncertain significance.
In this study, we examined only the association with PM2.5 mass concentration, whereas the toxicity of PM2.5 and its effect on a range of health outcomes including birth weight may be modified by its chemical composition, which is related to sources. For example, Bell et al. (23) found that the concentrations of zinc, elemental carbon, silicon, aluminum, vanadium, and nickel were associated with lower birth weight in selected Massachusetts and Connecticut communities, and numerous studies suggest effect modification of cardiovascular and other outcomes by PM2.5 composition (33). Nitrogen dioxide, which is less influenced by regional sources and has greater spatial variation within New York than does PM2.5 (5), may be a surrogate for local combustion sources, such as traffic or residual oil combustion, that contribute to spatial variation in PM2.5 mass (10) and composition within the city. In future studies, we plan to apply PM2.5 chemical speciation data from NYCCAS to develop exposure metrics and assess the association of spatial source and PM2.5 composition differences on birth outcomes. Other pollutants of concern (e.g., carbon monoxide, which was not measured in NYCCAS) were not addressed, and we did not incorporate information on particle constituents in this analysis, but plan to do so later.
As in other studies of this nature, our exposure estimates were limited to the location of the maternal residence, not considering variability due to work and other activities and the nature of housing as it affects indoor/outdoor gradients (which may be especially problematic in New York given the variable height of apartment buildings). Potential confounders that we were not able to address include noise and environmental tobacco smoke. In addition, we know from unpublished analyses of New York City Pregnancy Risk Assessment Monitoring System data that smoking during pregnancy is underreported on birth certificates in New York, as has been previously reported for multiple states (34). Additional limitations include the inability to account for repeat births to the same mother, slightly understating the variance of effect estimates, and the lack of residential history information other than the birth address. There are many potential influences on fetal growth, with only some pathways vulnerable to the adverse effects of air pollution, and we were not able to refine the outcome to isolate those most plausibly affected by eliminating those with known complications affecting fetal growth.
In this large and rapidly expanding research avenue, our results add support to the possible impact of common air pollutants, specifically PM2.5 and nitrogen dioxide, on fetal growth. Although the magnitude of estimated change in birth weight is clinically inconsequential for a given infant, there may be health consequences to a shift in the population birth weight distribution with regard to both near-term health outcomes (e.g., hospital stay, survival) and long-term consequences (e.g., neurodevelopment, cardiovascular risk markers). Additional analyses are needed to determine whether the predicted impacts of a small shift in birth weight on morbidity are identifiable, which are feasible for outcomes such as neonatal intensive care unit admissions and respiratory distress. Careful examination of specific indicators of fetal and infant health is needed, along with refined pollution assessment that considers temporal and spatial contributors, chemical speciation of particulates, and evaluation of pollutant sources. Although the signal relating air pollution to reproductive health is difficult to discern, there is ample encouragement to take the next steps to refine our understanding of its presence and meaning.
Supplementary Material
ACKNOWLEDGMENTS
Author affiliations: Department of Epidemiology, Brown University, Providence, Rhode Island (David A. Savitz, Beth Elston); Department of Obstetrics and Gynecology, Brown University, Providence, Rhode Island (David A. Savitz); Department of Biostatistics, Harvard School of Public Health, Boston, Massachusetts (Jennifer F. Bobb, Francesca Dominici); Department of Environmental Health Sciences, University of Pittsburgh Graduate School of Public Health, Pittsburgh, Pennsylvania (Jessie L. Carr, Jane E. Clougherty); New York City Department of Health and Mental Hygiene, Bureau of Environmental Surveillance and Policy, New York, New York (Kazuhiko Ito, Michelle Yee, Thomas D. Matte); and ZevRoss Spatial Analysis, Ithaca, New York (Zev Ross).
This research was supported by the National Institute of Environmental Health Sciences (grant 1R01ES019955-01 to Brown University).
Conflict of interest: none declared.
REFERENCES
- 1.Shah PS, Balkhair T. Air pollution and birth outcomes: a systematic review. Environ Int. 2011;37(2):498–516. doi: 10.1016/j.envint.2010.10.009. [DOI] [PubMed] [Google Scholar]
- 2.Sapkota A, Chelikowsky AP, Nachman KE, et al. Exposure to particulate matter and adverse birth outcomes: a comprehensive review and meta-analysis. Air Qual Atmos Health. 2012;5(4):369–381. [Google Scholar]
- 3.Woodruff TJ, Parker JD, Darrow LA, et al. Methodological issues in studies of air pollution and reproductive health. Environ Res. 2009;109(3):311–320. doi: 10.1016/j.envres.2008.12.012. [DOI] [PMC free article] [PubMed] [Google Scholar]
- 4.Sram RJ, Binkova B, Dejmek J, et al. Ambient air pollution and pregnancy outcomes: a review of the literature. Environ Health Perspect. 2005;113(4):375–382. doi: 10.1289/ehp.6362. [DOI] [PMC free article] [PubMed] [Google Scholar]
- 5.Matte TD, Ross Z, Kheirbek I, et al. Monitoring intra-urban spatial patterns of multiple combustion air pollutants in New York City: design and implementation. J Expo Sci Environ Epidemiol. 2013;23(3):223–231. doi: 10.1038/jes.2012.126. [DOI] [PubMed] [Google Scholar]
- 6.Strand LB, Barnett AG, Tong S. Methodological challenges when estimating the effects of season and seasonal exposures on birth outcomes. BMC Med Res Methodol. 2011;11:49–57. doi: 10.1186/1471-2288-11-49. [DOI] [PMC free article] [PubMed] [Google Scholar]
- 7.Slama R, Morgenstern V, Cyrys J, et al. Traffic-related atmospheric pollutant levels during pregnancy and offspring's term birth weight: a study relying on a land-use regression exposure model. Environ Health Perspect. 2007;115(9):1283–1292. doi: 10.1289/ehp.10047. [DOI] [PMC free article] [PubMed] [Google Scholar]
- 8.Gehring U, Wijga AH, Fischer P, et al. Traffic-related air pollution, preterm birth and term birth weight in the PIAMA birth cohort study. Environ Res. 2011;111(1):125–135. doi: 10.1016/j.envres.2010.10.004. [DOI] [PubMed] [Google Scholar]
- 9.Ross Z, Ito K, Johnson S, et al. Spatial and temporal estimation of air pollutants in New York City: exposure assignment for use in a birth outcomes study. Environ Health. 2013;12:51. doi: 10.1186/1476-069X-12-51. [DOI] [PMC free article] [PubMed] [Google Scholar]
- 10.Clougherty JE, Kheirbek I, Eisl HM, et al. Intra-urban spatial variability in wintertime street-level concentrations of multiple combustion-related air pollutants: the New York City Community Air Survey (NYCCAS) J Expo Sci Environ Epidemiol. 2013;23(3):232–240. doi: 10.1038/jes.2012.125. [DOI] [PubMed] [Google Scholar]
- 11.Waller L, Gotway C. Applied Spatial Statistics for Public Health Data. Hoboken, NJ: John Wiley & Sons, Inc; 2004. [Google Scholar]
- 12.Messer LC, Laraia BA, Kaufman JS, et al. The development of a standardized neighborhood deprivation index. J Urban Health. 2006;83(6):1041–1061. doi: 10.1007/s11524-006-9094-x. [DOI] [PMC free article] [PubMed] [Google Scholar]
- 13.Wood SN. Thin plate regression splines. J R Stat Soc B. 2003;65(1):95–114. [Google Scholar]
- 14.Wood SN. Generalized Additive Models: An Introduction With R. Boca Raton, FL: CRC Press; 2006. [Google Scholar]
- 15.Basu R, Woodruff TJ, Parker JD, et al. Comparing exposure metrics in the relationship between PM2.5 and birth weight in California. J Expo Anal Environ Epidemiol. 2004;14(5):391–396. doi: 10.1038/sj.jea.7500336. [DOI] [PubMed] [Google Scholar]
- 16.Bell ML, Ebisu K, Belanger K. Ambient air pollution and low birth weight in Connecticut and Massachusetts. Environ Health Perspect. 2007;115(7):1118–1124. doi: 10.1289/ehp.9759. [DOI] [PMC free article] [PubMed] [Google Scholar]
- 17.Jedrychowski W, Bendkowska I, Flak E, et al. Estimated risk for altered fetal growth resulting from exposure to fine particles during pregnancy: an epidemiologic prospective cohort study in Poland. Environ Health Perspect. 2004;112(14):1398–1402. doi: 10.1289/ehp.7065. [DOI] [PMC free article] [PubMed] [Google Scholar]
- 18.Jedrychowski W, Perera F, Mrozek-Budzyn D, et al. Gender differences in fetal growth of newborns exposed prenatally to airborne fine particulate matter. Environ Res. 2009;109(4):447–456. doi: 10.1016/j.envres.2009.01.009. [DOI] [PMC free article] [PubMed] [Google Scholar]
- 19.Madsen C, Gehring U, Walker SE, et al. Ambient air pollution exposure, residential mobility and term birth weight in Oslo, Norway. Environ Res. 2010;110(4):363–371. doi: 10.1016/j.envres.2010.02.005. [DOI] [PubMed] [Google Scholar]
- 20.Gray SC, Edwards SE, Miranda ML. Assessing exposure metrics for PM and birthweight models. J Expo Sci Environ Epidemiol. 2010;20(5):469–477. doi: 10.1038/jes.2009.52. [DOI] [PMC free article] [PubMed] [Google Scholar]
- 21.Mannes T, Jalaludin B, Morgan G, et al. Impact of ambient air pollution on birth weight in Sydney, Australia. Occup Environ Med. 2005;62(8):524–530. doi: 10.1136/oem.2004.014282. [DOI] [PMC free article] [PubMed] [Google Scholar]
- 22.Morello-Frosch R, Jesdale BM, Sadd JL, et al. Ambient air pollution exposure and full-term birth weight in California. Environ Health. 2010;9:44–57. doi: 10.1186/1476-069X-9-44. [DOI] [PMC free article] [PubMed] [Google Scholar]
- 23.Bell ML, Belanger K, Ebisu K, et al. Prenatal exposure to fine particulate matter and birth weight: variations by particulate constituents and sources. Epidemiology. 2010;21(6):884–891. doi: 10.1097/EDE.0b013e3181f2f405. [DOI] [PMC free article] [PubMed] [Google Scholar]
- 24.Darrow LA, Klein M, Strickland MJ, et al. Ambient air pollution and birth weight in full-term infants in Atlanta, 1994–2004. Environ Health Perspect. 2011;119(5):731–737. doi: 10.1289/ehp.1002785. [DOI] [PMC free article] [PubMed] [Google Scholar]
- 25.Kloog I, Melly SJ, Ridgway WL, et al. Using new satellite based exposure methods to study the association between pregnancy PM2.5 exposure, premature birth and birth weight in Massachusetts. Environ Health. 2012;11:40. doi: 10.1186/1476-069X-11-40. [DOI] [PMC free article] [PubMed] [Google Scholar]
- 26.Salam MT, Millstein J, Li YF, et al. Birth outcomes and prenatal exposure to ozone, carbon monoxide, and particulate matter: results from the Children's Health Study. Environ Health Perspect. 2005;113(11):1638–1644. doi: 10.1289/ehp.8111. [DOI] [PMC free article] [PubMed] [Google Scholar]
- 27.Estarlich M, Ballester F, Aguilera I, et al. Residential exposure to outdoor air pollution during pregnancy and anthropometric measures at birth in a multicenter cohort in Spain. Environ Health Perspect. 2011;119(9):1333–1338. doi: 10.1289/ehp.1002918. [DOI] [PMC free article] [PubMed] [Google Scholar]
- 28.van den Hooven EH, Pierik FH, de Kluizenaar Y, et al. Air pollution exposure during pregnancy, ultrasound measures of fetal growth, and adverse birth outcomes: a prospective cohort study. Environ Health Perspect. 2012;120(1):150–156. doi: 10.1289/ehp.1003316. [DOI] [PMC free article] [PubMed] [Google Scholar]
- 29.Gouveia N, Bremner SA, Novaes HMD. Association between ambient air pollution and birth weight in Sao Paulo, Brazil. J Epidemiol Community Health. 2004;58(1): 11–17. doi: 10.1136/jech.58.1.11. [DOI] [PMC free article] [PubMed] [Google Scholar]
- 30.Aguilera I, Garcia-Esteban R, Iniguez C, et al. Prenatal exposure to traffic-related air pollution and ultrasound measures of fetal growth in the IMMA Sabadell Cohort. Environ Health Perspect. 2010;118(5):705–711. doi: 10.1289/ehp.0901228. [DOI] [PMC free article] [PubMed] [Google Scholar]
- 31.Ballester F, Estarlich M, Iniguez C, et al. Air pollution exposure during pregnancy and reduced birth size: a prospective birth cohort study in Valencia, Spain. Environ Health. 2010;9:6–17. doi: 10.1186/1476-069X-9-6. [DOI] [PMC free article] [PubMed] [Google Scholar]
- 32.Dadvand P, Parker J, Bell ML, et al. Maternal exposure to particulate air pollution and term birth weight: a multi-country evaluation of effect and heterogeneity. Environ Health Perspect. 2013;121(3):367–373. doi: 10.1289/ehp.1205575. [DOI] [PMC free article] [PubMed] [Google Scholar]
- 33.Bell ML HEI Health Review Committee. Assessment of the health impacts of particulate matter characteristics. Res Rep Health Eff Inst. 2012;(161):5–38. [PubMed] [Google Scholar]
- 34.Allen AM, Dietz PM, Tong VT, et al. Prenatal smoking prevalence ascertained from two population-based data sources: birth certificates and PRAMS questionnaires, 2004. Public Health Rep. 2008;123(5):586–592. doi: 10.1177/003335490812300508. [DOI] [PMC free article] [PubMed] [Google Scholar]
Associated Data
This section collects any data citations, data availability statements, or supplementary materials included in this article.