Abstract
Diffusion tensor imaging (DTI) and functional magnetic resonance imaging (fMRI) have been widely used to study structural and functional brain connectivity in recent years. A common assumption used in many previous functional brain connectivity studies is the temporal stationarity. However, accumulating literature evidence has suggested that functional brain connectivity is under temporal dynamic changes in different time scales. In this paper, a novel and intuitive approach is proposed to model and detect dynamic changes of functional brain states based on multimodal fMRI/DTI data. The basic idea is that functional connectivity patterns of all fiber-connected cortical voxels are concatenated into a descriptive functional feature vector to represent the brain’s state, and the temporal change points of brain states are decided by detecting the abrupt changes of the functional vector patterns via the sliding window approach. Our extensive experimental results have shown that meaningful brain state change points can be detected in task-based fMRI/DTI, resting state fMRI/DTI, and natural stimulus fMRI/DTI data sets. Particularly, the detected change points of functional brain states in task-based fMRI corresponded well to the external stimulus paradigm administered to the participating subjects, thus partially validating the proposed brain state change detection approach. The work in this paper provides novel perspective on the dynamic behaviors of functional brain connectivity and offers a starting point for future elucidation of the complex patterns of functional brain interactions and dynamics.
Keywords: brain connectivity, diffusion tensor imaging, functional MRI, brain state change
1. Introduction
Studying structural and functional connectivity in brain networks has received increasingly strong interest recently due to its significant importance in basic and clinical neurosciences (e.g., Friston et al., 2003; Sporns et al., 2005; Biswal 2010; Van Dijk et al., 2010; Lynall et al., 2010; Kennedy, 2010; Hagmann et al., 2010; Li et al., 2012). A common assumption used in many previous functional brain connectivity studies (e.g., Wang et al., 2006; Dickerson and Sperling, 2009; Lynall et al., 2010; Liu 2011) is the temporal stationarity; that is, functional connectivity are computed over the entire fMRI scan and used to characterize the strengths of connections across regions. However, accumulating literature evidence (e.g., Lindquist et al., 2007; Robinson et al., 2010; Chang and Glover, 2010), including our own recent studies (Lim et al., 2011; Hu et al., 2011b; Li et al., 2011), have shown that functional connectivity are under dynamic changes at different time scales. In particular, extensive neuroscience research suggests that the function of any area of the cortex is subject to top-down influences of attention, expectation, and perceptual task (Gilbert and Sigman, 2007; Bassett et al., 2011). For instance, each cortical area runs different “programs” according to the context and to the current perceptual requirements (Gilbert and Sigman, 2007), and dynamic functional interactions between structural connections mediate the moment-by-moment functional switching in the brain (Gilbert and Sigman, 2007). Even in the resting state, functional brain connectivity is still under dynamic changes within time scales of seconds to minutes (Chang and Glover, 2010). Therefore, we are strongly motivated to examine the temporal dynamics of functional connectivity in resting state (e.g., Fox and Raichle 2007), during task performance (e.g., Faraco, et al., 2011), and under natural stimulus of movie watching (e.g., Hu et al., 2011) in this paper.
In the literature, there have been a variety of studies that investigate the problem of temporal brain state changes from different perspectives. For instance, from the fMRI blood-oxygen-level dependence (BOLD) signal processing perspective, statistical signal processing methods have been applied on fMRI signals to detect BOLD signal state change in response to stimulus (e.g., Lindquist et al., 2007; Robinson et al., 2010), and these results have been correlated to brain state change. From the brain network perspective, functional networks have been reported to form and disappear during certain tasks, and the temporal clustering analysis (TCA) approach has been developed to detect the dynamic behavior of brain states (e.g., Gao and Yee, 2003; Morgan et al., 2004). It has been observed that the brain state change is a dynamical process of functional brain connectivity, e.g., even at resting state (Chang and Glover, 2010). Recently, signal propagation from changing networks within rats and human brains was discussed in (Majeed et al., 2011). In addition, brain state change has been studied from a sensory processing perspective, in which the brain is assumed to go through a succession of states when performing a task, with each state serving as the source of top-down influences for the subsequent states (Gilbert and Sigman, 2007). More recently, Bassett et al., 2011 examined the dynamic changes of brain networks at the temporal scales of days, hours, and minutes in a learning paradigm, and found that modular network organization changed smoothly over short temporal scales.
The work reported in this paper is along the direction of network-based brain state change detection. That is, we model and determine functional brain state change points by identifying abrupt alterations of functional connectivity in large-scale brain networks. Our rationale is that the brain function is integrated via large-scale structural and functional connectivity (e.g., Sporns et al., 2005; Honey et al., 2009; Biswal et al., 2010; Hagmann et al., 2010; Kennedy, 2010; Van Dijk et al., 2010), and that sudden change of global functional brain connectivity is a meaningful and effective indicator of functional brain state switch. Therefore, in this study, the functional brain state is defined as the specific organizational pattern of the brain’s global functional connectivity (Zalesky et al., 2010), and brain state changes are hypothesized to reflect the brain’s functional interaction dynamics in response to external/internal stimulus and/or previous brain states. In comparison with many previous approaches that modeled static functional brain connectivity (e.g., Wang et al., 2006; Dickerson and Sperling, 2009; Liu 2011), quantitative characterization and visualization of these time-dependent dynamics on functional networks can possibly elucidate important temporal attributes of functional connectivity that cannot be seen by traditional static network connectivity analysis. Hence, in this paper, we adopted a network-based approach (Bullmore and Sporns, 2009) and utilized global functional connectivity patterns defined based on DTI-derived structural connections to represent the brain’s functional states.
In general, a prerequisite step for static or dynamic functional brain connectivity study is to determine the network node ROIs (regions of interests), which can be determined by manual delineation (Amunts et al., 2000; Dickerson and Sperling, 2009; Biswal et al., 2010), image registration (Thompson and Toga, 1996; Shen and Davatzikos, 2002; Avants et al., 2008; Liu et al., 2011), task-based fMRI (Saxe et al., 2006; Faraco, et al., 2011; Zhu et al., 2011), or by data-driven clustering, such as regional homogeneity (ReHo) measurement (Zang et al., 2004) and independent component analysis (ICA) (Calhoun et al., 2004; Beckmann et al., 2005). Then functional connectivity between network node ROIs can be calculated by measuring the correlation of the time courses of their representative fMRI signals. Alternatively, people may identify ROIs and their connectivity simultaneously by data-driven models such as the independent component analysis (ICA)-based method (Tsunoda et al., 2001; Calhoun et al., 2004; Beckmann et al., 2005). In this paper, we propose a novel fiber-centered approach to defining functional connectivity on DTI-derived white matter fibers. Our basic premise is that axonal fibers obtained from DTI tractography are the structural substrates of functional connectivity between brain regions (e.g., Honey et al., 2009; Zhu et al., 2011; Li et al., 2012), and thus provide a natural anatomical localization for inference of functional connectivity. In our approach, the functional connectivity is defined as the temporal correlation between spatially remote fMRI signals extracted from gray matter voxels on the two terminals of a DTI-derived axonal fiber. That is, we measure the temporal correlation of fMRI time series of two ends of a fiber (Lv et al., 2010; Lim et al., 2011) to define the functional connectivity between the gray matter voxels that it connects. The functional connectivity patterns of all of the DTI-derived white matter fibers within the whole brain are then concatenated into a descriptive functional feature vector to represent the brain’s state, called functional connectivity vector (FCV). The functional brain state change points are then determined by the abrupt changes of the FCV patterns calculated by the sliding window approach along the time series.
Based on the above premises regarding structural and functional brain connectivity, as well as the concept of dynamic brain state change, we employed the FCV model to characterize and describe the dynamics of functional brain states based on multimodal DTI/fMRI data. We have applied the FCV models on task-based fMRI (Faraco, et al., 2011; Zhu et al., 2011), resting state fMRI (Li et al., 2010), and natural stimulus fMRI data sets (Hu et al., 2011), and meaningful and promising results were obtained. In particular, our results have shown that the functional brain state change curve roughly follows the external stimulus paradigm used in task-based fMRI (Faraco, et al., 2011; Zhu et al., 2011), which partially validates our approach in that our algorithmic pipeline is totally data-driven and no a priori knowledge was used in the analysis. Our major contributions in this paper are summarized in the following three statements. First, we developed, validated and applied a novel fiber-centered approach to defining the functional connectivity pattern in the human brain, and proposed the FCV pattern to represent a functional brain state. From a neuroscience perspective, structural and functional brain connectivity are closely related (e.g., Passingham et al., 2002; Honey et al., 2009; Zhu et al., 2011; Li et al., 2012). As suggested in Passingham et al., 2002, the fucntions of different brain areas are largely determined by the extrinsic and intrinsic structural connections among these areas. Thus it is reasonable to define fiber-centered functional connectivity. Second, instead of using raw fMRI BOLD signals, we use the FCV pattern that measures and represents the whole-brain functional connectivity of fibers for brain state change detection. Rooted in structural connections, this FCV-based representation of the large-scale functional interaction pattern can, potentially, faithfully reflect the working status of the brain in the resting state, during task performance or under a natural stimulus. Our experimental results have suggested that the FCV pattern effectively represents the functional interaction and dynamics on structural brain networks and is a good indicator of brain state. Third, the work in this paper provides novel understanding of and perspective on the dynamic behaviors of functional brain connectivity, which cannot be seen in traditional static connectivity analysis, and offers a starting point for in-depth elucidation of the complex patterns of large-scale functional brain interactions and their dynamics in the future.
It should be noted that an early short version of this methodology was presented of the ISBI 2011 conference (Lim et al., 2011). The major extensions on this paper include the expansion of the introduction and literature review, additional details on the methodology, extended experiments and result interpretation, comparison with other methods, applications to three types of fMRI data sets, and extensive discussion.
2. Materials and Methods
2.1. Overview
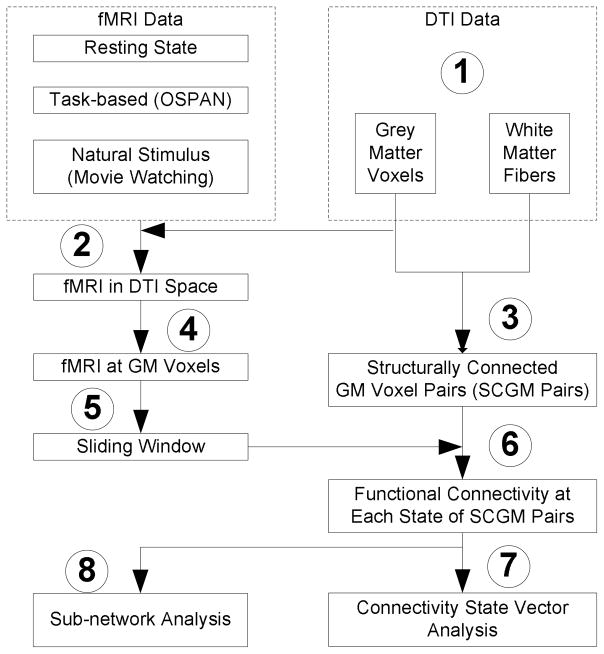
As summarized in Figure 1, the proposed computational pipeline is composed of eight steps. Briefly, after brain tissue segmentation (gray matter (GM) and white matter (WM)) via the approaches in (Liu et al., 2007) and DTI fiber tractography (MEDINRIA http://www-sop.inria.fr/asclepios/software/MedINRIA/) in the DTI image space (Step 1), we warped fMRI images to the DTI space via the FSL FLIRT image registration toolkit (Step 2). Then, structurally-connected GM (SCGM) voxel pairs were identified from the two ends of a DTI-derived fiber (Step 3), and corresponding fMRI signals were extracted at both SCGM voxels located on the gray matter (Step 4). Afterwards, we applied a sliding window approach to the extracted fMRI time series signals (Step 5) and the functional connectivity was then calculated for each SCGM within a sliding window (Step 6). Afterwards, all of these functional connectivity were concatenated into a functional connectivity vector (FCV) for each sliding window (Step 7), based on which the brain state change points were identified. In addition to the whole-brain functional state change detection, sub-network analysis of fiber-centered functional connectivity dynamics was also examined (Step 8). This computational pipeline has been applied and tested in three types of fMRI data sets including resting state fMRI data (Li et al., 2010), task-based fMRI data (Faraco, et al., 2011; Zhu et al., 2011), and natural stimulus fMRI data (Hu et al., 2011), and DTI images are available for each of these fMRI data sets.
Figure 1.
The flowchart of the algorithmic pipeline for fiber-centered brain state change detection. Eight steps are labeled as follows. (1) brain tissue segmentation (gray matter (GM) and white matter (WM)) and fiber tractography using DTI data; (2) warping fMRI images to the DTI space via image registration; (3) identification of structurally-connected GM (SCGM) voxel pairs; (4) fMRI signal extraction at each SCGM voxel pair; (5) applying sliding windows to fMRI signals; (6) functional connectivity analysis for each SCGM voxel pair within the sliding window; (7) functional connectivity vector (FCV) construction for each sliding window; (8) Sub-network analysis of fiber-centered functional connectivity dynamics.
Notably, there are two key methodological novelties in the above computational pipeline. First, we used DTI-derived white matter fibers to guide the identification of meaningful functional connectivity between gray matter voxels, and thus the brain’s functional status and its dynamics are represented by the functional connectivity of SCGMs. This structural connection based constraint significantly reduces the number of possible functional connectivity measurements from O(n2), n being the total number of gray matter voxels, to O(m), m being the total number of fibers. This meaningful and effective search space reduction enables quantitative representation of the whole-brain functional state. Second, we used a dynamic sliding window approach to obtain temporal transitions of functional brain connectivity, rather than analyzing the static correlation between the entire time series of two regions (Li et al., 2010; Lv et al., 2010; Lynall et al., 2010). As a result, the temporally dynamic nature of functional brain networks can be captured and characterized. In particular, the results of our FCV model from task-based fMRI data have been compared with the external task stimulus curve for validation, and the detected functional brain state change points were well temporally aligned with stimulus inputs.
2.2. Data acquisition and preprocessing
Three types of fMRI data were used and analyzed in this study including operation span (OSPAN) working memory tasked-based fMRI data (Faraco et al., 2011; Zhu et al., 2011), resting state fMRI data (Li et al., 2010; Lv et al., 2010; Lim et al., 2011) and natural-stimulus fMRI data (Hu et al., 2010; Hu et al., 2011). In the OSPAN working memory task-based fMRI scan (Faraco et al., 2011; Zhu et al., 2011), fMRI and DTI images were acquired on a 3T GE Signa scanner at the University of Georgia (UGA) Bioimaging Research Center (BIRC). Acquisition parameters were as follows: fMRI: 64×64 matrix, 4mm slice thickness, 220mm Field of View (FOV), 30 slices, repetition time (TR)=1.5s, echo time (TE)=25ms, ASSET=2. Each participant performed the operational span (OSPAN) task while fMRI data was acquired. The total task length was 6min and 45s, with fixed alternating conditions of OSPAN, Arithmetic, and Baseline. 3 OSPAN, 3 Arithmetic, and 6 Baseline epochs were presented and each epoch last 30s. More details of the paradigm design could be referred to (Faraco et al., 2011).
In the natural stimulus fMRI scan (Hu et al., 2010; Hu et al., 2011), we randomly selected video shots from the TRECVID 2005 database (http://trecvid.nist.gov/), which were presented to four healthy adult subjects during their fMRI scans at the same scanner at UGA BIRC. Three categories of sports, weather and commercial/advertisement were selected from the TRECVID 2005 data sets with corresponding labels. 51 shots were randomly selected in these three categories, and were composed into 8 media clips with length of 11min. The acquisition parameters were as follows: 30 axial slices, matrix size 64×64, 4mm slice thickness without interslice space, 220mm field of view (FOV), repetition time (TR) 1.5s, echo time (TE) 25ms, ASSET=2. Additional details of the experimental paradigm and imaging settings could be referred to (Hu et al., 2011).
In the resting state fMRI scan (Li et al., 2010; Lv et al., 2010; Lim et al., 2011), nine subjects were scanned in the same scanner at UGA BIRC. Resting state fMRI data were acquired with dimensionality 128*128*60*100, spatial resolution 2mm*2mm*2mm, TR 5s, TE 25ms, and flip angle 90 degrees. For all of the three types of fMRI data sets, DTI data was acquired using the same spatial resolution as the resting state fMRI data; parameters were TR 15.5s and TE 89.5ms, with 30 DWI gradient directions and 3 B0 volumes acquired (Zhu et al., 2011; Zhang et al., 2011).
For preprocessing, we used the DTI images as the reference space and registered fMRI images to the DTI space by the FSL FLIRT tool. The rationale is that DTI and fMRI sequences are both echo planar imaging (EPI) sequences, their geometric distortions tend to be similar (Li et al., 2010; Li et al., 2012), and the misalignment between DTI and fMRI images is much less than that between T1 and fMRI images (Li et al., 2010; Li et al., 2012). DTI preprocessing steps included skull removal, motion correction and eddy current correction (Zhu et al., 2011; Li et al., 2012). Then fiber tracking was performed using streamline tractography (via MEDINRIA, FA (fractional anisotropy) threshold of 0.2, smoothness of 20 and minimum fiber length of 20) and the tracked whole-brain fibers were used for the following fiber-centered functional connectivity analysis. Brain tissue segmentation was conducted on DTI data directly via the in-house methods in (Liu et al., 2007), and the cortical surface was reconstructed using the in-house approaches in (Liu et al., 2008). FMRI preprocessing steps included motion correction, spatial smoothing, temporal prewhitening, slice time correction, global drift removal, and band pass filtering (Lv et al., 2010; Li et al., 2010; Lim et al., 2011; Zhu et al., 2011; Li et al., 2012).
2.3. Functional connectivity measurement based on structurally-connected gray matter voxel pairs
Structural connectivity was defined based on white matter fibers tracked from DTI images, and fMRI signals were then mapped onto the gray matter volumes segmented from DTI images directly (Liu et al. 2007) using the similar methods in (Lv et al. 2010). Denote the set of all gray matter voxels as vi ∈ V, the structural connectivity (SC) between voxel pair (vg, vh) is defined as:
| (1) |
In practice, to determine whether a gray matter voxel is connected by a DTI-derived fiber, we search its nearby neighborhood within an empirically defined range. This step is essential to accurately extract the structurally-connected gray matter voxels (Lv et al. 2010) because DTI fiber tractography via the streamline approach might have difficulty in tracking inside gray matter and there could be discrepancy in the brain tissue segmentation based on DTI data and the DTI tractography (Liu et al. 2007). Typically a fiber would connect several gray matter voxel pairs, and in this study, all the pairs were taken into account during the construction of the voxel pair set, while redundant pairs (the same pair of voxels connected by different fibers) would be removed. An example of gray matter voxel pairs connected by DTI-derived fibers is illustrated in Figure 2(a), in which a randomly selected fiber connecting gray matter voxel pairs is displayed. We denote the set of GM voxel pairs connected by fibers as structurally-connected gray matter (SCGM) voxel pairs:
| (2) |
Figure 2.
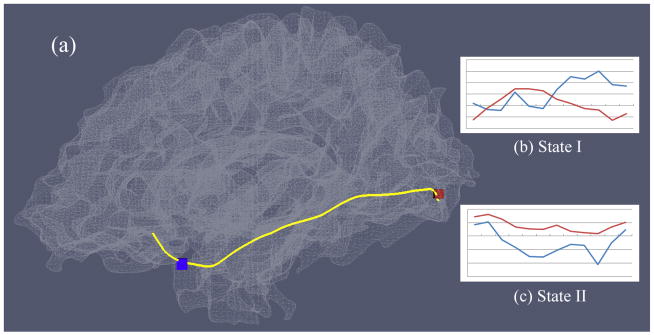
(a) Example of a SCGM voxel pair shown in red and blue boxes that are connected by DTI-derived fibers (in yellow). (b) The fMRI time series from the two voxels have low correlation within a specific time window (State I). (c) The fMRI time series from these two voxels are relatively higher correlated within another time window (State II).
The order of elements is maintained by indexing all (vg, vh) in the set.
In Figure 2, the fMRI time series of the two GM voxels are shown in two different time periods: state I in Figure 2(b) and state II in Figure 2(c). The same voxel pair exhibits different functional correlations during these two states, suggesting that brain functional connectivity could be under dramatic changes throughout the time course. To quantitatively characterize the functional connectivity dynamics on axonal fibers, we defined the functional connectivity (FC) between voxel pair [vg, vh] in time window [ti, tj] as:
| (3) |
Assume that the totally scan length is l time points, and the time window size is s, we could apply a sliding time window (tk, tk+s) where 1 ≤ k ≤ l − s and obtain FCs defined on SCGM voxels. By concatenating all FCs into a vector, we thus generated the functional connectivity vector (FCV) of all fibers defined at each time point k:
| (4) |
FCV consists of m (the total number of fiber-connected voxel pairs) elements; each element is the connectivity strength of a specific voxel pair within the time window. Therefore, for each brain, we can extract (l-s) FCVs, and all those FCVs could be temporally concatenated into a FCV matrix. For dimension reduction and analysis purposes, elements in FCV at each time window would be further averaged into a single value, which is the measurement of the connectivity strength of the whole brain at that time point, and the collection of them throughout the whole time series is defined as the global brain connectivity strength curve (CSC):
| (5) |
The curve is a simplified illustration of the dynamics of functional brain connectivity, and this temporal summary of functional connectivity strength serves as the basis for our state change detection modeling, where the change points were determined by the local maximum of the absolute temporal derivative of the curve, if its exceeds the experimentally-defined threshold.
Also, we applied a threshold T to all elements in the FCV to obtain the connectivity edge vector (CEV):
| (6) |
where CEV(k) denotes the unweighted binary edges describing brain functional network at time point k. Both FCV and CEV would be used for functional state quantification.
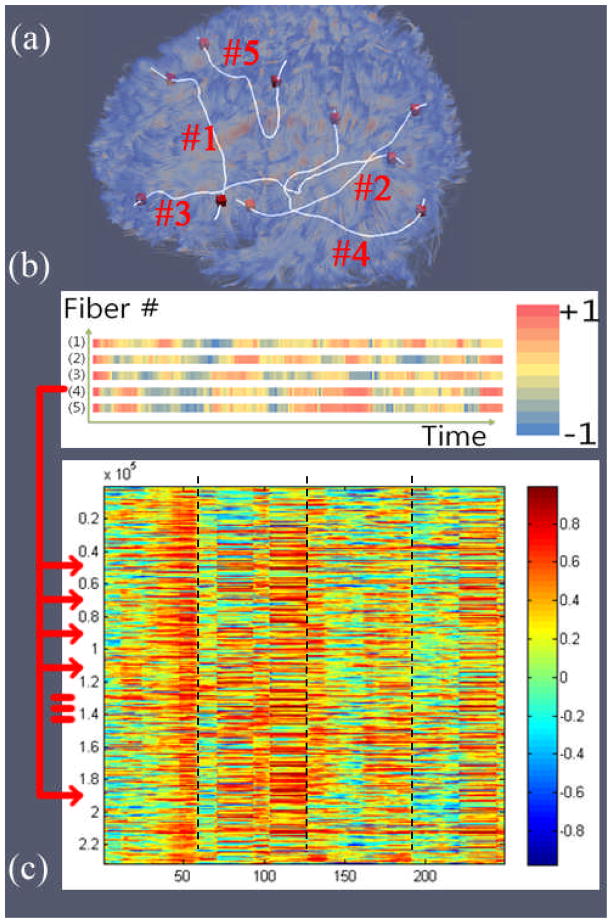
As an intuitive illustration, Figure 3(a) and Figure 3(b) show five examples of voxel pairs and the dynamics of their functional connectivity. The temporal dynamics of function connectivity is apparent in Figure 3(b). In addition, as shown in Figure 3(c), 253 FCVs were obtained and visualized as a matrix. An important observation obtained from Figure 3(c) is that the FCVs undergo consistent dynamic changes along the time series. For instance, three dashed black lines highlighted three abrupt changes of the FCV attributes, further suggesting that the brain is under constant functional dynamics and these FCV changes indicate possible state changes. This interesting observation has been replicated and reproducible in all of the thirteen cases of task-based fMRI data sets (Zhu et al. 2011; Faraco et al. 2011) we studied and motivated us to propose the FCV-based brain state change detection approach in this paper.
Figure 3.
(a) Fibers with their end points in cortical gray matter, five fiber connections are highlighted; (b) Dynamics of functional connectivity of the above five SCGM voxel pairs. The temporal correlation between a specific voxel pair within each time window is a single cell in the corresponding color-coded vector (1 to 5). Thus each color-coded vector is a visualization of the connectivity strength dynamics of that voxel-pair; (c) Combined FCVs through the whole time course, which is an extension of (b) from five SCGM voxel pairs to all SCGM voxel pairs. The temporal correlation between a specific voxel pair within each time window is a single cell in the matrix visualization, each column of the matrix is the visualization of a single FCV at a specific time window, and each row is the dynamics of the functional connectivity of a specific SCGM voxel pair. Thus the whole matrix represents the whole brain (all SCGM voxel pairs) functional connectivity dynamics.
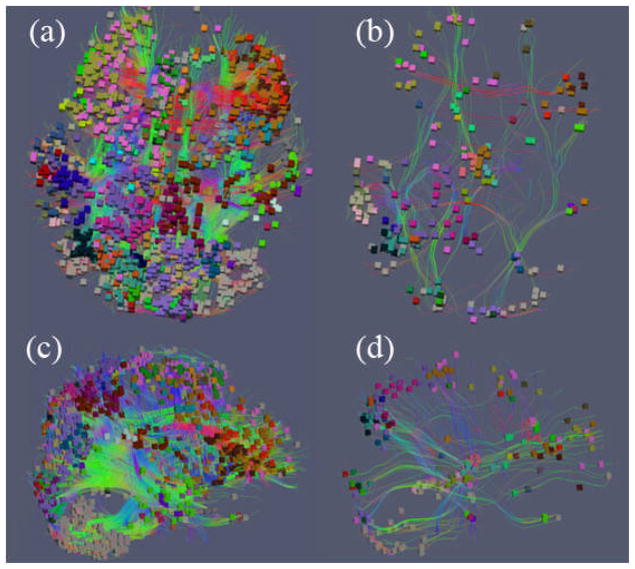
So far, we have demonstrated in Figure 2 and Figure 3 that for the same pair of SCGM voxels at the two ends of a DTI-derived fiber, it could have quite different functional connectivity patterns in different time windows. Our extensive observations from the fMRI data is that brain functional connectivity changes dramatically temporally. As examples, Figure 4 shows the voxel and fiber views of two brain states with different functional connectivity patterns, possibly caused by the time-lapse changes of external inputs (stimulus vs. base-line). It is evident that during external stimulus intervals, there are extensive voxels with high FC spreading over most parts of the brain as shown in Figure 4(a) and 4(c). While during the baseline interval, there are much less such functional connections (in Figure 4(b) and 4(d). This result further suggests that functional connectivity of the two ends of axonal fibers can be a good indicator of how active the brain is and can be used for functional brain state detection, e.g., active or inactive states.
Figure 4.
Two connectivity states from two different time windows of one subject. Fiber-connected voxel (colored boxes) pairs with FC greater than the threshold of 0.8 are visualized. Voxels are colored by the MNI (Montreal Neurological Institute) atlas labels in (Shen and Davatzikos, 2002). (a) Connectivity state (highly functional correlated voxel pairs) during the time window from 78s to 96s that falls into the stimulus period of task-based fMRI (Faraco, et al., 2011); (b) Connectivity state during the time window of 34s to 52s which falls into the baseline period; (c) Lateral view of (a); (d) Lateral view of (b).
2.4. Constructing similarity/difference matrix between FCVs for brain state change detection
As mentioned before, we can determine the functional brain state changes by examining the temporal abrupt alterations of FCV, based on our main premise that functional connectivity of the whole brain, which could be described by the correlations of SCGM at each time window, i.e., via FCV and CSC, is undergoing state-like dynamics. To show the similarity between any two states (ti, ti+s) and (tj, tj+s), we measured the Pearson correlation between their FCVs. Figure 5 shows the matrix of similarity between FCVs in a duration of 22 time points. If the brain state within a time period is stable, we will have relatively high similarity for this period in the matrix, as shown in the red-block areas in the red boxes in Figure 5. Within this area, FCVs that are even temporarily far away from each other still have high similarity. On the contrary, if there is a functional brain state change, there is low similarity between temporarily neighboring or even adjacent FCVs (the blue low intensity values in Figure 5), where the connectivity pattern changes abruptly, as shown in the boundaries around the red blocks.
Figure 5.
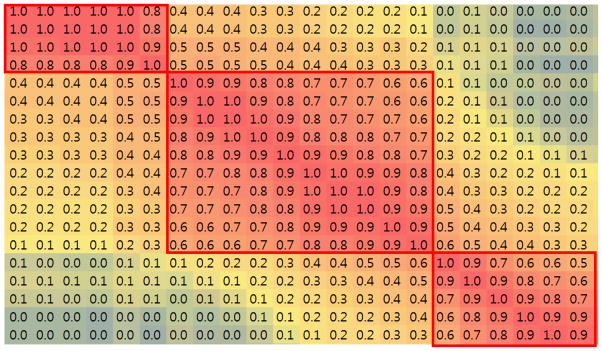
Similarity matrix between FCV at different temporal points, showing clear temporal boundaries that represent brain state changes, as indicated by the red boxes.
Based on the observation of the similarity of FCVs, we quantified the brain functional connectivity dynamics and detected the change point by measuring the similarity between adjacent FCVs, defined as the functional state similarity vector (FSSV):
| (7) |
which is the summed absolute difference between FC on each fiber of two adjacent time points. At each time point ti, FSSV captures the brain activation magnitude change as well as connectivity pattern change, e.g., if the overall brain activation (functional correlations on most of the fibers) was high on time t1 but low on time t2, FSSV would be increased; on the other hand, if a group of fibers were activated (have high functional correlation) on time t1 but deactivated on time t2, FSSV would also be increased because of the large difference caused by this group of fibers. The state change point could be detected by the local maximum of FSSV. In addition to the state change modeling introduced in section 2.3 using CSC, FSSV would also be used for the state change detection, and it will be shown later that the results obtained from these two modeling schemes, which are both based on FCV, are similar to each other.
2.5. Assessment of functional connectivity dynamics in sub-networks
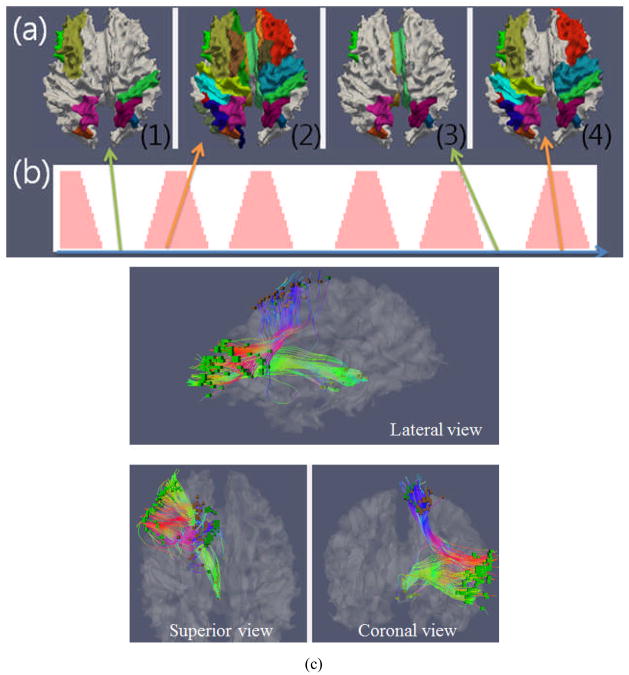
The FCV matrix shown in Figure 3 was obtained from all of the fibers in the whole brain for assessment of global brain state changes. A natural question is how this global functional brain state is correlated to the functional states of specific sub-networks in the brain. In this paper, we used the FCV model within a specific sub-network to investigate the dynamics of functional connectivity between different regions of the brain. First, we applied the HAMMER registration toolkit (Shen and Davatzikos 2001) to warp the MNI atlas into a subject brain in consideration, which was then used to annotate each SCGM voxel pair by the MNI atlas labels. As a result, each SCGM pair would belong to one or two MNI atlas regions. Then, the functional correlation of each region with other regions can be characterized and described by the FCV of all of the fiber bundles connecting them, as illustrated in Figure 6. In this figure, the functionally-connected brain regions, which are identified by the high FCV values, are illustrated in four different time windows. These four time windows were then marked by (1) to (4), where (1) and (3) were in the baseline periods, while (2) and (4) were in the stimulus periods, as shown in the stimulus function in Figure 6(b). It can be clearly seen that the activated brain regions exhibit different functional connectivity patterns in the baseline periods and stimulus periods, respectively. In the baseline periods, there are many fewer activated brain regions, in the stimulus period, activated regions are distributed all over the brain. Then, we investigated the region-to-region functional connectivity by using a similar method to that described in Section 2.3, but only using a subset of the DTI-inferred fibers that connect these specific brain regions (Figure 6(c)). By analyzing the functional connectivity between different brain regions, their brain state dynamics described by FCV patterns within sub-networks was assessed via the similar approaches in Section 2.4. Finally, the functional states within those sub-networks are compared with the global CSC curve derived from the whole brain, in order to verify the possible common functional dynamics patterns within both local and global networks.
Figure 6.
Illustration of assessment of functional connectivity dynamics in sub-networks. (a) Regions with high functional connectivity are highlighted with colors on the cortical surface, during four separate brain states ((1)–(4)); (b) Integrated external stimulus curve during task-based fMRI. The brain state (1) and (3) in (a) correspond to the baseline intervals in (b), and the brain state (2) and (4) in (a) correspond to the stimulus intervals in (b). (c). Example of SCGM voxel pairs in sub-networks.
3. Experimental Results
In this section, we applied the modeling scheme in section 2.3 and 2.4 on three types of fMRI data sets (the task-based fMRI, resting state fMRI and natural stimulus fMRI) to evaluate and validate the proposed framework in revealing the dynamics of functional brain states. First, we applied our FCV model on a task-based fMRI dataset to detect global brain state change. The results were partially validated by benchmark block-based stimuli curves in benchmark block-based paradigm. In the second experiment, we used the proposed framework to investigate functional brain state changes in resting state and under natural stimulus of movie watching, respectively. The third experiment compared our functional brain state change detection approach with the temporal clustering analysis (TCA) method (Gao and Yee, 2003). Finally, in the fourth experiment, we assessed the sub-network connectivity dynamics and compared those with global brain state changes based on a task-based fMRI dataset.
3.1. Results on task-based fMRI data
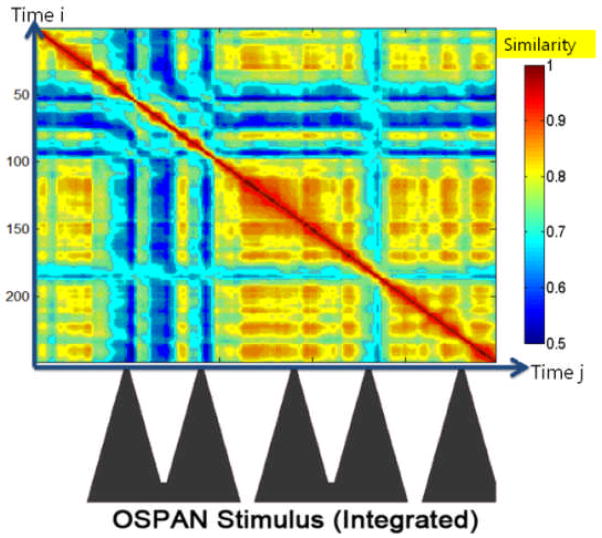
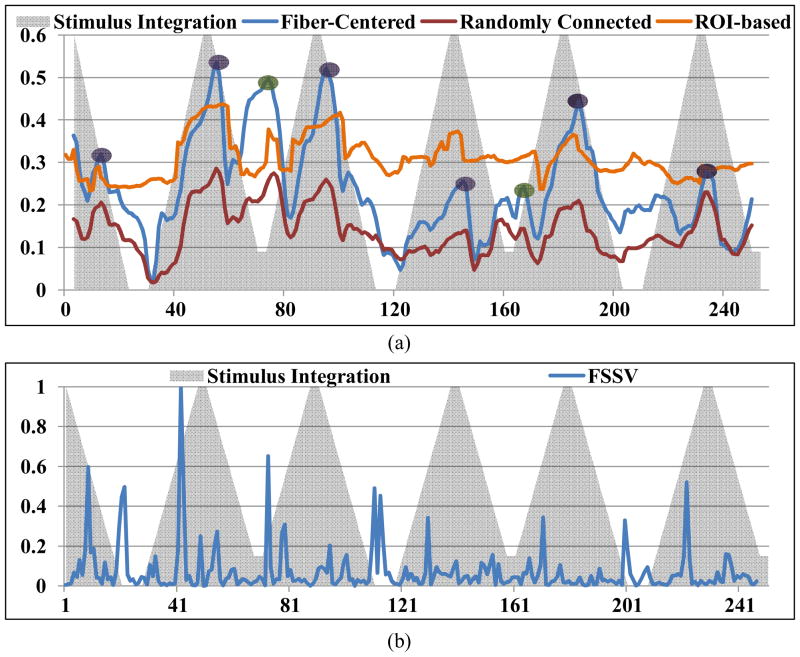
We applied the proposed approaches in Sections 2.3 and 2.4 on a working memory task-based fMRI dataset (Faraco, et al., 2011; Zhu et al., 2011). The FCV and CEV matrices of the subject are shown in Figure 7. We can see the abrupt changes (e.g., those marked by the colored lines) between adjacent FCVs, which verify our premise that the human brain undergoes through a series of functional state changes when performing tasks. Such abrupt functional state change can also be clearly observed in the similarity map of FCV matrix shown in Figure 8, where each matrix cell corresponds to the similarity between a pair of FCVs in adjacent time windows (the diagonal line is the correlation of a feature vector with itself) and the color of each cell encodes the correlation value (the color bar is on the right). From the correlation map, boundaries of FCV changes are visualized as blue columns because of their low correlations. Also, there are observable alignments between the boundaries of FCV changes and the external stimulus curve. In particular, it can be appreciated that both the onsets and the offsets of the working memory task stimulus are associated with the brain state changes, as shown by the blue columns aligned to the peaks and valleys of the integrated external stimulus curve. Intuitively, the abrupt changes between adjacent FCVs reflect the changes of global brain connectivity presumably induced by the external stimulus. Notably, there are several temporal ranges with continuously high FCV correlations in the correlation matrix, suggesting that the whole-brain functional connectivity remains relatively constant for a period of time, until another functional brain state change occurs. In addition, as shown in Figure 9(a), the global CSC is displayed along with the integration of working memory task stimulus curve. We can see that the connectivity strength curve, which shows the functional synchronization level of the whole brain, is in rough temporal alignment with the external stimulus curve. When the brain was under steady stimulus state or steady baseline state, the global CSC tends to reach the high values (highlighted in purple and green respectively), as the whole brain is synchronized. These qualitative observations of the alignment of functional brain state dynamics identified by the model with the external stimulus as shown in Figure 8 and Figure 9 are reproducible and replicable in all of working memory fMRI data sets we studied. It should be noted that during baseline state, if the brain is truly at rest, the synchronized level could be very high (as highlighted in green circle) because of the high functional correlation between the similar fMRI signals. However, there are cases when brain would not be at rest during what was supposed to be the baseline state, and the CSC is low at those periods. When in the transitional state, the overall functional connectivity magnitude tends to be small and undergoes substantial change, as different parts in the brain activate asynchronously.
Figure 7.
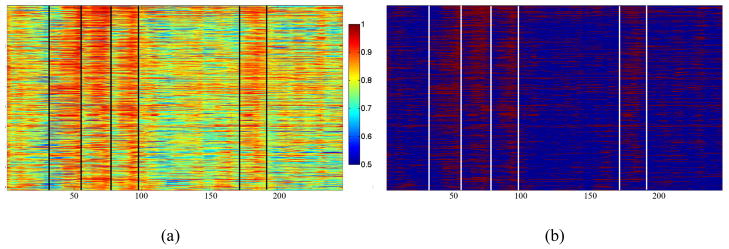
An example of FCV and CEV matrix visualization over the whole fMRI scan time course. (a) FCV matrix; the black lines show the state change boundaries; (b) CEV matrix. The white lines are fiber connections with correlation value greater than the threshold T1.
Figure 8.
Temporal alignment between the FCV similarity map and the integrated OSPAN stimulus curve. Blue areas indicate low temporal correlation between FCVs and correspond to brain state changes.
Figure 9.
Temporal alignment between the stimulus curve and the global brain CSC. The horizontal axis represents the temporal points of brain activation, while vertical axis is the averaged functional correlation value (except for integrated stimulus function). Global CSC for fiber-connected voxels is shown as blue curve, global CSC for randomly connected voxels is shown as red curve, ROI-based inferred CSC is shown as orange curve, and the integrated stimulus curve are shown as grey triangles. Points with high connectivity during the stimulus periods are highlighted by purple circles. Points with high connectivity during baseline periods are highlighted by green circles. (b) FSSV (in blue) of the same subject, derived from the change of connectivity pattern between consecutive windows. Integrated stimulus curve are shown as grey triangles.
The FSSV of the FCVs dynamics is also shown in Figure 9(b). By visual inspection, the change points detected by FSSV and CSC are similar to each other, and further comparison of the results obtained by the two methods shows that over 85% of the total state change points detected by FSSV were within 2 temporal points distance as the state change points detected from the derivative of CSC in all subjects.
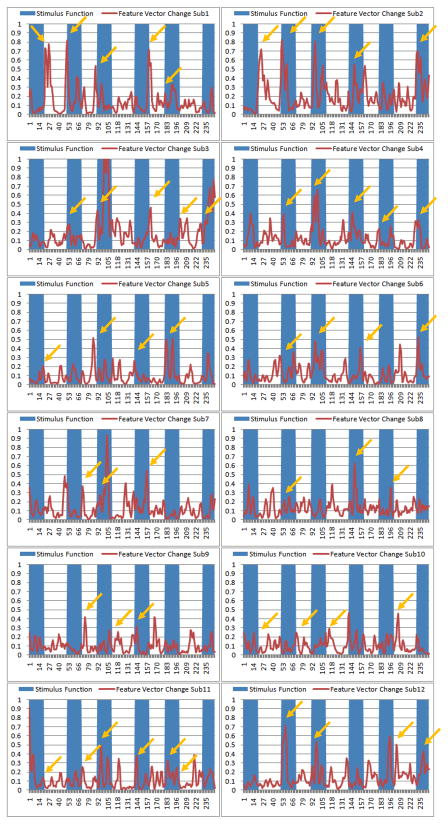
To further replicate the above results, we obtained the FCV and CSC on twelve subjects with DTI and working memory tasked-based fMRI data, and the results are presented and visualized in Figure 10. It is evident that most of the abrupt changes of CSC (local maximum of first-order derivative) roughly correspond to the external stimulus curve change points, as highlighted by the yellow arrows. This result further supports that the proposed FCV and CSC can effectively represents the brain’s responses to external stimuli. Statistically, the correlations between CSC and the stimulus curve are significant for all of these twelve subjects (p-value<0.05), indicating that our data-driven method has the ability to model and detect the functional brain state changes presumably induced by external stimulus input. Hence, we hypothesize that the proposed FCV model and the global CSC curve can effectively represent the overall functional connectivity in the brain, and thus their abrupt changes along the time axis can effectively identify brain state changes. Given that the global CSC change points correlated well with the stimulus curve in the task-based fMRI paradigm, we consider this result as a partial validation of our model for brain state change detection.
Figure 10.
Temporal alignments between the external stimulus inputs (blue boxes) and the absolute temporal derivative curves of the global CSC curves (red ones) for twelve subjects. The yellow arrows highlighted some abrupt changes of the curves that are in correspondence with the switch points of the external stimulus curve.
3.2. Results on resting-state and natural-stimulus fMRI data
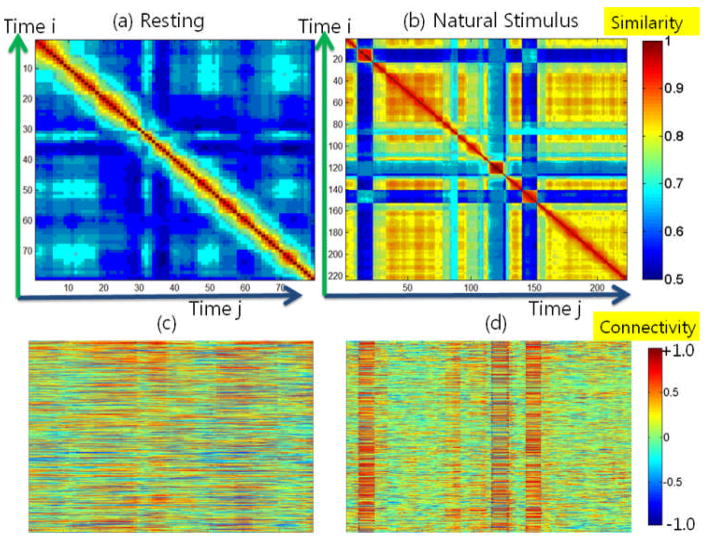
In addition to task-based fMRI/DTI data, we also applied the proposed approaches in Sections 2.3 and 2.4 on resting state fMRI/DTI data (Li et al., 2010) and natural stimulus fMRI/DTI data (Hu et al., 2011), respectively, in order to investigate functional brain state changes under these conditions. As shown in Figure 11(a), the dynamics of functional brain connectivity in resting state are relatively low, which indicates a comparatively stable functional status during resting state. This observation can also be confirmed by the visualized FCV matrix in Figure 11(c). As a quantitative comparison, Table 1 shows the numbers of functional brain state changes obtained from both task-based and resting-state fMRI data sets for the same group of subjects. The table shows that brain has much more functional state change points in task-based fMRI data than those in resting-state fMRI, and the difference is consistently large across the same group of participating subjects. Since the comparison is from the same group of subjects who were coincidently scanned with both resting state fMRI and task-based fMRI using the same scanner, the difference between the results from task-based and resting-state fMRI proves the validity of the model, showing the link between state change points detected and the real brain functional connectivity dynamics. In addition, the number of edges in CEV in task-based fMRI is also much higher than that in resting state fMRI using the same threshold. This result is quite reasonable since functional brain connectivity is much more prominent when the subject is performing tasks. It should be noted that even in resting state, the brain could be still under continuous brain state changes. For instance, the five brains in Table 1 had 15 state changes on average during the resting state fMRI scan periods. This result is in agreement with the recent report in (Chang and Glover, 2010) that the functional connectivity is under dynamic changes within multiple time scales.
Figure 11.
FCV matrices and its similarity matrices in resting state and under natural stimulus. (a) Similarity matrix for resting state fMRI data. (b) Similarity matrix for natural stimulus fMRI data. (c) FCV matrices for resting state. (d) FCV matrices for natural stimulus.
Table 1.
Numbers of brain state changes detected and the average percentages of CEV edges in task-based fMRI and resting state fMRI. Five subjects who had both task-based fMRI and resting state fMRI data sets were analyzed.
| State change number in task-based fMRI | State change numbers in resting-state fMRI | % of edges in CEV in task-based fMRI | % of edges in CEV in resting-state fMRI | |
|---|---|---|---|---|
| Sub1 | 27 | 7 | 34% | 28% |
| Sub2 | 30 | 16 | 37% | 27% |
| Sub3 | 20 | 16 | 37% | 22% |
| Sub4 | 37 | 17 | 38% | 35% |
| Sub5 | 38 | 18 | 38% | 27% |
In contrast, when the proposed fiber-centered brain state change detection approaches in Sections 2.3 and 2.4 were applied on the natural stimulus fMRI data under movie watching (Hu et al., 2010; Hu et al., 2011), it turned out that there are many more functional brain state changes, as shown in Figure 11(b), which can also be observed by the visualized FCV in Figure 11(d). Also, examples of fibers with high functional connectivity at different time windows are visualized in Figure 12. When comparing the functional state change dynamics between resting state and natural stimulus in Figure 12, it can be clearly seen that the numbers of functionally connected fibers during resting state varies much less temporally, while those during natural stimulus fMRI scans change dramatically. Due to the lack of widely-accepted quantitative measurements of the natural stimulus curves at the current stage, we only performed this qualitative study and further quantitative analysis of the FCV and natural stimulus curves are left to our future work. It should be emphasized that our FCV model and brain change detection method can clearly reveal the brain dynamics during natural stimulus of movie watching.
Figure 12.

Visualization of fibers with functional connectivity value (defined as the averaged FC of all voxel pairs connected by the fiber greater than a predefined threshold from a randomly selected subject. (a) Functional connectivity during resting state in two different time windows; (b) Functional connectivity during natural stimulus states (when watching CNN video news) within three different time windows.
3.3. Rationale of using fiber-guided functional connectivity modeling
To demonstrate the benefit of using structural information in guiding the modeling of functional connectivity and validate our premise that structurally connected brain voxels are more likely to be functionally connected, we analyzed the functional correlation of fiber-connected voxel pairs, as well as the same number of randomly selected GM voxel pairs, in the whole time course. The histograms of the results are shown in Figure 13, where blue bars are the correlations between fiber-connected point pairs and red bars are the correlations between random points. From the figure we can see that there are much more highly functionally correlated voxel pairs connected by fibers, comparing to those of random voxel pairs. Besides the histogram from two subjects shown in Figure 13 as an example, we have observed the same trend of difference in correlations of all subjects.
Figure 13.
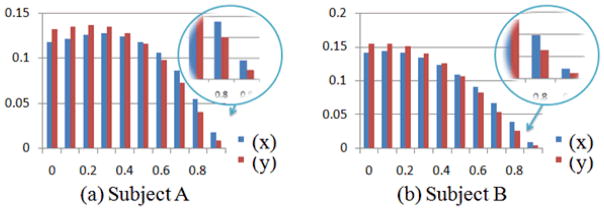
Histogram of Pearson’s correlation (correlation coefficient are binned at horizontal axis) of SCGM voxel pairs (blue bars) and randomly selected GM voxel pairs (red bars) of two subjects.
Also, we obtained the FCV and the CSC between the randomly selected GM voxel pairs using the same model. The CSC is shown as the green curve in Figure 9(a), comparing to fiber-centered CSC as the blue curve. From the figure, it is evident that the randomly selected GM voxel pairs have much lower global functional connectivity than the fiber-centered SCGMs, suggesting that the proposed fiber-centered approach has good effectiveness in representing functional brain states and in detecting their changes. It is interesting that the CSC of randomly selected GM voxel pairs also roughly follows the shape of that of fiber-centered SCGMs, which might suggest that the whole brain is really undergoing a stable functional state change. However, the underlying reasons that could potentially explain the similar CSC curves of both fiber-connected and randomly selected voxel pairs should be investigated in the future. Our current interpretation is that the global functional brain state changes in response to the external stimulus drive the overall CSC shape patterns, despite the significant difference in connectivity strengths for fiber-connected and randomly selected voxel pairs.
3.4. The effect of sliding time window length
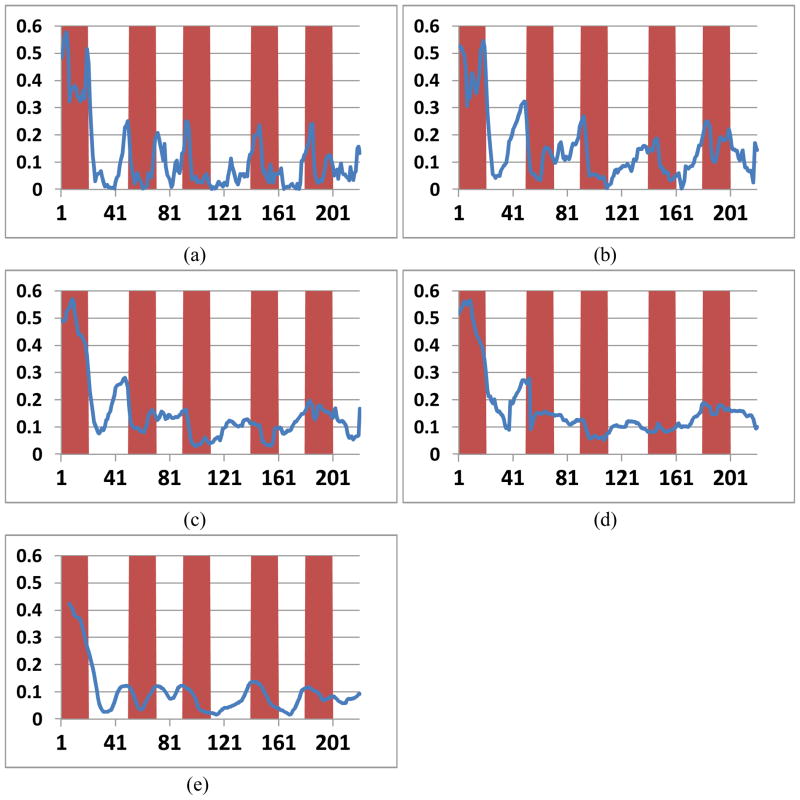
To investigate the potential effect of the chosen of sliding time window length on the results, we have tested and compared 15 different window sizes from 19 to 49 time points, by using both square-edged and tapered window. Four CSCs obtained from different window sizes ranging from 19 to 49 are selected to ben shown in Figure 14(a) to 14(d). It could be seen that the CSCs were all roughly aligned with the stimulus function and are in correspondence with each other, suggesting the FCV model and brain state change detection result are not sensitive to the selection of the specific time window length. Also, Figure 14(e) is the moving average of Figure 14(a) (sliding time window length of 19), and is similar with Figure 14(c) (sliding time window length of 39). This similarity suggests that using a larger sliding time window for the model has similar effect of smoothing the model results. From all the window size tested on all subjects, the experiment results showed a monotonically decreasing of the change points detected by the model, indicating a trade-off between the model sensitivity in detecting change points and its vulnerability to noise. The optimal length of sliding time window is related to the frequency response of the brain and fMRI BOLD signal. In this work, the length was determined experimentally to be 23, which is twice of the period (23 seconds) of the normal cut-off frequency (0.08Hz) for low-pass filter (Fox and Raichle 2007), thus the temporal length should cover sufficient BOLD signal and recover the correlation pattern.
Figure 14.
Global CSC curve obtained by using four different sliding time window length: (a) sliding time window length=19; (b) sliding time window length=29; (c) sliding time window length=39; (d) sliding time window length=49. (e) Moving average of (a) (length 19) with window size of 12. The curves have been trimmed to enable comparison.
3.5. Comparison with temporal clustering analysis (TCA)
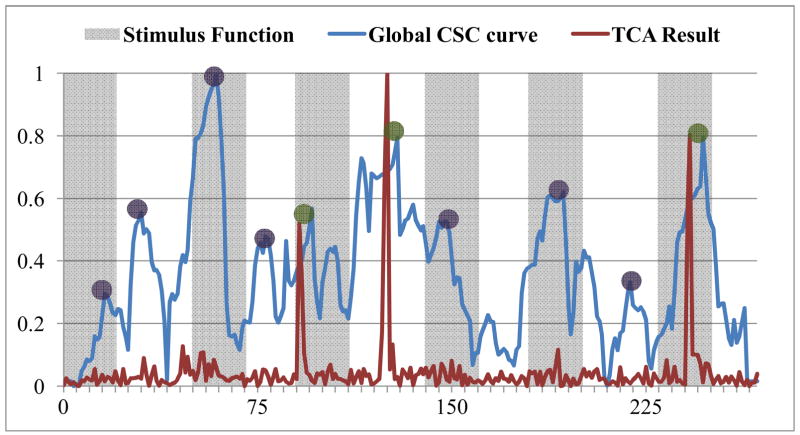
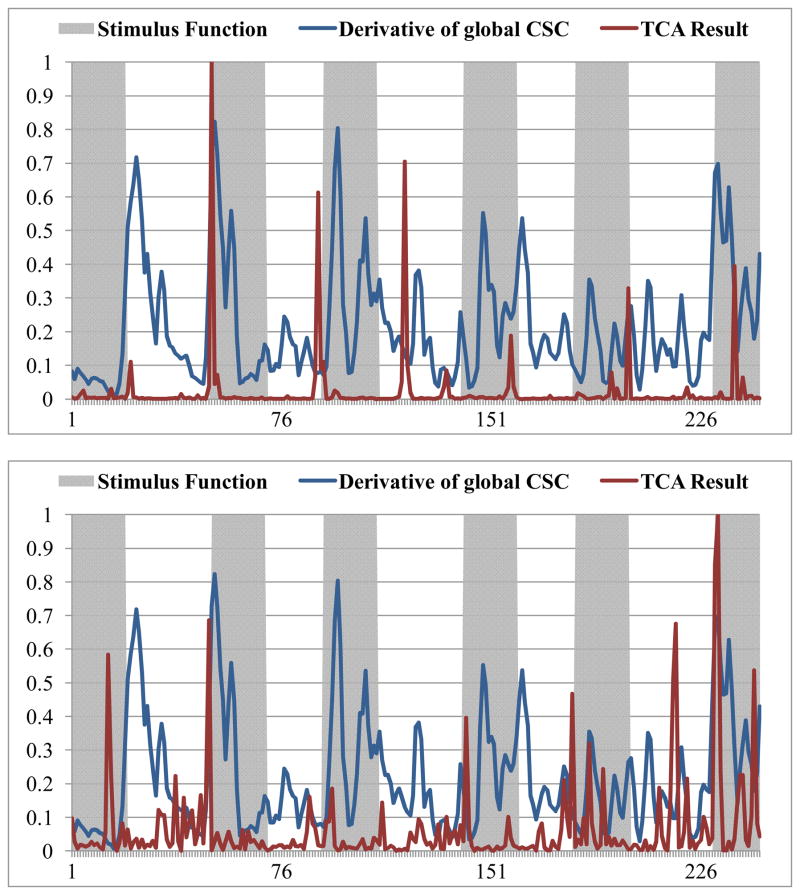
Temporal clustering analysis (TCA) is a method that uses the fMRI BOLD signal to detect the occurrence of maximal signal response in the brain (Gao and Yee, 2003). In brief, TCA is performed by creating a histogram of the voxels that reach their maximum signal at each time point in the time axis, and then the global signal peaks can be selected (Gao and Yee, 2003). For quantitative comparisons, the TCA method was applied on the same task-based fMRI dataset used in Section 3.1, and the results are shown in Figure 15, Figure 16 and Table 1. It can be clearly seen in Figure 15 that certain brain responses to the external stimulus can be detected by TCA, and they are in correspondence with our results (highlighted by green circles). However, the number of functional brain state changes that can be successfully identified by our method is substantially more (represented by green circles) than those by the TCA method, meaning that our method is more sensitive and accurate in detecting functional brain state changes. In particular, these above results are reproducible in all of other subjects we scanned, as shown in Figure 16. Quantitative comparisons between FCV model and the TCA method are provided in Table 2. Specifically, 48.9% of the functional brain state changes can be detected by both methods, but other 46.8% of the functional brain state changes can only be detected by FCV model. This result suggests the superiority of the FCV model over TCA in terms of better sensitivity to functional brain state changes. Our interpretation of the performance difference between the proposed method and the TCA method is that TCA is performed on the raw fMRI signals, which might be sensitive to the low signal-to-noise ratio; while FCV model is based on the temporal correlation curve between fMRI signals of SCGM pairs, which could better reflect the temporal dynamics of functional connectivity and be more robust to noises (Lv et al., 2010; Lim et al., 2011).
Figure 15.
Result comparison with TCA method. The blue curve is the global CSC obtained by FCV model, and the red curve is the result obtained by TCA. The magnitudes of both curves have been normalized to be in the range of (0, 1). State changes detected by both methods are highlighted by green circles. State changes detected only by FCV model are highlighted by purple circles.
Figure 16.
Additional results of comparisons between FCV model with the TCA method for two subjects. The blue curve is the temporal derivative curve of the global CSC, and the red curve is the result obtained by TCA.
Table 2.
Comparison of the change points detected by FCV model and the TCA method. Column 2–4 only listed the number of change points which were determined by visual examination and also detected by either of the models.
| Benchmark change points determined by visual examination | Common change points detected by both models | Additional change points detected by FCV model only | Additional change points detected by TCA only | |
|---|---|---|---|---|
| Sub1 | 11 | 3 | 8 | 0 |
| Sub2 | 14 | 7 | 5 | 2 |
| Sub3 | 10 | 7 | 3 | 0 |
| Sub4 | 12 | 6 | 6 | 0 |
| Total | 47 | 23 (48.9%) | 22 (46.8%) | 2 (4.3%) |
3.6. Comparison with ROI-based functional connectivity dynamics
Recently, a large set of consistent and correspondent cortical landmarks (named Dense Individualized and Common Connectivity-based Cortical Landmarks, or DICCCOL) were discovered and validated by optimizing group-wise consistency of DTI-derived fiber shape patterns (Zhu et al., 2012; Zhu et al., 2011). This set of DICCCOL ROIs has been reproduced in four separate healthy populations (Zhu et al., 2012), and could be predicted on new individual subject only based on DTI data (Zhang et al., 2011; Zhu et al., 2012; Zhu et al., 2011). The definition of DICCCOL ROIs and the source codes are available at: http://dicccol.cs.uga.edu. Based on the fMRI signal extracted from each ROI, the dynamics of functional connectivity between ROIs were studied using a similar sliding time window approach described in section 2.3, where the FCV was composed of functional connectivity between fMRI signals extracted from ROIs rather than between signals extracted from fiber-centered voxel pairs. Specifically, at each time window, a 358*358 FCV was obtained, and each of its elements was the pairwise correlation between ROIs. Then, the CSC was obtained by averaging the FCV at each time window and concatenating all the averaged value into a vector, e.g., as shown by the orange curve in Figure 9(a). From the curves in the figure, it could be seen that CSC obtained from ROI-based model is in correspondent with the CSC obtained from fiber-centered model. Similar results were observed in all other subjects we studied, proving the effectiveness of the model and the potential in applying the sliding time window functional connectivity modeling on other data sets. On the other hand, the variation of CSC identified from ROI-based model is much smaller than CSC identified from fiber-centered model, which could probably be caused by the fact that time series abstracted from each ROI was the averaged fMRI signal of all voxels defined in that ROI, thus potentially lower the contrast of functional correlation between ROIs. CSC magnitude of variation from ROI-based model is around 40% lower than that from fiber-centered model, thus reducing its power in state change point detection and lowering the number of state change points detected by 25% for all subjects on average, including some benchmark change points that could be determined by visual examination.
3.7. Sub-network analysis
In this section, we examined the functional brain state change in sub-networks on the task-based fMRI dataset described in Section 2.2 via the methods in Section 2.5. Figure 17 shows an example of the temporal dynamics of functional connectivity between the “middle frontal gyrus right” to other three brain regions, including the “middle frontal gyrus left”, the “superior frontal gyrus left”, and the “thalamus left” respectively. In Figure 17, the temporally changing patterns of functional connectivity in these three sub-networks have considerable degree of similarity with the global brain CSC (in purple dashed line), suggesting that the global CSC reflects the summation of state curves of sub-networks in the brain. We have applied the analysis on all of our data, and it turned out that there are a variety of sub-networks with synchronized functional brain state dynamics that are similar to the global CSC. Based on quantitative analysis of 13 subjects, Table 3 lists the common sub-networks with synchronized functional brain state dynamics that are presented repeatedly in at least 12 subjects. These results demonstrate that the global brain functional dynamics described by global CSC is closely correlated to the functional dynamics within the sub-networks in the brain described by local CSC, further supporting our hypothesis that the FCV model is an effective representation of functional brain states.
Figure 17.
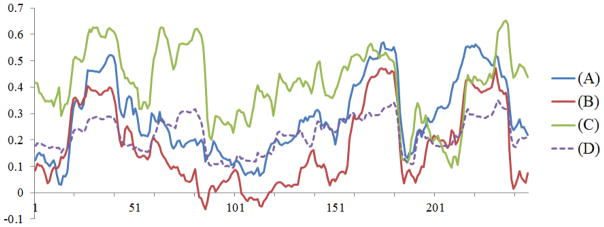
Functional connectivity dynamics on three sub-networks. The curves in the figure are the local CSC between structurally-connected brain regions. The blue curve (A) is the functional connectivity strength between “middle frontal gyrus right” and “middle frontal gyrus left”. The red curve (B) is the connectivity strength between the “middle frontal gyrus right” and the “superior frontal gyrus left”. The green curve (C) is the connectivity strength between the “middle frontal gyrus right” and the “thalamus left”. The dashed purple curve (D) is the global CSC for the purpose of comparison.
Table 3.
13 sub-networks that consistently exhibit synchronized functional brain state dynamics similar to the global CSC curves across in least 12 subjects. Each row is one sub-network. The three right columns list the names of the sub-network nodes. One example of the visualizations of the brain state dynamics of these sub-networks is shown in Fig. 17.
| Region 1 | Region 2 | Region 3 | |
|---|---|---|---|
| Subnetwork 1 | middle frontal gyrus right | angular gyrus right | inferior frontal gyrus right |
| Subnetwork 2 | brain stem | middle frontal gyrus right | thalamus right |
| Subnetwork 3 | precentral gyrus right | brain stem | postcentral gyrus right |
| Subnetwork 4 | medial frontal gyrus left | inferior frontal gyrus left | superior frontal gyrus left |
| Subnetwork 5 | medial frontal gyrus left | brain stem | medial frontal gyrus left |
| Subnetwork 6 | inferior frontal gyrus left | brain stem | thalamus left |
| Subnetwork 7 | inferior frontal gyrus left | middle occipital gyrus left | angular gyrus left |
| Subnetwork 8 | inferior frontal gyrus left | middle frontal gyrus left | middle occipital gyrus left |
| Subnetwork 9 | brain stem | middle frontal gyrus left | thalamus left |
| Subnetwork 10 | brain stem | superior frontal gyrus left | thalamus left |
| Subnetwork 11 | precuneus right | medial frontal gyrus right | cuneus right |
| Subnetwork 12 | inferior occipital gyrus left | middle temporal gyrus left | middle occipital gyrus left |
| Subnetwork 13 | insula left | middle occipital gyrus left | angular gyrus left |
4. Discussion and Conclusion
In this study, we investigated the concept of representing functional brain state change by the whole-brain functional connectivity, and presented a fiber-centered FCV model that can characterize and detect brain state change via data-driven approaches. The FCV model represents the brain’s global functional connectivity state through the temporal correlations of fMRI time series signals extracted from structurally-connected grey matter voxels in temporally sliding windows. The functional brain state change detection was formulated as abrupt change point detection on the global CSC derived from FCV. Experimental results demonstrated that the detected changes points in task-based fMRI data well corresponded to the block-based stimulus paradigm, and are substantially better than the results obtained by the TCA method. FCV model is also applied on resting state fMRI and natural stimulus fMRI data and reasonable results are obtained, which further indicate the effectiveness of the proposed approaches. In general, FCV model and the experimental results offered novel perspectives and insights into the functional dynamics of the brain in resting state, during task performance and under natural stimulus. In contrast, these revealed functional dynamics can hardly be seen by traditional static functional connectivity analysis (e.g., Wang et al., 2006; Dickerson and Sperling, 2009; Liu 2011), which is the major motivation of this work.
There are several lines of research directions that could potentially improve the current computational pipeline of brain state detection substantially. Currently, the brain state changes are modeled by the local maximum above a predefined threshold on the temporal derivative of the averaged FCV (CSC), as well as the local maximum of the difference between adjacent FCVs (FSSV). Though this method is effective and efficient, other alternative approaches such as those statistical algorithms in (Lindquist et al., 2007) and (Robinson et al., 2010) could be investigated and compared for more accurate change point detection in the future. In this work, only the pairwise connections between two ends of fibers (Sections 2.3 and 2.4) or Brodmann areas (Section 2.5) were considered. In the future, we plan to improve the FCV model by integrating and fusing more information from other functionally-specialized brain sub-networks, such as the attention, emotion, vision, and language systems determined by task-based fMRI, for better modeling and characterization of functional brain dynamics. Also, the functional state changes within these different brain networks will be examined and compared to verify that the proposed methodology can effectively reveal the common patterns of functional dynamics.
Given that there is very few ground-truth data in fMRI, complete validation of the proposed computational pipeline will be challenging. Nevertheless, we plan to further evaluate and partially validate the proposed FCV model and functional brain state change detection approaches via large-scale task-based fMRI data sets that can at least provide meaningful benchmarks for comparisons. Similarly, the correlations between the detected functional brain change points and those of the block-based paradigm curves will be used as the metric. Another possibility is to generate simulated functional brain states and their temporal dynamics, e.g., via the approaches in (Smith et al., 2011), as ground-truth data to partially validate the proposed approaches. For instance, if the proposed approaches can detect a majority of the simulated brain state changes, it can be considered as a strong evidence of effectiveness and accuracy of the methods.
Furthermore, the neuroscience interpretations of the revealed functional state dynamics and their applications in studying brain diseases/conditions should be investigated in the future. For example, the functional connectivity and interaction patterns within each quasi-stationary temporal segment should be assessed and compared. In addition, the temporal transition patterns of these functional interactions should also be studied to better understand the possible functional state space of the brain. Finally, the proposed FCV model and functional brain state change approaches will be applied to assess different brain diseases/conditions such as Alzheimer’s disease and Schizophrenia, which might be associated with abnormal functional brain dynamics (Hu et al., 2011b). We envision that better modeling and characterization of the functional brain dynamics will significantly advance our understanding of the working mechanisms of the brain in health and diseases.
Acknowledgments
T Liu was supported by the NIH Career Award EB 006878, NIH R01 HL087923-03S2, NIH R01 DA033393 and The University of Georgia start-up research funding. Parts of the OSPAN working memory fMRI data sets were provided by Carlos Faraco and L. Stephen Miller. The authors would like to thank the anonymous reviewers for their constructive comments and suggestions.
Footnotes
Information Sharing Statement
Source codes of the proposed computational algorithms and sample data sets are available at: http://www.cs.uga.edu/~tliu/neuroinformatics_brainstates.rar
References
- Amunts K, Malikovic A, Mohlberg H, Schormann T, Zilles K. Brodmann’s areas 17 and 18 brought into stereotaxic space-where and how variable? Neuroimage. 2000 Jan;11(1):66–84. doi: 10.1006/nimg.1999.0516. [DOI] [PubMed] [Google Scholar]
- Avants BB, Epstein CL, Grossman M, Gee JC. Symmetric diffeomorphic image registration with cross-correlation: evaluating automated labeling of elderly and neurodegenerative brain. Medical Image Analysis. 2008;12:26–41. doi: 10.1016/j.media.2007.06.004. [DOI] [PMC free article] [PubMed] [Google Scholar]
- Bassett Danielle S, Wymbs Nicholas F, Porter Mason A, Mucha Peter J, Carlson Jean M, Grafton Scott T. Dynamic reconfiguration of human brain networks during learning. PNAS. 2011;108(18):7641–7646. doi: 10.1073/pnas.1018985108. [DOI] [PMC free article] [PubMed] [Google Scholar]
- Beckmann CF, DeLuca M, Devlin JT, Smith SM. Investigations into resting-state connectivity using independent component analysis. Philos Trans R Soc Lond B Biol Sci. 2005;360:1001–1013. doi: 10.1098/rstb.2005.1634. [DOI] [PMC free article] [PubMed] [Google Scholar]
- Biswal BB, et al. Toward discovery science of human brain function. Proceedings of the National Academy of Sciences. 2010 doi: 10.1073/pnas.0911855107. [DOI] [PMC free article] [PubMed] [Google Scholar]
- Bullmore E, Sporns O. Complex brain networks: graph theoretical analysis of structural and functional systems. Nat Rev Neurosci. 2009;10:186–198. doi: 10.1038/nrn2575. [DOI] [PubMed] [Google Scholar]
- Chang C, Glover GH. Time-frequency dynamics of resting-state brain connectivity measured with fMRI. NeuroImage. 2010;50:81–98. doi: 10.1016/j.neuroimage.2009.12.011. [DOI] [PMC free article] [PubMed] [Google Scholar]
- Calhoun VD, Pekar JJ, Pearlson GD. Alcohol intoxication effects on simulated driving: Exploring alcohol-dose effects on brain activation using functional MRI. Neuropsychopharmacology. 2004;29:2097–3017. doi: 10.1038/sj.npp.1300543. [DOI] [PubMed] [Google Scholar]
- Dickerson BC, Sperling RA. Large-scale functional brain network abnormalities in Alzheimer’s disease: Insights from functional neuroimaging. Behavioural Neurology. 2009;21:63–75. doi: 10.3233/BEN-2009-0227. [DOI] [PMC free article] [PubMed] [Google Scholar]
- Faraco CC, Unsworth N, Langley J, Terry D, Li K, Zhang D, Liu T, Miller LS. Complex span tasks and hippocampal recruitment during working memory. NeuroImage. 2011;55(2):773–787. doi: 10.1016/j.neuroimage.2010.12.033. [DOI] [PubMed] [Google Scholar]
- Friston KJ, Harrison L, Penny W. Dynamic causal modeling. Neuroimage. 2003;19:1273–1302. doi: 10.1016/s1053-8119(03)00202-7. [DOI] [PubMed] [Google Scholar]
- Fox MD, Raichle ME. Spontaneous fluctuations in brain activity observed with functional magnetic resonance imaging. Nat Rev Neurosci. 2007;8:700–711. doi: 10.1038/nrn2201. [DOI] [PubMed] [Google Scholar]
- Gao JH, Yee SH. Iterative temporal clustering analysis for the detection of multiple response peaks in fMRI. Magnetic Resonance Imaging. 2003;21:51–53. doi: 10.1016/s0730-725x(02)00627-6. [DOI] [PubMed] [Google Scholar]
- Ge Bao, Guo Lei, Hu Xintao, Han Junwei, Liu Tianming. Resting state fMRI-guided fiber clustering. Medical Image Computing and Computer-Assisted Intervention (MICCAI) 2011 doi: 10.1007/978-3-642-23629-7_19. [DOI] [PubMed] [Google Scholar]
- Gilbert CD, Sigman M. Brain States: Top-Down Influences in Sensory Processing. Neuron. 2007;54:677–696. doi: 10.1016/j.neuron.2007.05.019. [DOI] [PubMed] [Google Scholar]
- Hagmann P, Cammoun L, Gigandet X, Gerhard S, Ellen Grant P, Wedeen V, Meuli R, Thiran JP, Honey CJ, Sporns O. MR connectomics: Principles and challenges. Journal of Neuroscience Methods. 2010;194:34–45. doi: 10.1016/j.jneumeth.2010.01.014. [DOI] [PubMed] [Google Scholar]
- Honey CJ, Sporns O, Cammoun L, Gigandet X, Thiran JP, Meuli R, Hagmann P. Predicting human resting-state functional connectivity from structural connectivity. Proceedings of the National Academy of Sciences. 2009a;106:2035–2040. doi: 10.1073/pnas.0811168106. [DOI] [PMC free article] [PubMed] [Google Scholar]
- Hu X, Deng F, Li K, Zhang T, Chen H, Jiang X, Lv J, Zhu D, Faraco C, Zhang D, Mesbah A, Han J, Hua X, Xie L, Miller S, Guo L, Liu T. Bridging low-level features and high-level semantics via fMRI brain imaging for video classification; Proceedings of the international conference on Multimedia; ACM, Firenze, Italy. 2010. pp. 451–460. [Google Scholar]
- Hu Xintao, Li Kaiming, Han Junwei, Hua Xian-Sheng, Guo Lei, Liu Tianming. Bridging the Semantic Gap via Functional Brain Imaging. IEEE Transactions on Multimedia. 2011 in press. [Google Scholar]
- Hu X, Guo L, Zhang D, Li K, Zhang T, Lv J, Han J, Liu T. Assessing the Dynamics on Functional Brain Networks using Spectral Graph Theory. ISBI. 2011 [Google Scholar]
- Kennedy David N. Making Connections in the Connectome Era. Neuroinformatics. 2010;8(2):61–62. doi: 10.1007/s12021-010-9070-1. [DOI] [PubMed] [Google Scholar]
- Li K, Guo L, Li G, Nie J, Faraco C, Zhao Q, Miller LS, Liu T. Cortical surface based identification of brain networks using high spatial resolution resting state FMRI data. Proceedings of the 2010 IEEE international conference on Biomedical imaging: from nano to Macro; IEEE Press, Rotterdam, Netherlands. 2010. pp. 656–659. [Google Scholar]
- Li Xiang, Lim Chuwoo, Li Kaiming, Guo Lei, Liu Tianming. Fiber-centered Granger Causality Analysis. MICCAI. 2011 doi: 10.1007/978-3-642-23629-7_31. [DOI] [PubMed] [Google Scholar]
- Li Kaiming, Guo Lei, Zhu Dajiang, Hu Xintao, Han Junwei, Liu Tianming. Individual Functional ROI Optimization via Maximization of Group-wise Consistency of Structural and Functional Profiles. Neuroinformatics. 2012 doi: 10.1007/s12021-012-9142-5. in press. [DOI] [PMC free article] [PubMed] [Google Scholar]
- Lindquist MA, Waugh C, Wager TD. Modeling state-related fMRI activity using change-point theory. NeuroImage. 2007;35:1125–1141. doi: 10.1016/j.neuroimage.2007.01.004. [DOI] [PubMed] [Google Scholar]
- Liu T, Li H, Wong K, Tarokh A, Guo L, Wong STC. Brain tissue segmentation based on DTI data. NeuroImage. 2007;38:114–123. doi: 10.1016/j.neuroimage.2007.07.002. [DOI] [PMC free article] [PubMed] [Google Scholar]
- Liu T, Nie J, Tarokh A, Guo L, Wong S. Reconstruction of Central Cortical Surface from MRI Brain Images: Method and Application. NeuroImage. 2008;40(3):991–1002. doi: 10.1016/j.neuroimage.2007.12.027. [DOI] [PMC free article] [PubMed] [Google Scholar]
- Liu Tianming. A few thoughts on brain ROIs. Brain Imaging and Behavior. 2011 doi: 10.1007/s11682-011-9123-6. in press. [DOI] [PMC free article] [PubMed] [Google Scholar]
- Lim Chulwoo, Li Xiang, Li Kaiming, Guo Lei, Liu Tianming. Brain State Change Detection via Fiber-centered Functional Connectivity Analysis. International Symposium of Biomedical Imaging (ISBI); 2011. [Google Scholar]
- Lv J, Guo L, Hu X, Zhang T, Li K, Zhang D, Yang J, Liu T. Fiber-Centered Analysis of Brain Connectivity Using DTI and Resting State FMRI Data. In: Jiang T, Navab N, Pluim J, Viergever M, editors. Medical Image Computing and Computer-Assisted Intervention – MICCAI 2010. Springer; Berlin/Heidelberg: 2010. pp. 143–150. [DOI] [PubMed] [Google Scholar]
- Lynall ME, Bassett DS, Kerwin R, McKenna PJ, Kitzbichler M, Muller U, Bullmore E. Functional connectivity and brain networks in schizophrenia. J Neurosci. 2010 Jul 14;30(28):9477–87. doi: 10.1523/JNEUROSCI.0333-10.2010. [DOI] [PMC free article] [PubMed] [Google Scholar]
- Majeed W, Magnuson M, Hasenkamp W, Schwarb H, Schumacher EH, Barsalou L, Keilholz SD. Spatiotemporal dynamics of low frequency BOLD fluctuations in rats and humans. NeuroImage. 2011;54:1140–1150. doi: 10.1016/j.neuroimage.2010.08.030. [DOI] [PMC free article] [PubMed] [Google Scholar]
- Morgan VL, Price RR, Arain A, Modur P, Abou-Khalil B. Resting functional MRI with temporal clustering analysis for localization of epileptic activity without EEG. NeuroImage. 2004;21:473–481. doi: 10.1016/j.neuroimage.2003.08.031. [DOI] [PubMed] [Google Scholar]
- Passingham RE, Stephan KE, Kotter R. The anatomical basis of functional localization in the cortex. Nat Rev Neurosci. 2002;3:606–616. doi: 10.1038/nrn893. [DOI] [PubMed] [Google Scholar]
- Robinson LF, Wager TD, Lindquist MA. Change point estimation in multi-subject fMRI studies. NeuroImage. 2010;49:1581–1592. doi: 10.1016/j.neuroimage.2009.08.061. [DOI] [PMC free article] [PubMed] [Google Scholar]
- Saxe R, Brett M, Kanwisher N. Divide and conquer: a defense of functional localizers. Neuroimage. 2006;1;30(4):1077–87. doi: 10.1016/j.neuroimage.2005.12.062. [DOI] [PubMed] [Google Scholar]
- Shen Dinggang, Davatzikos Christos. HAMMER: hierarchical attribute matching mechanism for elastic registration. IEEE Trans on Medical Imaging. 2002;21(11):1421–1439. doi: 10.1109/TMI.2002.803111. [DOI] [PubMed] [Google Scholar]
- Smith Stephen M, Miller Karla L, Salimi-Khorshidi Gholamrez, Webster Matthew, Beckmann Christian F, Nichols Thomas E, Ramsey Joseph D, Woolrich Mark W. Network modelling methods for FMRI. NeuroImage. 2011;54:875–891. doi: 10.1016/j.neuroimage.2010.08.063. [DOI] [PubMed] [Google Scholar]
- Sporns O, Tononi G, Kötter R. The Human Connectome: A Structural Description of the Human Brain. PLoS Comput Biol. 2005;1:e42. doi: 10.1371/journal.pcbi.0010042. [DOI] [PMC free article] [PubMed] [Google Scholar]
- Thompson PM, Toga AW. A surface-based technique for 1336 warping 3-dimensional images of the brain. IEEE Transaction on Medical Imaging. 1996;15(4):1–16. doi: 10.1109/42.511745. [DOI] [PubMed] [Google Scholar]
- Tsunoda K, Yamane Y, Nishizaki M, Tanifuji M. Complex objects are represented in macaque inferotemporal cortex by the combination of feature columns. Nat Neurosci. 2001;4:832–838. doi: 10.1038/90547. [DOI] [PubMed] [Google Scholar]
- Van Dijk KRA, Hedden T, Venkataraman A, Evans KC, Lazar SW, Buckner RL. Intrinsic Functional Connectivity As a Tool For Human Connectomics: Theory, Properties, and Optimization. Journal of Neurophysiology. 2010;103:297–321. doi: 10.1152/jn.00783.2009. [DOI] [PMC free article] [PubMed] [Google Scholar]
- Wang L, Zang Y, He Y, Liang M, Zhang X, Tian L, Wu T, Jiang T, Li K. Changes in hippocampal connectivity in the early stages of Alzheimer’s disease: Evidence from resting state fMRI. Neuroimage. 2006;31:496–504. doi: 10.1016/j.neuroimage.2005.12.033. [DOI] [PubMed] [Google Scholar]
- Zalesky A, Fornito A, Bullmore ET. Network-based statistic: Identifying differences in brain networks. NeuroImage. 2010;53:1197–1207. doi: 10.1016/j.neuroimage.2010.06.041. [DOI] [PubMed] [Google Scholar]
- Zang Y, Jiang T, Lu Y, He Y, Tian L. Regional homogeneity approach to fMRI data analysis. NeuroImage. 2004;22:394–400. doi: 10.1016/j.neuroimage.2003.12.030. [DOI] [PubMed] [Google Scholar]
- Zhang T, Guo L, Hu X, Li K, Jin C, Cui G, Li L, Liu T. Predicting Functional Cortical ROIs based on Fiber Shape Models. Cerebral Cortex. 2011 doi: 10.1093/cercor/bhr152. in press. [DOI] [PMC free article] [PubMed] [Google Scholar]
- Zhu Dajiang, Li Kaiming, Faraco Carlos, Deng Fan, Zhang Degang, Jiang Xi, Chen Hanbo, Guo Lei, Miller Stephen, Liu Tianming. Optimization of Functional Brain ROIs via Maximization of Consistency of Structural Connectivity Profiles. NeuroImage. 2011 doi: 10.1016/j.neuroimage.2011.08.037. in press. [DOI] [PMC free article] [PubMed] [Google Scholar]
- Dajiang Zhu*, Kaiming Li*, Lei Guo, Xi Jiang, Tuo Zhang, Degang Zhang, Hanbo Chen, Fan Deng, Carlos Faraco, Changfeng Jin, Chong-Yaw Wee, Yixuan Yuan, Peili Lv, Yan Yin, Xiaolei Hu, Lian Duan, Xintao Hu, Junwei Han, Lihong Wang, Dinggang Shen, L Stephen Miller, Lingjiang Li, Tianming Liu, DICCCOL: Dense Individualized and Common Connectivity-based Cortical Landmarks, *Joint first authors, accepted, Cerebral Cortex, 2012.


