Abstract
Functional magnetic resonance imaging (fMRI) time series is non-linear and composed of components at multiple temporal scales, which presents significant challenges to its analysis. In the literature, significant effort has been devoted into model-based fMRI signal analysis, while much less attention has been directed to data-driven fMRI signal analysis. In this paper, we present a novel data-driven multi-scale signal decomposition framework named Empirical Mean Curve Decomposition (EMCD). Targeted on functional brain mapping, the EMCD optimizes mean envelopes from fMRI signals and iteratively extracts coarser-to-finer scale signal components. The EMCD framework was applied to infer meaningful low-frequency information from Blood Oxygenation Level Dependent (BOLD) signals from resting state fMRI, task-based fMRI, and natural stimulus fMRI, and promising results are obtained.
Index Terms: Time series analysis, functional brain imaging, resting state fMRI, task-based fMRI, natural stimulus fMRI
I. Introduction
FMRI has made remarkable impacts on how we study the function of the brain [1–3]. In the literature, a variety of model-driven or data-driven approaches have been developed for fMRI time series signal processing and analysis, such as the generalized linear models (GLM) [4], wavelet algorithms [5], [6], Markov random field (MRF) models [7], mixture models [8], autoregressive spatial models [9], Bayesian approaches [10], and independent component analysis (ICA) [11], [12]. Although these approaches have their own advantages in various applications [4]-[12], the characteristics of non-linearity and composition of signal components at multiple time scales in fMRI BOLD signals present significant challenges to the inference of meaningful information from fMRI BOLD time series. In addition, fMRI BOLD signal might be subject to physiological motion effect or non-neuronal noise [1], [2]. As such, non-linearity and low signal-to-noise ratio are common in fMRI time series data [1], [2], which further entails the decomposition of fMRI BOLD signal into meaningful components and random noise residue.
In the signal processing community, empirical mode decomposition (EMD) [13]-[15] has been recognized as an effective data-driven signal decomposition approach and has been widely used in multi-scale signal analysis [16]. The EMD algorithm was initially proposed to study ocean waves [13], and has been applied in solving biomedical signal processing problems [17]-[21], e.g., in [17] for field potential recording analysis and in [20] for task-based fMRI activation detection. In brief, EMD extracts intrinsic mode functions (IMFs) by iteratively removing mean curves from the input time series (or the residue in subsequent iterations) until the residue becomes an IMF. EMD features a unique decomposition scheme that the IMFs are derived from the time series data directly without prior domain knowledge. Therefore, it is adaptive, in contrast to wavelet or Fourier analysis where the basis functions are predefined in advance.
The data-driven manner of decomposing time series makes EMD a powerful tool in analyzing many types of time series data. In spite of EMD’s superiority over many model-based decomposition methods, direct applications of EMD in fMRI BOLD signal analysis might not be appropriate for several reasons. The major issue is the strict constraints of IMF which forces all components extracted by EMD to be (1) narrow-band limited; and (2) with zero local mean. These constraints ease theoretical analysis and provide a fairly simplified model of the components of prospect. In fMRI time series analysis, as well as many other biomedical applications, however, the ultimate goal of signal decomposition is to reconstruct the intrinsic, biologically meaningful components rather than mathematically defined ones. In particular, EMD extracts higher-frequency components first, employing a finer-to-coarser scheme. In fMRI time series analysis, the major noise source is of high frequency while low-frequency global drifting are typically overcome by detrend algorithms [22]. Accordingly, the EMD decomposition results are unstable due to its unavoidable error in extracting the highest-frequency component. Thus, the error accumulates rapidly in subsequent iterations. When it reaches the most desirable scale in the low-frequency bands [1], [23], the component might have been deteriorated by the accumulated error.
In response to the major limitations of applying EMD in fMRI time series analysis and meanwhile inspired by this data-driven signal decomposition methodology, the focus of this paper is to present and evaluate a novel multi-scale, iterative signal decomposition framework named Empirical Mean Curve Decomposition (EMCD), to deal with the above issues in fMRI signal decomposition. The EMCD algorithm calculates both the superior and inferior envelopes in each iteration of signal decomposition (Fig. 1(a)), applies a scale control algorithm to optimize the envelopes, and extracts the mean curve by averaging the superior and inferior envelopes. This algorithm is iteratively applied on the residue signal, which is the subtraction of the extracted mean curve from the original signal (more details in Section II).
Fig 1.
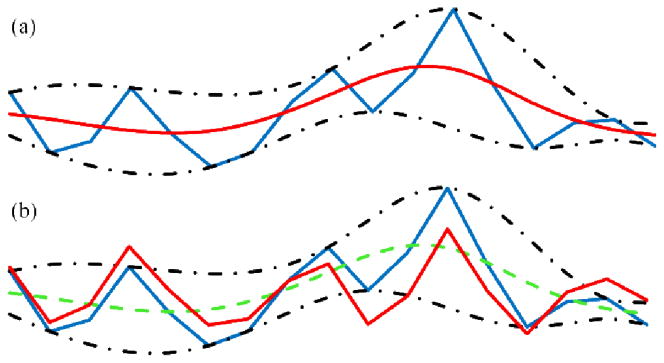
A conceptual comparison between EMCD (a) and EMD (b). For both (a) and (b) the blue curve is original time series, and its superior and inferior envelopes are depicted as black dashed curves. (a) Red curve: extracted mean curve components in EMCD. (b) Red curve: extracted IMF in EMD. Notice that EMCD takes advantage of extrema optimization to improve the decomposition, which does not exist in EMD.
Our contributions are summarized in the following five aspects. (1) EMCD extracts and uses the mean curve (red curve in Fig. 1(a)) as the useful signal while the residue signal is used in subsequent signal decompositions. In short, EMCD extracts coarser-to-finer scale signals, reducing the error accumulation against useful low-frequency components. (2) A scale control algorithm was designed and implemented to deal with the instability as of the sparse distribution of extrema causing problems in interpolating and recovering superior and inferior envelopes, thus improving the accuracy and reliability of the decomposition procedure. In addition, this algorithm makes it possible to moderately control the scale at which the extracted component will be, which is helpful when some prior knowledge of the intrinsic signal composition is present (details in Section III-D). (3) The low-frequency mean curves extracted by EMCD, instead of high-frequency IMFs by EMD, are what we need to reconstruct in fMRI. For instance, in resting state fMRI analysis, we aim to reconstruct the neuronal oscillation signals in the range of 0.01Hz to 0.1Hz [3], [23], which is in the low-frequency bands. Therefore, the mean curve extraction in the proposed EMCD method fulfills the requirements of resting state fMRI time series analysis, while the IMFs from EMD do not. (4) We successfully applied EMCD in processing and analyzing fMRI time series data, including resting state fMRI [22]-[23], task-based fMRI [24], [25], and natural stimulus fMRI [26], [27], [56]. (5) The EMCD framework has been extensively evaluated and validated by synthesized signals, independent diffusion tensor imaging (DTI) data, comparison with other methods, and verification by neuroscience domain knowledge.
II. Empirical Mean Curve Decomposition
A general flowchart of the EMCD decomposition algorithm is shown in Fig. 2. The algorithm decomposes a time series in a multi-scale, data-driven manner. Briefly, the maxima (Step 2) and minima (Step 3) are extracted from the input time series (Step 1). They are optimized (Step 4, Step 5) by a local scale control algorithm and are interpolated to form superior envelope (Step 6) and inferior envelope (Step 7), respectively. The local scale control algorithm moderately controls the scale to which the time series is decomposed. The mean curve (Step 8) as the output is calculated by averaging both envelopes. This decomposition algorithm is iteratively applied to the input time series (in its first iteration) and the residues (in the following iterations). Details will be covered in the subsequent sections.
Fig 2.
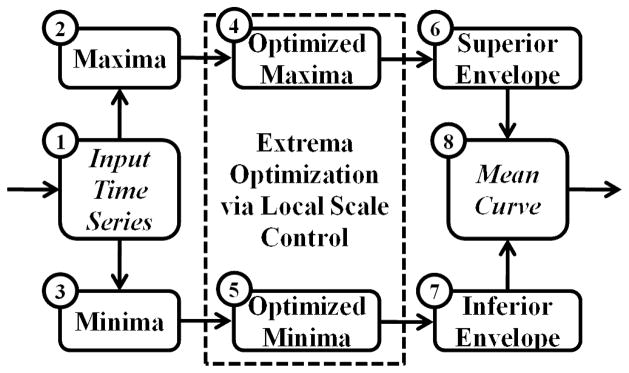
A general flowchart of the algorithm.
A. EMCD Basics
Let {x[n], n=1, …, N} be an N-element time series which we will refer to as x[n]. {(pi, x[pi]), i=1, …, Np} is the maxima series of x[n], where pi is the time index and Np is the number of maxima; {(qi, x[qi]), i=1, …, Nq} is the minima series of x[n], where qi is the time index and Nq is the number of minima; B{(xi, yi), x0} is the widely used B-spline interpolation function which interpolates the input series (xi, yi) at the time point x0.
Superior Envelope
The superior envelope of a time series is the upper trend curve that passes through all of its maxima (the purple one in Fig. 3). The B-spline interpolation is used to interpolate the maxima:
| (1) |
Fig 3.
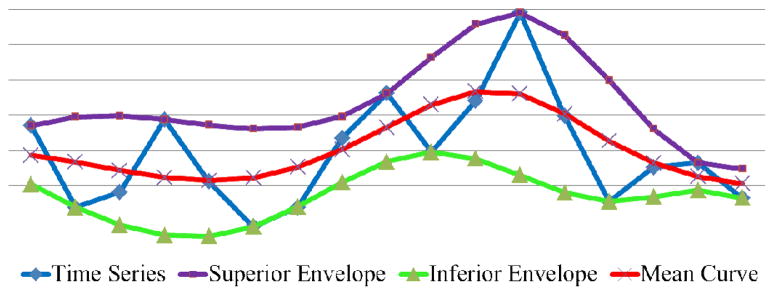
An example of superior envelope, inferior envelope, and mean curve.
Inferior Envelope
Similarly, the inferior envelope of a time series is the lower trend curve that passes through all of its minima (the green one in Fig. 3). Similarly, the B-spline interpolation is used to interpolate the minima:
| (2) |
Mean Curve
The mean curve of a time series is the average of its superior and inferior envelopes (red in Fig. 3) representing the global trend:
| (3) |
The notations introduced above are illustrated in Fig. 3.
Mode
The mode of a time series is defined as the average of the number of its maxima Np and that of its minima Nq:
| (4) |
Empirical Wave Form
The fact that the mean curve is determined by the extrema provides a new way to model time series. Here we introduce the concept of Empirical Wave Form (EWF). An EWF is a series of alternating maxima and minima. A simplified EWF is defined as follows:
| (5) |
Then we can use an EWF to represent a mean curve, while the mode of which, M(x[n]), characterizes this EWF. In principle, one complete sine wave cycle has one maximum and one minimum, contributing exactly one to its mode. Hence the mode of a EWF behaves like the number of complete cycles in traditional Fourier analysis. We derive the empirical period for the above EWF as:
| (6) |
while the empirical frequency is given by:
| (7) |
These concepts are listed in Table I in conjunction with their corresponding terms in traditional Fourier analysis for comparison.
Table I.
Comparison of Concepts
| Concept | Empirical Wave Form | Fourier Analysis |
|---|---|---|
| Form | x[n], (pi, x[pi]), (qj, x[qj]) | y[n], sin(ωn) |
| Period | N/M(x[n]) | 2π/ω |
| Frequency | M(x[n])/N | ω/2π |
It should be noted that empirical period and empirical frequency are temporal estimations over the entire time series rather than the exact model parameters as in traditional Fourier analysis. This relaxation of conditions improves the descriptive abilities such that a wider class of signals from the oscillatory sources can be modeled, e.g., neurons and brain regions, whose signals are like, but not the same as, sine waves. As a comparison, the Fourier analysis decomposes this type of time series into a set of sine waves at different frequencies, and the wavelet transform decomposes them into a set of wavelets at multiple frequencies and different temporal locations.
Theoretically, any time series can be modeled as an EWF once we have extracted the extrema, so is any part of an existing time series. Considering the local properties of the time series, we define local scale as the local period of a cycle. Here by “cycle” we refer to the time range of a pair of adjacent maximum and minimum. For a time series with multiple components in the form of riding waves, the local scale descriptor may vary largely at different cycles within the time series. In order to effectively model the time series, we process the time series in its empirical wave form to recover the singular EWF components without riding waves, in which a local scale control algorithm is employed to optimize the EWF. We refer to the recovered singular EWF components as “pure” EWFs.
In short, the goal of the proposed EMCD algorithm is to decompose the time series at different scale levels, yielding a composition of pure EWFs. In that sense, the EWFs are the basis functions in EMCD, compared to the sine waves in Fourier analysis and the wavelets in wavelet transforms. These empirical basis functions, however, require no prior knowledge of the signal model and are thus purely data-driven. Orthogonality, therefore, is not guaranteed.
B. The Iterative Process
The main procedure of EMCD is the iterative decomposition process, which is applied on the input time series to produce the mean curve as the output.
Extrema Extraction
The algorithm extracts both maxima and minima as the initial step of the iterative process.
Local Scale Control
This step of the algorithm controls the local scale of the extrema. Recall that by “local scale” we refer to the period length of a certain cycle. Furthermore, as cycles are determined by extrema, we control the local scale by inserting extrema time points, since the extracted extrema are data-dependent and are not to be modified. Basically, the local scale controls how much alike we want the extracted mean curve and the input time series to be, since the reconstruction of envelopes depends solely on the extracted extrema. The local scale control procedure was specifically designed for the situation where two adjacent extrema are very far away. Since our decomposition algorithm depends heavily on the detection of extrema, it may yield undesirable results in the presence of adjacent extrema that are far away. With local scale control and prior knowledge of the scale of the desired components, it is possible to recover the components correctly.
Our local scale control procedure applies to both maxima and minima with the same method. Taking maxima as an example, for each pair of adjacent maxima, the number of time points they are apart is calculated as the distance of the pair. By definition, this distance is the local scale. If it is larger than a pre-selected scale threshold, we need to insert a certain number of new nodes as the “interpolated” maxima between the two real ones. This process controls the local scale at each maximum.
Specifically, suppose the maxima pair, (x[u], x[v]), u<v, are currently in consideration. The distance is calculated as:
| (8) |
Let S be the scale threshold. We calculate the number of new nodes to insert and their locations as:
| (9) |
| (10) |
Unlike the indices u and v, the locations L[n] need not to be rounded to integers since those inserted nodes will be used only in the interpolation procedure. Meanwhile, the amplitudes at these nodes are derived from the following Gaussian model:
| (11) |
| (12) |
where E[u] is the estimate of the amplitude difference at maximum x[u] between the expected mean curve and the original time series; E[v] is the estimated amplitude difference at maximum x[v]; σ is the scaling parameter of the Gaussian model which controls the shape; G[t] is the Gaussian model; the estimated difference in amplitude at L[n] between the expected mean curve and the original time series is given by Δ[L[n]]. The amplitude difference estimates can be derived from smoothing the time series. Therefore, the amplitude for the nth interpolated node is:
| (13) |
Interpolation
Once we have the optimized extrema from the previous step, B-spline interpolation is utilized to obtain the superior envelope and inferior envelope. The output mean curve is obtained by averaging both envelopes.
C. The Decomposition Framework
Having obtained a mean curve, C, we employ a practical strategy to determine whether this is a valid pure EWF. The extracted mean curve is simply decomposed one more time into C′ and residue R′ (C=C′+R′). C is considered as a valid pure EWF only if either of the following criteria is not met:
The different between M(C′) and M(R′) (Equation 4) is larger than a given threshold;
The variance values of both C′ and R′ are larger than a given threshold.
The first criterion confirms that a riding wave exists in C; and the second ensures that both C′ and R′ are statistically non-trivial. If either of the two criteria is not met, C is a valid pure EWF or useless residue; otherwise, we continue the test using C′. Depending on the complexity of the data, this process might be repeated a few times until the riding wave diminishes, which must happen because of the nature of the decomposition method.
After each iteration, the residue is also tested for variance conditions. If the variance of the residue after an iteration is too low, the algorithm terminates to avoid generating trivial components. Therefore, the input time series, X[n], is decomposed into a number of pure EWFs (EMCD components) and a residue (which is an EWF as well). The number of extracted pure EWFs depends on the data and the local scale threshold. In summary, we have:
| (14) |
where NEWF is the number of extracted pure EWFs; the residue is rewritten as C[NEWF+1]. The original time series is merely the addition of all the decomposed EWFs. As an example, depicted in Fig. 4 is a decomposition of an fMRI BOLD time series.
Fig 4.
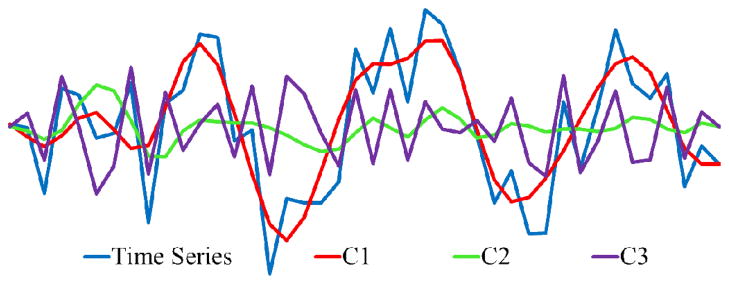
A full EMCD decomposition of an fMRI BOLD time series into three EWFs. C1 and C2 are the first and second components and C3 is the residue.
It should be noted that the largest scale (the first component) is data-dependent. A further decomposition of the first component yields even larger scale components (Section III-D).
In comparison with EMD, EMCD focuses on improving the extraction of components at a low frequency or coarser scale. This is especially useful in fMRI analysis where the major noise source is of higher frequency, which typically forms the residue in EMCD results.
III. Results
Four experiments are designed and implemented to evaluate and validate the proposed EMCD framework.
A. EMCD on Synthesized Time Series
In this experiment, we aim to evaluate EMCD on signal recovery in the presence of noise, and compare it with EMD and wavelet transform, both of which are well-established multi-scale signal decomposition methods.
Experiment Data
We synthesized time series by adding a sine wave and random noise:
| (15) |
where ω1−1(*) is a random noise generator whose output resides in the range of −1 to 1. The advantage of using synthesized signal is that it provides quantitative benchmarking for comparing decomposition results.
Decomposition
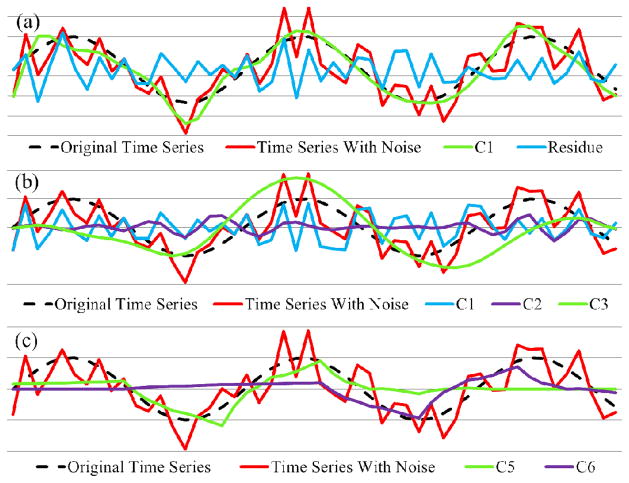
The synthesized time series was decomposed using EMCD, EMD, and Daubechies wavelet transform as shown in Fig. 5(a), 5(b), and 5(c), respectively. The dark dashed curve is the original time series without noise, i.e. sin(n/3). The synthesized time series with noise is colored in red. Note that only non-trivial components are plotted in the figure. The shown components include C1 and the residue from the proposed EMCD framework (Fig. 5(a)), C1 and C3 from EMD (Fig. 5(b)), and C5 and C6 from the wavelet transform (Fig. 5(c)).
Fig 5.
Comparisons of time series decomposition on synthesized time series. (a) EMCD results; (b) EMD results; (c) results from Daubechies wavelet transform. Notice that we only plotted the non-trivial components. In all subfigures, dark dashed curves refer to the original time series (the sine wave); red: time series with random noise; green: the most representative component as C1 from EMCD, C3 from EMD and C5 from wavelet transform.
It is evident that the proposed EMCD decomposition component C1 matches the benchmark sine wave with high accuracy. In contrast, the result of EMD suffers from the algorithm’s instability to noise because it extracts high frequency components first and accumulates error quickly in subsequent sifting processes, as demonstrated in Fig. 5(b). In Fig. 5(c), it is evident that the wavelet transform can hardly recover the original shape since it is model-driven and the basis functions can hardly match the signal shapes in the data without prior information. All it generates are linear combinations of its basis functions, as shown in Fig. 5(c).
The choice to select the first EMCD component as the representing one is empirical rather than theoretically supported at current stage. In this synthesized time series experiment, the first component has the right scale that is comparable to that of the sine wave model. The same situation occurs in Section III-B and Section III-C. In other applications, e.g., natural stimulus fMRI, choosing the right scale becomes non-trivial when the external stimulus feature curves have a much higher sampling rate than that of fMRI time series [27], [56]. To ensure comparisons between components at the same scale, further analysis is essential (Section III-D).
Quantitative comparison
Quantitatively, we compared EMCD and EMD in measuring Pearson correlation of 100 synthesized time series with random noise and the original sine wave. The results are shown in Fig. 6, from which we can see that EMCD achieves substantially better correlation results consistently. Specifically, the mean and variance are 0.904 and 0.001 for EMCD results; and 0.537 and 0.023 for EMD results. The wavelet method was not included in this correlation analysis experiment since it is model-driven, which could bias the comparison results.
Fig 6.
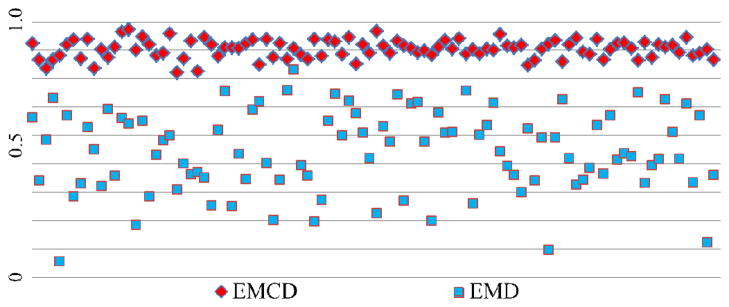
Comparison between EMCD and EMD in measuring the Pearson correlation of 100 synthesized time series with random noise and the original sine wave.
To summarize this section, both qualitative and quantitative evaluations using synthesized time series signals with ground-truth demonstrated that the proposed EMCD framework has superior performance in extracting meaningful true components from contaminated signals.
B. EMCD in Resting State fMRI Analysis
In this experiment, we applied the EMCD framework in resting state fMRI [22], [23], [28]-[30] analysis to discover the multi-scale correlation structure as well as the spectral characteristics of EWFs in the resting state frequency bands.
Experiment Data
Nine healthy volunteers were scanned in a GE 3T Signa MRI system (GE Healthcare, Milwaukee, WI) using an 8-channel head coil at the Bioimaging Research Center (BIRC) of the University of Georgia (UGA) under IRB approval. The experiments were undertaken with the understanding and written consent of each subject. Resting state fMRI data were acquired with dimensionality 128*128*60*100, spatial resolution 2mm*2mm*2mm, TR 5s, TE 25ms, and flip angle 90 degrees. Standard pre-processing procedures were applied, including brain skull removal, motion correction, spatial smoothing, temporal pre-whitening, slice time correction, and global drift removal (the same as in [22], [31]). DTI data were acquired using the same spatial resolution as that of resting state data, with TR 15.5s, TE 89.5ms, 30 DWI gradient directions, and 3 B0 volumes. Standard pre-processing procedures were applied, including brain skull removal, motion correction, and eddy current correction. Fiber tracking was performed using MEDINRIA [32] (FA threshold: 0.2; minimum fiber length: 20; sampled by four). We used DTI as the standard space by registering resting state data to the DTI space [22], [25], [33].
Correlation Structure of EWFs
With the proposed decomposition framework, we are able to measure the EWFs correlation structure between two fMRI time series in a multi-scale manner. Suppose we have two resting state fMRI time series X and Y. They are decomposed using EMCD as:
| (16) |
| (17) |
Then, their correlation structure is given in the form of a matrix (PC stands for Pearson correlation):
| (18) |
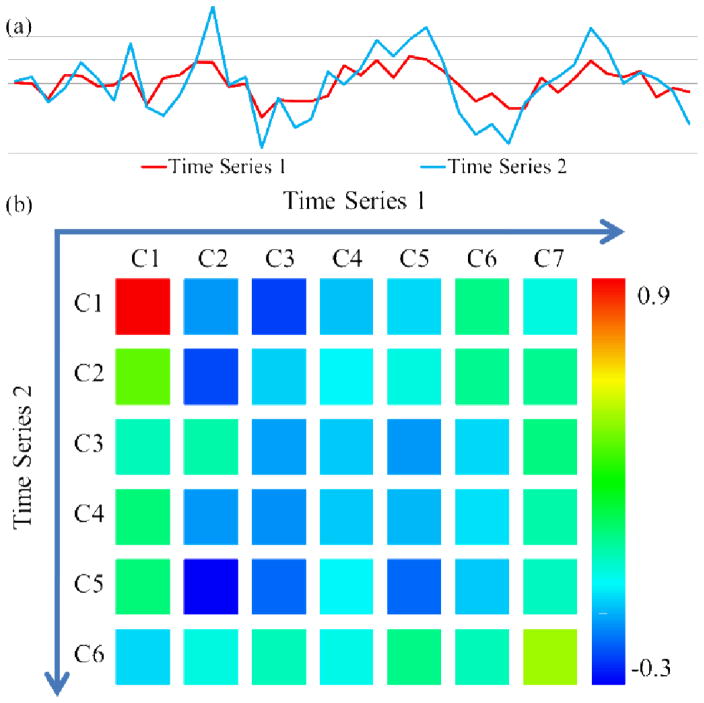
Fig. 7 shows an example of the EWFs correlation structure between two resting state fMRI time series [34]. Elements colored in red or green indicate stronger correlation. As we can see from Fig. 7, this matrix reveals the scales the two time series are most correlated at. This capability has wide applications in measuring the functional connectivities between resting state fMRI signals at different frequencies [16] in the future.
Fig 7.
Correlation structure between two time series. (a) the two time series; (b) the correlation structure matrix. There are 6 components and a residue for time series 1, and 5 components and a residue for time series 2. The color bar is on the right.
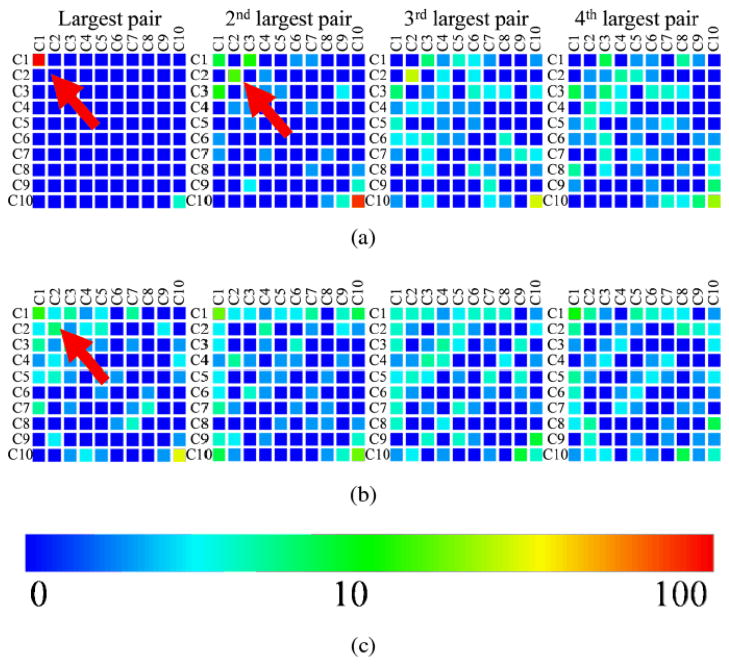
We conducted additional experiments to evaluate this multi-band correlation structure analysis on more resting state fMRI data as shown in Fig. 8. Two groups of time series pairs were selected. Group A contains 100 randomly selected time series pairs from voxels with strong white matter fiber connections derived from DTI data [31], while group B contains 100 randomly selected time series pairs from voxels without white matter fiber connections. The functional connectivity strengths were originally measured by Pearson correlation [31]. Here, for each time series pair, we estimated its multi-band functional correlation structure using EMCD. Taken column 2 in Fig. 8 as an example, the colors of the elements in the matrices indicate the numbers of cases out of 100 that have their second largest functional correlation values at the corresponding EMCD component pairs. Notice that the extracted EMCD components may be more than ten, which is the dimension of the matrix. We merged all elements beyond that limit to the right-bottom one within the matrix. As shown in Fig. 8, the EMCD revealed interesting characteristics of the two types of time series pairs: (1) for time series from voxels with strong DTI-derived white matter fiber connections, more than 90% of its largest functional correlation values resides in C1-C1 pair (left panel in Fig. 8), while the largest functional correlation values of time series from voxels without white matter fiber connections have a sparse distribution as indicated by the red arrows in Fig. 8(b); (2) the distributions of the 3rd and 4th largest pairs are alike in both time series pairs. We interpret that the observed differences between the two types of time series pairs in Fig. 8 might originate from the intrinsic characteristics of the time series. As of the pairs with structural fiber connections, the time series pairs in group A are strongly correlated and the correlation structures concentrate on a few scales. The time series pairs in group B, however, are not associated with fiber connections and are thus weakly correlated, the correlation structures of which are therefore displaying a sparsely distributed pattern.
Fig 8.
These matrices show the corresponding correlation pair distributions in the correlation structures with the color bar (logarithm scale) at bottom. (a) Time series pairs with white matter fiber connections; (b) Time series pairs without white matter fiber connections; (c) The logarithmic color bar representing the number of time series.
This result is quite reasonable, considering the close relationship between structural and functional connectivities in the human brain [35], [36]. Thus, given the lack of ground-truth data in fMRI, this cross-validation result based on independent DTI-derived structural connection patterns strongly support the biological meanings of our EMCD framework and the decomposed EWFs.
Spectral Characteristics
In comparison with the traditional low-pass filters commonly used in the signal processing community, EMCD naturally forms a band-pass filter whose spectrum response is non-linear and data-driven. An example is shown in Fig. 9, from which we can see that the extracted different EWFs are separated in the Fourier frequency domain. This figure provides an intuition of how EMCD works in decomposing resting state fMRI signals in the frequency domain.
Fig 9.
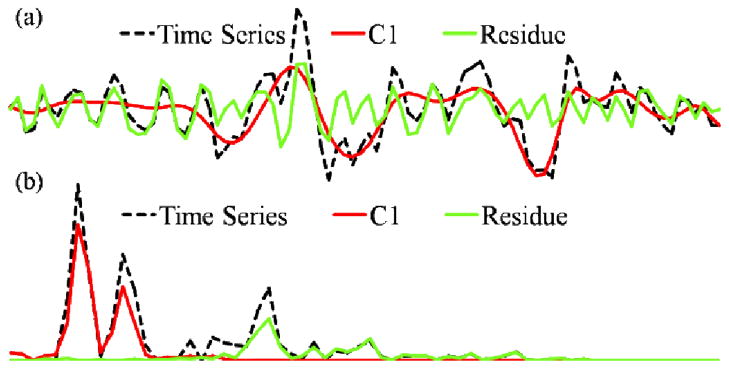
(a) Decomposition of a resting state fMRI time series (only C1 and the residue are plotted); (b) Fourier spectrum plots.
With the notation of EWF, we can calculate the empirical frequency for each extracted EWF component. Fig. 10 shows the statistics of empirical frequency distributions of resting state time series from grey matter voxels in one human brain as an example. Specifically, the resting state fMRI time series were decomposed into three EWFs. In Fig. 10, the horizontal axis refers to the empirical frequency, and the vertical axis refers to the percentage of time series at the corresponding empirical frequency. For each EWF component, the distribution of empirical frequency shows a Gaussian-like pattern. We analyzed other eight brains with resting state fMRI data and found similar patterns. Table II summarizes the distributions of empirical frequency patterns. In all the subjects we analyzed, the overall average empirical frequency of C1 is 0.018 Hz; for C2 it is 0.026Hz; and for C3 it is 0.053 Hz. These frequency distributions are quite consistent with the reports in the resting state fMRI literature [2], [23].
Fig 10.
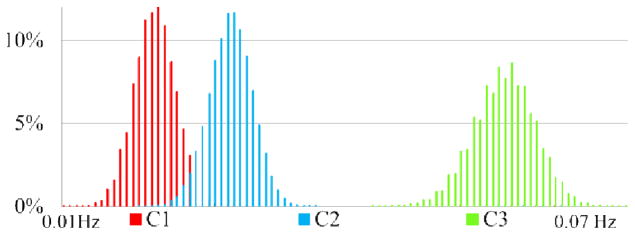
Empirical frequency statistics of resting state fMRI data. Horizontal axis refers to the empirical frequency; vertical axis refers to the percentage of time series at the corresponding empirical frequency.
Table II.
Distributions of Empirical Frequency
| Subject | C1 | C2 | C3 | |||
|---|---|---|---|---|---|---|
| Mean | Stdev | Mean | Stdev | Mean | Stdev | |
| 1 | 0.020 | 0.06% | 0.028 | 0.06% | 0.057 | 0.07% |
| 2 | 0.017 | 0.06% | 0.025 | 0.07% | 0.052 | 0.09% |
| 3 | 0.017 | 0.07% | 0.025 | 0.07% | 0.053 | 0.09% |
| 4 | 0.017 | 0.07% | 0.025 | 0.07% | 0.052 | 0.10% |
| 5 | 0.018 | 0.07% | 0.026 | 0.07% | 0.053 | 0.09% |
| 6 | 0.018 | 0.07% | 0.026 | 0.07% | 0.053 | 0.09% |
| 7 | 0.019 | 0.08% | 0.027 | 0.07% | 0.054 | 0.09% |
| 8 | 0.016 | 0.07% | 0.024 | 0.07% | 0.052 | 0.10% |
| 9 | 0.017 | 0.07% | 0.025 | 0.07% | 0.051 | 0.10% |
| Mean | 0.018 | 0.026 | 0.053 | |||
| Stdev | 0.001 | 0.001 | 0.002 | |||
Importantly, it is also evident in Fig. 10 that the variation of frequency distributions of resting state fMRI signals across different brains is remarkable, as demonstrated by the standard deviations of the three Gaussian distributions. This variation imposes significant difficulty in selecting the best upper and lower band-limits when designing traditional low-pass or band-pass filters for decomposing the fMRI signals. In contrast, our data-driven EMCD decomposition method is adaptive to data itself and provides superior flexibility in fMRI signal decomposition, which is the major advantage of the proposed EMCD framework.
C. EMCD in Task-based fMRI Analysis
Task-based fMRI is very useful in localizing function regions of interests (ROIs) in the human brain and is widely used in the brain imaging community [1], [2], [4]. In this experiment, we decomposed the task-based fMRI BOLD time series [26], [27], [56] using the proposed EMCD framework, and compared the decomposed components with the result provided by FSL FEAT [37], which is widely used in the community. The pre-processing steps of task-based fMRI BOLD signals were based on published methods in [24], [25] and the auditory task-based fMRI data [26], [27], [56] was used in this paper. In total we have four subjects with auditory task-based fMRI data.
Decomposition
Fig. 11 shows an example of EMCD decomposition of task-based fMRI time series. We can see that the first EMCD component C1 closely matches the FEAT BOLD model, which is a convolution of the Hemodynamic Response Function (HRF) with a linear combination of explanatory variables such as block-based paradigm stimuli and motion factors.
Fig 11.

The decomposition framework applied to a task-based fMRI data. The red curve is the original fMRI time series, while the blue one is the first EMCD component and the black dashed curve is the BOLD model fit by FSL FEAT.
Comparison with EMD
We compared the correlations between the FEAT BOLD model and the signals decomposed by EMCD, EMD, and the original fMRI signal, respectively. We randomly selected 100 fMRI time series from activated voxels in the auditory task-based fMRI [26], [27], [56] and the other 100 time series from non-activated voxels. The activation map was detected by the FSL FEAT as shown in Fig. 12.
Fig 12.

FSL FEAT activation results in an auditory task-based fMRI dataset.
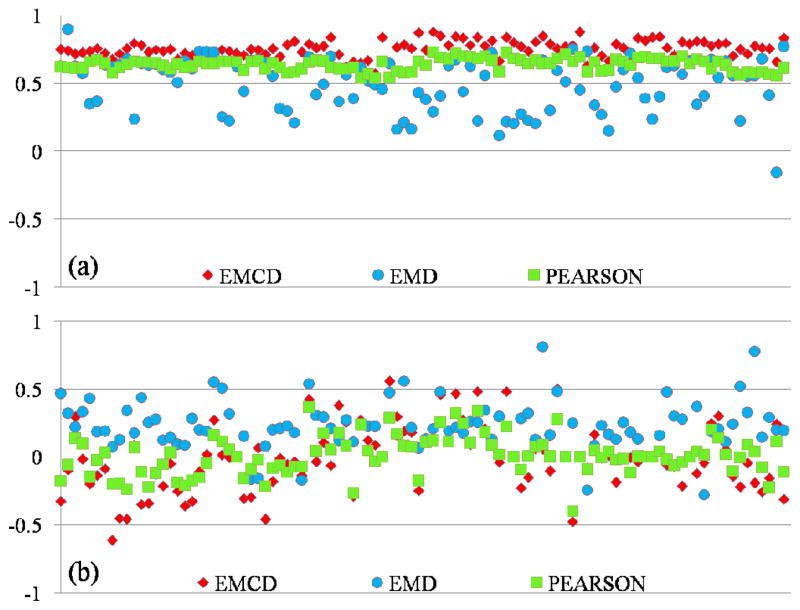
For EMCD, we calculated the Pearson correlation between the first EMCD component and the BOLD model; for EMD, we calculated the Pearson correlation between each of the components and the BOLD model, and selected the most significant value; for the original fMRI signal, we simply calculated the Pearson correlation value between the raw fMRI time series and the BOLD model. The results are shown in Fig. 13. In Fig. 13(a), the mean and variance are 0.755 and 0.004 for EMCD, 0.491 and 0.037 for EMD, and 0.636 and 0.002 for original fMRI signal. It is evident that the first EWF component decomposed by the EMCD framework has the highest correlation to the stimulus curve, suggesting that the lower frequency component in fMRI signal is the biologically relevant signal that is of interest to us and the EMCD approach is able to effectively extract this meaningful component. In contrast, the original fMRI signal might be contaminated or influenced by other irrelevant components of higher frequencies, and the EMD method extracts irrelevant higher frequency signal components first and the error could accumulate rapidly in subsequent iterations when it starts the extractions of the biologically meaningful components.
Fig 13.
Correlations between the FSL FEAT BOLD model and the EMCD components, the EMD components and raw fMRI signals (annotated by Pearson in the figure). The numbers on the left refer to the correlation values. (a) Results for 100 time series from randomly selected activated voxels in auditory task-based fMRI dataset; (b) Results for 100 time series from randomly selected non-activated voxels in the same dataset.
In Fig. 13(b) where 100 fMRI time series from non-activated voxels are shown, the means and variances of correlations are −0.014 and 0.057 for EMCD, 0.217 and 0.033 for EMD, and 0.008 and 0.020 for original fMRI signal, respectively. This result suggests that when there is no correlation between the fMRI signal and stimulus curve, EMCD, EMD and Pearson correlations have similar outcomes. It can be seen that the specificity of the EMCD framework in extracting relevant signal components is also very good, given its substantially better sensitivity than the EMD and Pearson correlation methods.
Quantitatively, we used the Pearson correlation of raw signals as the benchmark, which is the best we can do at current stage, and measured the Normalized Sum of Squared Differences (NSSD) for both EMCD and EMD results. A smaller NSSD value means the results from the tested method better resemble the benchmark; while a larger NSSD value means the opposite. The NSSD values for both EMCD and EMD using Pearson correlation of raw signals as benchmark are listed in Table III. From the table we can see that the NSSD values of EMCD results are consistently lower than those of EMD in all subjects regardless of whether the time series are from activated voxels or non-activated voxels, suggesting that EMCD performed better than EMD in extracting the intrinsic wave, i.e., the BOLD model in our auditory task-based fMRI experiment.
Table III.
NSSD Values of EMCD and EMD
| Subject | Activated Voxels | Non-activated Voxels | ||
|---|---|---|---|---|
| EMCD | EMD | EMCD | EMD | |
| 1 | 0.18 | 0.22 | 0.16 | 0.24 |
| 2 | 0.08 | 0.18 | 0.06 | 0.46 |
| 3 | 0.14 | 0.20 | 0.15 | 0.30 |
| 4 | 0.12 | 0.19 | 0.05 | 0.45 |
Comparison with ICA
We also compared our EMCD results with ICA. Unlike the proposed EMCD decomposition method, ICA deals with a group of time series simultaneously and estimates the independent components. We applied ICA on each group of the 100 time series from either activated voxels or non-activated voxels and compared the results with our EMCD results from previous section. Since the ICA results are basically new sets of time series, we used the mean value from the Pearson correlation benchmark when calculating NSSD. For a fair comparison, we also recalculated the NSSD values for our EMCD results using the same mean value, in contrast to the previous section where we used corresponding individual correlation values. We report the NSSD values of EMCD (recalculated using mean benchmark) and ICA results in Table IV. From the results, we can see that despite the non-activated voxels in subject 2 and 4, the NSSD values of EMCD results are significantly lower than ICA, which means EMCD performed better in recovering the BOLD waves from raw signals than ICA, even though ICA processed all time series simultaneously when EMCD dealt with time series one by one.
Table IV.
NSSD Values of EMCD and ICA
| Subject | Activated Voxels | Non-activated Voxels | ||
|---|---|---|---|---|
| EMCD | ICA | EMCD | ICA | |
| 1 | 0.18 | 0.61 | 0.15 | 0.16 |
| 2 | 0.09 | 0.36 | 0.06 | 0.02 |
| 3 | 0.15 | 0.49 | 0.15 | 0.16 |
| 4 | 0.13 | 0.38 | 0.07 | 0.02 |
In addition, we performed statistically analysis by computing the p-values of right-tailed test for each subject, in the sense that the intrinsic components from time series from activated voxels in the block-based fMRI experiment should correlate with the BOLD model more strongly than those from non-activated voxels. We used the 5% significance level without assuming equal variance. The results are reported in Table V. We can see that in our EMCD results the components extracted from time series from activated voxels in the block-based fMRI experiment correlate with the BOLD model significantly more strongly than those from non-activated voxels (p-values are all close to zero). For ICA, however, there is no significant difference between results from activated voxels and non-activated voxels (p-values are all much larger than 0.05). The experimental results in this and the previous section demonstrated that the proposed EMCD decomposition framework substantially better recovered the intrinsic BOLD activity embedded in the fMRI time series data that is induced by the block-based external stimulus than the EMD and Pearson correlation methods. Considering that the external stimulus curve of block-based paradigm is widely regarded as the benchmark data, the results based on task-based fMRI data partially validated the effectiveness and accuracy of the proposed EMCD framework in extracting biologically relevant signal components.
Table V.
Statistical Results for EMCD and ICA(p-value)
| Subject | EMCD | ICA |
|---|---|---|
| 1 | 1e-142 | 0.44 |
| 2 | 1e-101 | 0.48 |
| 3 | 1e-135 | 0.12 |
| 4 | 8e-58 | 0.33 |
D. EMCD in Natural Stimulus fMRI Analysis
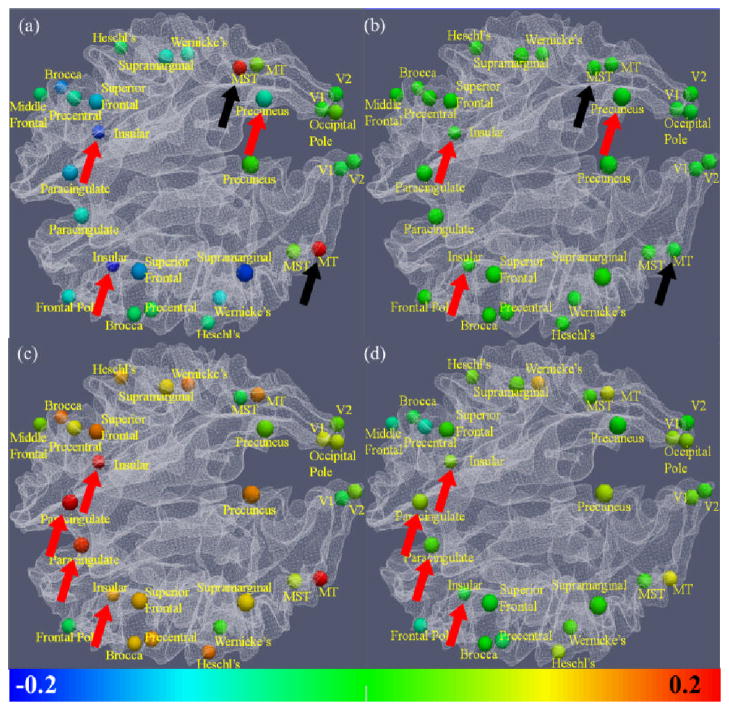
Natural stimulus fMRI of movie watching allows us to continuously monitor the brain’s responses to multimedia contents in a natural way and with high spatial resolution. Importantly, recent research studies [38], [39], including our own [26], [27], [56], have shown that natural stimuli provide a realistic experiment environment for brain research and that the human brain’s response to the same stimulus is reliable and reproducible across individuals. In the literature, a relatively less explored issue in natural stimulus fMRI is how to measure the correlation between low-level feature curves extracted from continuous audio/video streams, such as motion energy and motion saliency [40], and fMRI BOLD signals. In this paper, we applied the EMCD framework to measure the correlation between multi-scale low-level multimedia feature curves and fMRI signals, in order to elucidate the potential correlative interactions among multimedia stimuli and the human brain’s perception and cognition [27], [38], [39], [56].
Experiment Data
The datasets we used were reported in [26], [27], [56]. Briefly, natural stimulus fMRI data was scanned in a news-watching session. The news multimedia was selected from the TRECVID 2005 dataset [41]. Low-level audio/video features were extracted [26], [27], [56], including visual motion saliency[40] and audio signal energy. Twenty-nine brain regions (Fig. 15) from the vision, auditory, language, and working memory networks were mapped via task-based fMRI [27], and the natural stimulus fMRI signals scanned in separate sessions were extracted from these functional brain regions [26], [27], [56]. The preprocessing steps of these natural stimulus fMRI signals are referred the published methods in [25]-[27], [56].
Fig 15.
EMCD-derived correlation (a) and Pearson correlation of original time series and feature series (b) between visual motion saliency feature curve and fMRI time series. EMCD-derived correlation (c) and Pearson correlation (d) between logarithm audio signal energy feature curve and fMRI time series. The color bar is at the bottom. The arrows in the same colors highlighted some brain regions with significant differences between the two methods in (a) and (b), as well as in (c) and (d). The correlation is much stronger between the visual motion saliency feature and brain regions for motion perception, including MT and MST (black arrows), while negative correlation was exposed for insular and precuneus (red arrows and blue bubbles in (a)). When comparing with logarithm audio signal energy feature, insular and paracingulate exhibited strong correlation (c). The corresponding Pearson correlation results shown in (b) and (d) could not reveal the differences.
Multi-scale Correlation Analysis
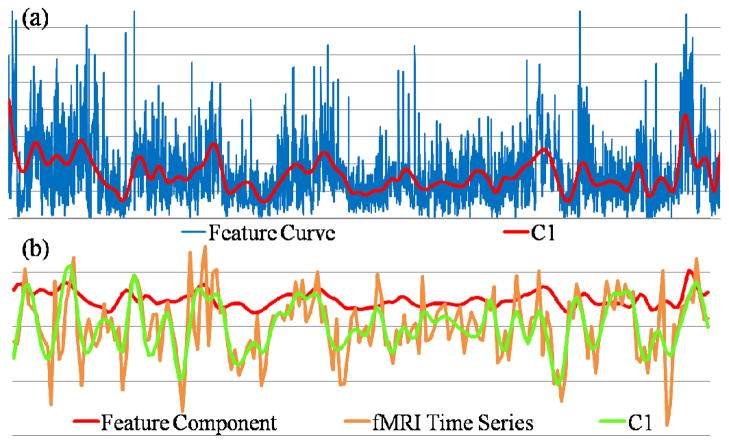
The frequencies of fMRI signals and low-level multimedia features are at quite different scales, e.g., 0.1Hz vs. 30Hz. Hence, we extracted the components from fMRI time series, and use the scale information to guide the decomposition of low-level multimedia feature curves to obtain components at the similar scale. Depicted in Fig. 14(a) is an example of decomposing the visual motion saliency features [40] into a coarser-scale signal. After the decomposition, the extrema time points were kept and the extracted component was later reconstructed at the length of the fMRI time series with the extrema for the correlation analysis.
Fig 14.
(a) Decomposition of the visual motion saliency feature curve into a coarser-scale signal (C1); (b) Comparison of the extracted visual low-level feature component and the fMRI component at similar scales.
Then, the correlation between these two types of signals are measured by the Pearson correlation of corresponding EMCD components at the same or similar temporal scales, as illustrated in Fig. 14(b). We hypothesize that low-level features with specific semantic meanings will have higher correlations with the corresponding signals from relevant brain regions. For instance, Fig. 15(a) shows a pilot result on visual motion saliency features, from which we can see that much stronger correlation appears in some brain regions for motion perception including right middle temporal (MT) region and left middle superior temporal (MST) region [42] (black arrows in Fig. 15(a)), when we compared the EMCD C1 components of fMRI BOLD signals and the visual saliency feature curve [40]. The result is quite reasonable, given current known neuroscience knowledge that MT and MST regions are responsible for visual motion processing and understanding [42]. As a comparison, we calculated the Pearson correlation between the original visual saliency feature and the raw fMRI time series signals and it turns out that most correlations are close to zero, indicating that calculating the Pearson correlation between original fMRI signals and low-level multimedia features at different time scales is unable to infer any meaningful information (Fig. 15(b)).
In addition to the capability of inferring meaningful positive correlations between fMRI signals of MT and MST brain regions and the visual motion saliency features, interestingly, our EMCD-based method also reveals strong negative correlation between the visual saliency feature and the fMRI signal of the insular and precuneus regions (red arrows in Fig. 15(a)), while the measured Pearson correlation between the original raw fMRI signals and visual motion saliency features cannot. The validity of the results on negative correlations for insular and precuneus regions in Fig. 15(a) is supported by a variety of literature neuroscience studies that reported the deactivation of vestibular cortex (including insular and precuneus regions) in response to visual motion [43]–[45].
In addition to visual low-level features, Fig. 15(c) shows another result of the correlation between logarithm audio signal energy feature curve [46] and fMRI time series, where the insular and paracingulate regions (red arrows in Fig. 15(c)) exhibit strong positive correlation with the audio features. The validity of these results is supported by several neuroscience literature studies that reported activations of these regions in response to audio stimuli [47]–[51]. However, the results by calculating the Pearson correlation between the raw low-level auditory feature curves and fMRI signals are close to zero (Fig. 15(d)).
The promising results in Fig. 15 indicate that the EMCD-based correlation analysis is able to discover meaningful intrinsic positive/negative correlations between low-level multimedia features and fMRI signals extracted from relevant functional brain regions. The critical point here is that the EMCD enables the decomposition of time series into components of multiple temporal scales so that the correlative structure can be measured at the same or similar scales.
IV. Discussion and Conclusion
We presented a novel fMRI signal decomposition algorithm that iteratively extracts the mean curves of time series signals. The EMCD framework extracts coarser-to-finer scale signals, in comparison to the EMD that extracts finer-to-coarser scale signals. Our experimental results demonstrate that the extracted low-frequency mean envelope signals by the proposed EMCD framework are more meaningful and useful than the residue curves. The applications of EMCD in resting state, task-based, and natural stimulus fMRI data have shown meaningful and interesting results. In particular, the EMCD framework has been extensively evaluated and validated via synthesized time series signals with ground-truth, independent DTI-derived structural connectivity patterns, comparison with other well-established algorithms, and verification by benchmark data and known neuroscience domain knowledge.
In this paper, we focused on the presentation and evaluation of the EMCD framework, and the potential applications of the EMCD method in many fMRI studies are still far from being fully explored yet. For instance, the decomposition of resting state fMRI signals into three EWF components in a data-adaptive fashion can be potentially used in studying the functional oscillations of large-scale networks in different frequency ranges in the future. In this case, the couplings among the functional oscillations on different brain network [33] in various frequency domains, e.g., 0.01Hz – 0.1 Hz, can be examined in both healthy brains and neurological/psychiatric disorders [52]. For task-based fMRI, the EMCD framework could be possibly applied to detect functional activations for decomposed signals at different frequency domains in the future. For natural stimulus fMRI of movie watching, in the future, many other low-level time series multimedia features [53] can be extracted and then correlated with the fMRI signals to infer the possible functional interactions among these two time series spaces. Once these correlative structures between multimedia streams and functional brain responses are achieved, it can provide novel and important insights into the functional working mechanism of the brain under the uncontrolled environment of natural stimulus [38], [39].
Although we already compared the proposed EMCD methods with EMD, wavelet transform, Pearson correlation analysis, and ICA using synthesized signals, resting state fMRI signals, task-based fMRI signals and natural stimulus fMRI signals, and have demonstrated the superiority of the EMCD framework in this paper, in the future, we will conduct additional extensive comparisons of EMCD and other alternative fMRI signal processing approaches such as Markov random field (MRF) models [7], mixture models [8], and autoregressive spatial models [9]. For instance, fMRI signals extracted from different task designs with various imaging parameter settings will be used for these comparisons. Also, other advanced approaches for fMRI signal synthesis [54] can be used to generate more realistically looking fMRI signals with ground-truth for those comparative studies.
In general, any time series signal decomposition algorithm, either data-driven or model-driven, relies on certain criteria or constraints during the actual decomposition procedure. For instances, the EMD method enforces all extracted components to be narrow-band limited and with zero local mean, the wavelet or Fourier analysis assumes the predefined basis functions, and the independent component analysis (ICA) aims to maximize the independence among different extracted components [11], [12]. In the proposed EMCD method, a scale control algorithm was employed to constrain the distributions of extrema on the superior and inferior envelopes. In the future, we plan to investigate other possible constraints or signal models that are biologically meaningful and computationally feasible into the multi-scale EMCD signal decomposition procedure. For instance, for resting-state fMRI data, the statistical models of the distributions of three frequency ranges shown in Fig. 10 could be possibly integrated to guide the data-driven EMCD signal decomposition procedure. Furthermore, we plan to extend the current EMCD methodology by incorporating group-wise information, e.g., multiple fMRI time series from the same ROI. The premise is that the fMRI time series from the same ROI could exhibit similar functional activity, but with different additive noise signals that are realizations of the same noise model. In this way, we may be able to increase the signal-noise ratio (SNR) via statistical methods.
Finally, we envision that data-driven fMRI signal processing and analysis methods will play more and more important roles in the brain imaging field in order to the address the challenging problem of spatial and temporal variations in signal composition and frequency characteristics in different brains. Meanwhile, we also believe that appropriate integration of biologically meaningful, statistically sound, and computational feasible models of fMRI signals into the data-driven signal analysis processes could significantly contribute to achieving desirable outcomes. In this sense, a trade-off between the data-driven and model-driven approaches that takes the advantages of both methodologies can be achieved [55].
Acknowledgments
T Liu was supported by the NIH K01 EB 006878, NIH R01 HL087923-03S2, NIH R01 R01DA033393, and NSF CAREER Award IIS-1149260, and The University of Georgia start-up research funding. L Guo was supported by NSF-China 61273362. The authors would like to thank the Bioimaging Research Center at the University of Georgia for their support to conduct MRI experiments.
Biographies

Fan Deng received his BS degree in Electrical Engineering in University of Science and Technology, China in 2009 and MS degree in Computer Science in University of Georgia in 2012. His master thesis work was on functional interaction between cortical gyri and sulciand fMRI signal processing. Since June 2012, he worked as a software engineering in Zynga, CA.

Dajiang Zhu was born in Beijing, China, in 1978. He received the B.S. degree in computer science from Shanghai Jiaotong University in 2001. Currently he is a Ph.D. student at University of Georgia, U.S. His research interests include MRI imaging analysis, connectome and the relation between brain structure and function.

Jinglei Lv received his B.S. and M.S. degrees of control science and control engineering from Northwestern Polytechnical University. Currently he is a Ph.D. candidate student of Automation department in Northwestern Polytechnical University, and a visiting student of Computer Science department of The University of Georgia, in Dr. Tianming Liu’s lab. His research interests include MRI image processing and analysis, brain structure and function analysis, brain network analysis.

Prof. Lei Guo received his BS, MS and PhD degrees in information engineering from Xi’dian University in 1982, 1986 and 1993 respectively. Since 1996 Dr. Guo was promoted to full professor in the department of automation of Northwestern Polytechnical University, and then appointed as advisor of doctoral graduate student in 1997. Prof. Guo’s major research interests include image processing, image compression, information processing, fingerprint and waveprint understanding, pattern recognition, and biomedical information modeling and analysis. Prof. Guo’s discipline is in control science and engineering.

Dr. Tianming Liu (SM’06) is an Assistant Professor of Computer Science at UGA. Dr. Liu is also an affiliated faculty with the UGA Bioimaging Research Center (BIRC), the UGA Institute of Bioinformatics (IOB), the UGA Biomedical and Health Sciences Institute (BHSI), and the UGA Faculty of Engineering. Before he moved to UGA, Dr. Liu was a faculty member of Weill Medical College of Cornell University (Assistant Professor, 2007–2008) and Harvard Medical School (Instructor, 2005–2007). Dr. Liu was a postdoc in neuroimaging in the University of Pennsylvania (2002–2004) and Harvard Medical School (2004–2005). Dr. Liu received PhD in computer science from Shanghai Jiaotong University in 2002.Dr. Liu’s research interests include brain imaging, bioimaging and multimedia. Dr. Liu is the recipient of the Microsoft Fellowship Award (2000–2002), the NIH K01 Career Award (2007–2012) and the NSF CAREER Award (2012–2017).
Contributor Information
Fan Deng, Email: enetoremail@gmail.com, Department of Computer Science and the Bioimaging Research Center, the University of Georgia, Athens, GA, 30602 USA.
Dajiang Zhu, Email: dajiang.zhu@gmail.com, Department of Computer Science and the Bioimaging Research Center, the University of Georgia, Athens, GA, 30602 USA.
Jinglei Lv, Email: lvjinglei@gmail.com, School of Automation, Northwestern Polytechnical University, Xi’an, P. R. China.
Lei Guo, Email: guolei.npu@gmail.com, School of Automation, Northwestern Polytechnical University, Xi’an, P. R. China.
Tianming Liu, Department of Computer Science and the Bioimaging Research Center, the University of Georgia, Athens, GA, 30602 USA.
References
- 1.Heeger DJ, Ress D. What does fmri tell us about neuronal activity? Nat Rev Neurosci. 2002 Feb;3(2):142–151. doi: 10.1038/nrn730. [DOI] [PubMed] [Google Scholar]
- 2.Logothetis NK. What we can do and what we cannot do with fmri. Nature. 2008 Jun;453(7197):869–878. doi: 10.1038/nature06976. [DOI] [PubMed] [Google Scholar]
- 3.Buzski G, Draguhn A. Neuronal oscillations in cortical networks. Science. 2004 Jun;304(5679):1926–1929. doi: 10.1126/science.1099745. [DOI] [PubMed] [Google Scholar]
- 4.Friston KJ, Holmes AP, Worsley KJ, Poline JP, Frith CD, Frackowiak RSJ. Statistical parametric maps in functional imaging: A general linear approach. Hum Brain Mapp. 1994;2(4):189210. [Google Scholar]
- 5.Bullmore E, Fadili J, Breakspear M, Salvador R, Suckling J, Brammer M. Wavelets and statistical analysis of functional magnetic resonance images of the human brain. Stat Methods Med Res. 2003 Oct;12(5):375–399. doi: 10.1191/0962280203sm339ra. [DOI] [PubMed] [Google Scholar]
- 6.Shimizu Y, Barth M, Windischberger C, Moser E, Thurner S. Wavelet-based multifractal analysis of fMRI time series. Neuroimage. 2004 Jul;22:1195–1202. doi: 10.1016/j.neuroimage.2004.03.007. [DOI] [PubMed] [Google Scholar]
- 7.Descombes X, Kruggel F, von Cramon DY. fmri signal restoration using a spatio-temporal markov random field preserving transitions. NeuroImage. 1998 Nov;8(4):340–349. doi: 10.1006/nimg.1998.0372. [DOI] [PubMed] [Google Scholar]
- 8.Hartvig NV, Jensen JL. Spatial mixture modeling of fmri data. Hum Brain Mapp. 2000 Dec;11(4):233–248. doi: 10.1002/1097-0193(200012)11:4<233::AID-HBM10>3.0.CO;2-F. [DOI] [PMC free article] [PubMed] [Google Scholar]
- 9.Woolrich MW, Jenkinson M, Brady JM, Smith SM. Fully bayesian spatio-temporal modeling of fmri data. IEEE Trans Med Imag. 2004;23(2):213–231. doi: 10.1109/TMI.2003.823065. [DOI] [PubMed] [Google Scholar]
- 10.Huaien L, Puthusserypady S. fMRI data analysis with nonstationary noise models: a Bayesian approach. IEEE Trans Biomed Eng. 2007 Sep;54:1621–1630. doi: 10.1109/TBME.2007.902591. [DOI] [PubMed] [Google Scholar]
- 11.Calhoun VD, Adali T, Pearlson GD, Pekar JJ. A method for making group inferences from functional MRI data using independent component analysis. Hum Brain Mapp. 2001 Nov;14(3):140–151. doi: 10.1002/hbm.1048. [DOI] [PMC free article] [PubMed] [Google Scholar]
- 12.Calhoun VD, Pekar JJ, Pearlson GD. Alcohol intoxication effects on simulated driving: Exploring alcohol-dose effects on brain activation using functional MRI. Neuropsychopharmacology. 2004 Nov;29:2097–3017. doi: 10.1038/sj.npp.1300543. [DOI] [PubMed] [Google Scholar]
- 13.Huang NE, Shen Z, Long SR, Wu MC, Shih HH, Zheng Q, Yen NC, Tung CC, Liu HH. The empirical mode decomposition and the hilbert spectrum for nonlinear and non-stationary time series analysis. Proc Roy Soc London Series A: Mathematical, Physical and Engineering Sciences. 1998 Mar;454(1971):903–995. [Google Scholar]
- 14.Flandrin P, Rilling G, Goncalves P. Empirical mode decomposition as a filter bank. Signal Processing Letters, IEEE. 2004 Febuary;11(2):112–114. [Google Scholar]
- 15.Wu Z, Huang NE. A study of the characteristics of white noise using the empirical mode decomposition method. Proc Roy Soc London Series A: Mathematical, Physical and Engineering Sciences. 2004;460(2046):1597–1611. [Google Scholar]
- 16.Flandrin P, Goncalves P. Empirical mode decompositions as data-driven wavelet-like expansions for stochastic processes. International Journal of Wavelets, Multiresolution and Information Processing. 2004;2(4):477–496. [Google Scholar]
- 17.Liang H, Bressler SL, Buffalo EA, Desimone R, Fries P. Empirical mode decomposition of field potentials from macaque v4 in visual spatial attention. Biol Cybern. 2005 Jun;92(6):380–392. doi: 10.1007/s00422-005-0566-y. [DOI] [PubMed] [Google Scholar]
- 18.McKeown MJ, Saab R, Abu-Gharbieh R. A Combined Independent Component Analysis (ICA)/Empirical Mode Decomposition (EMD) Method to Infer Corticomuscular Coupling. Conference Proceedings. 2nd International IEEE EMBS Conference on Neural Engineering; March 2005.pp. 679–682. [Google Scholar]
- 19.Sweeney-Reed CM, Nasuto SJ. A novel approach to the detection of synchronisation in EEG based on empirical mode decomposition. J Comput Neurosci. 2007 Aug;23(1):79–111. doi: 10.1007/s10827-007-0020-3. [DOI] [PubMed] [Google Scholar]
- 20.Zheng T, Cai M, Jiang T. A novel approach to activation detection in fMRI based on empirical mode decomposition. J Integr Neurosci. 2010 Dec;9(4):407–427. doi: 10.1142/s021963521000255x. [DOI] [PubMed] [Google Scholar]
- 21.McGonigle J, Mirmehdi M, Malizia AL. Empirical Mode Decomposition in data-driven fMRI analysis. Workshop on Brain Decoding, 20th International Conference on Pattern Recognition; August 2010. [Google Scholar]
- 22.Li K, Guo L, Li G, Nie J, Faraco C, Zhao Q, Miller LS, Liu T. Cortical surface based identification of brain networks using high spatial resolution resting state fmri data. Biomedical Imaging: From Nano to Macro, 2010 IEEE International Symposium on; April 2010.p. 656659. [Google Scholar]
- 23.Fox MD, Raichle ME. Spontaneous fluctuations in brain activity observed with functional magnetic resonance imaging. Nat Rev Neurosci. 2007 Sep;8(9):700–711. doi: 10.1038/nrn2201. [DOI] [PubMed] [Google Scholar]
- 24.Faraco CC, Unsworth N, Langley J, Terry D, Li K, Zhang D, Liu T, Miller LS. Complex span tasks and hippocampal recruitment during working memory. NeuroImage. 2011 Mar;55(2):773–787. doi: 10.1016/j.neuroimage.2010.12.033. [DOI] [PubMed] [Google Scholar]
- 25.Zhu D, Li K, Faraco CC, Deng F, Zhang D, Jiang X, Chen H, Guo L, Miller LS, Liu T. Optimization of functional brain ROIs via maximization of consistency of structural connectivity profiles. NeuroImage. 2011 doi: 10.1016/j.neuroimage.2011.08.037. in press. [DOI] [PMC free article] [PubMed] [Google Scholar]
- 26.Hu X, Deng F, Li K, Zhang T, Chen H, Jiang X, Lv J, Zhu D, Faraco C, Zhang D, Mesbah A, Han J, Hua X, Xie L, Miller LS, Guo L, Liu T. Bridging low-level features and high-level semantics via fmri brain imaging for video classification. Proceedings of the ACM International Conference on Multimedia; 2010. pp. 451–460. [Google Scholar]
- 27.Hu X, Li K, Han J, Hua XS, Guo L, Liu T. Bridging the Semantic Gap via Functional Brain Imaging. IEEE Trans Multimedia. 2011 in press. [Google Scholar]
- 28.Fransson P. Spontaneous low-frequency bold signal fluctuations: An fmri investigation of the resting-state default mode of brain function hypothesis. Hum Brain Mapp. 2005;26:15–29. doi: 10.1002/hbm.20113. [DOI] [PMC free article] [PubMed] [Google Scholar]
- 29.Luca M, Beckmann CF, de Stefano N, Matthews PM, Smith SM. fMRI resting state networks define distinct modes of long-distance interactions in the human brain. NeuroImage. 2006 Feb;29(4):1359–1367. doi: 10.1016/j.neuroimage.2005.08.035. [DOI] [PubMed] [Google Scholar]
- 30.Damoiseaux JS, RSARB, BFSP, Stam CJ, Smith SM, BCF Consistent resting-state networks across healthy subjects. PNAS. 2006 Sep;103(37):13 848–13 853. doi: 10.1073/pnas.0601417103. [DOI] [PMC free article] [PubMed] [Google Scholar]
- 31.Lv J, Guo L, Hu X, Li K, Zhang ZTD, Yang J, Liu T. Fiber-centered analysis of brain connectivities using dti and resting state fmri data. MICCAI. 2010;13(2):143–150. doi: 10.1007/978-3-642-15745-5_18. [DOI] [PubMed] [Google Scholar]
- 32.[Online]. http://www-sop.inria.fr/asclepios/software/MedINRIA/
- 33.Zhu D, Li K, Guo L, Jiang X, Zhang T, Zhang D, Chen H, Deng F, Faraco CC, Jin C, Wee CY, Yuan Y, Lv P, Yin Y, Hu X, Duan L, Hu X, Han J, Wang L, Shen D, Miller LS, Li L, Liu T. DICCCOL: Dense Individualized and Common Connectivity-based Cortical Landmarks. Cerebral Cortex. doi: 10.1093/cercor/bhs072. accepted, 2012. [DOI] [PMC free article] [PubMed] [Google Scholar]
- 34.da Silva AM, Botelho LF, Almeida M, Andrade A. Coherence analysis in three bands of the low frequency spectrum of resting-state fmri datasets. NeuroImage. 2009 Jul;47(S1):168. [Google Scholar]
- 35.Honey CJ, Sporns O, Cammoun L, Gigandet X, Thiran JP, Meuli R, Hagmann P. Predicting human resting-state functional connectivity from structural connectivity. PNAS. 2009 Feb;106(6):2035–2040. doi: 10.1073/pnas.0811168106. [DOI] [PMC free article] [PubMed] [Google Scholar]
- 36.Passingham RE, Stephan KE, Kötter R. The anatomical basis of functional localization in the cortex. Nat Rev Neurosci. 2002 Aug;3(8):606–616. doi: 10.1038/nrn893. [DOI] [PubMed] [Google Scholar]
- 37.[Online]. http://fsl.fmrib.ox.ac.uk/fsl/feat5
- 38.Hasson U, Malach R, Heeger DJ. Reliability of cortical activity during natural stimulation. Trends in Cognitive Sciences. 2010 Jan;14(1):40–48. doi: 10.1016/j.tics.2009.10.011. [DOI] [PMC free article] [PubMed] [Google Scholar]
- 39.Hasson U, Nir Y, Levy I, Fuhrmann G, Malach R. Intersubject synchronization of cortical activity during natural vision. Science. 2004 Mar;303(5664):1634–1640. doi: 10.1126/science.1089506. [DOI] [PubMed] [Google Scholar]
- 40.Harel J, Koch C, Perona P. Graph-based visual saliency. Advances in Neural Information Processing Systems. 2007;19:545–552. [Google Scholar]
- 41.Smeaton AF, Over P, Kraaij W. Evaluation campaigns and trecvid. Proceedings of the 8th ACM international workshop on Multi-media information retrieval; 2006. pp. 321–330. [Google Scholar]
- 42.Wandell BA, Dumoulin SO, Brewer AA. Visual field maps in human cortex. Neuron. 2007 Oct;56(2):366–383. doi: 10.1016/j.neuron.2007.10.012. [DOI] [PubMed] [Google Scholar]
- 43.Brandt T, Bartenstein P, Janek A, Dieterich M. Reciprocal inhibitory visual-vestibular interaction. visual motion stimulation deactivates the parieto-insular vestibular cortex. Brain. 1998;121(9):1749–1758. doi: 10.1093/brain/121.9.1749. [DOI] [PubMed] [Google Scholar]
- 44.Kleinschmidta A, Thilob KV, Bchelc C, Grestyd MA, Bronsteind AM, Frackowiake RSJ. Neural correlates of visual-motion perception as object- or self-motion. NeuroImage. 2002 Aug;16(4):873–882. doi: 10.1006/nimg.2002.1181. [DOI] [PubMed] [Google Scholar]
- 45.Dieterich M. Functional brain imaging: a window into the visuo-vestibular systems. Curr Opin NeuroI. 2007 Febuary;20(1):12–18. doi: 10.1097/WCO.0b013e328013f854. [DOI] [PubMed] [Google Scholar]
- 46.Li K, Zhang T, Hu X, Zhu D, Chen H, Jiang X, Deng F, Lv J, Faraco CC, Zhang D, Mesbah A, Han J, Lu L, Hua XS, Guo L, Miller LS, Liu T. Human-Friendly Attention Models for Video Summarization. ACM Conference on Multimodal Interfaces; 2010. [Google Scholar]
- 47.Goycoolea MV, Mena I, Neubauer SG, Levy RG, Grez MF, Berger CG. Musical brains: a study of spontaneous and evoked musical sensations without external auditory stimuli. Acta Otolaryngol. 2007 Jul;127(7):711–721. doi: 10.1080/00016480601053057. [DOI] [PubMed] [Google Scholar]
- 48.Wong PC, Parsons LM, Martinez M, Diehl RL. The role of the insular cortex in pitch pattern perception: the effect of linguistic contexts. J Neurosci. 2004 Oct;24(41):9153–9160. doi: 10.1523/JNEUROSCI.2225-04.2004. [DOI] [PMC free article] [PubMed] [Google Scholar]
- 49.Remedios R, Logothetis NK, Kayser C. An auditory region in the primate insular cortex responding preferentially to vocal communication sounds. J Neurosci. 2009 Jan;29(4):1034–1045. doi: 10.1523/JNEUROSCI.4089-08.2009. [DOI] [PMC free article] [PubMed] [Google Scholar]
- 50.Cohen YE, Russ BE, GWG Auditory processing in the posterior parietal cortex. Behav Cogn Neurosci Rev. 2005 Sep;4(3):218–231. doi: 10.1177/1534582305285861. [DOI] [PubMed] [Google Scholar]
- 51.Klostermann EC, Loui P, Shimamura AP. Activation of right parietal cortex during memory retrieval of nonlinguistic auditory stimuli. Cogn Affect Behav Neurosci. 2009 Sep;9(3):242–248. doi: 10.3758/CABN.9.3.242. [DOI] [PubMed] [Google Scholar]
- 52.Hoptman MJ, Zuo XN, Butler PD, Javitt DC, D’Angelo D, Mauro CJ, Milham MP. Amplitude of low-frequency oscillations in schizophrenia: A resting state fMRI study. Schizophr Res. 2010 Mar;117(1):13–20. doi: 10.1016/j.schres.2009.09.030. [DOI] [PMC free article] [PubMed] [Google Scholar]
- 53.He S, Han J, Hu X, Xu M, Guo L, Liu T. A Biologically Inspired Computational Model for Image Saliency Detection. ACM Multimedia. 2011 [Google Scholar]
- 54.Cheng H, Zhao Q, Duensing GR, Edelstein WA, Spencer D, Browne N, Saylor C, Limkeman Mark. SmartPhantom an fMRI Simulator. Magn Reson Imaging. 2006 Apr;24(3):301–313. doi: 10.1016/j.mri.2005.12.012. [DOI] [PMC free article] [PubMed] [Google Scholar]
- 55.Lin SL, Tung PC, Huang NE. Data analysis using a combination of independent component analysis and empirical mode decomposition. Phys Rev E. 2009;79:066705. doi: 10.1103/PhysRevE.79.066705. [DOI] [PubMed] [Google Scholar]
- 56.Sun J, Hu X, Huang X, Liu Y, Li K, Li X, Han J, Guo L, Liu T, Zhang J. Inferring Consistent Functional Interaction Patterns from Natural Stimulus FMRI Data. NeuroImage. 2012 doi: 10.1016/j.neuroimage.2012.01.142. in press. [DOI] [PMC free article] [PubMed] [Google Scholar]


