Abstract
GPR56, one of the adhesion G-protein–coupled receptors (GPCRs), plays an important role in the development of the cerebral cortex. Mutations in GPR56 cause a severe human cortical malformation called bilateral frontoparietal polymicrogyria (BFPP), characterized by a global malformation of the cerebral cortex that most severely affects the frontal and parietal regions. To characterize the expression pattern of GPR56 in the developing cerebral cortex, we developed a mouse monoclonal antibody against mouse GPR56. We revealed that GPR56 is expressed in multiple cell types in the preplate, marginal zone, subventricular zone (SVZ), and ventricular zone (VZ). Most interestingly, the in preplate neurons showed an anterior-to-posterior gradient at embryonic day (E) 10.5–11.5. In contrast, the expression pattern of the GPR56 ligand, collagen III, revealed no visible gradient pattern. With the widespread expression of GPR56 in the developing cortex, it is difficult to draw a specific conclusion as to which of the GPR56-expressing cells are critical for human brain development. However, the correlation between GPR56 expression in neurons at E10.5–E11.5 and the anatomic distribution of the cortical malformation in both humans and mice suggests that its function in preplate neurons is indispensible.
INDEXING TERMS: neocortex, postmitotic neuron, GPR56 expression of GPR56
Mutations in GPR56 cause bilateral frontoparietal polymicrogyria (BFPP), a devastating brain malformation (Piao et al., 2004, 2005). Individuals with BFPP present with mental retardation, language impairment, motor developmental delay, and seizure disorders (Chang et al., 2003; Piao et al., 2002, 2004, 2005). The observed cortical abnormality extends across the frontal and parietal lobes with a decreasing anterior-to-posterior gradient of severity. However, it remains unclear how the anatomic distribution of the malformation occurs.
Histological analysis of GPR56 knockout mouse brains showed that the loss of GPR56 results in breaches of the pial basement membrane (BM) and neuronal overmigration—a hallmark of cobblestone lissencephaly (Li et al., 2008). This histopathology was further confirmed by studies of postmortem human BFPP brains, which concretely demonstrated that BFPP is a cobblestone-like brain malformation (Bahi-Buisson et al., 2010). Although the leading pathology of cobblestone lissencephaly is thought to be the result of a regional breakdown of the pial BM, the most recent literature indicates that abnormal neuronal migration also accounts for the development of cobblestone lissencephaly (Jaglin et al., 2009; Kwiatkowski et al., 2007; Moers et al., 2008; Olson and Walsh, 2002; Sarkisian et al., 2006). We previously showed that radial glial cells express GPR56 in abundance in their endfeet, presumably regulating the integrity of the pial BM (Li et al., 2008).
However, our recent data demonstrate that the interaction of GPR56 and its ligand, collagen III, inhibits neuronal migration, revealing a yet uncharacterized function of GPR56 in cortical development (Luo et al., 2011). This current study aims to examine the expression pattern of GPR56 in the developing neocortex, thus laying the foundation for further study of the myriad of roles that GPR56 plays in cortical development.
MATERIALS AND METHODS
Antibodies
The primary antibodies are described in detail in Table 1. The rabbit anti-Tuj1 monoclonal antibody (Covance, Princeton, NJ) was raised against microtubules derived from rat brains. This antibody detects a single band of 50 kDa on Western blot of rat brain cell extracts (manufacturer’s information). Our immunostaining pattern in postmitotic neurons of the mouse brain is identical to that in the previous report (Luo et al., 2011).
TABLE 1.
Primary Antibodies Used in This Study
| Antigen | Immunogen/peptide | Species | Catalog no./source | Dilution |
|---|---|---|---|---|
| 199 | KNNSDSAKLPISSGSTSSSRI | Rabbit polyclonal | 1:250 | |
| H11 | Amino acids 27–382 fused with mFC | Mouse monoclonal | 1:200 | |
| Tuj1 | Microtubules derived from rat brain | Rabbit monoclonal IgG | MRB-435P, Covance (Princeton, NJ) | 1:2,000 |
| Reelin | Amino acids 164–496 | Mouse monoclonal IgG | MAB5364, Chemicon International (Billerica, MA) | 1:125 |
| Collagen III | Full-length human collagen type III | Rabbit polyclonal | LS-B693, Lifespan Bioscience (Seattle, WA) | 1:200 |
| Tbr2 | LPQARYYNGERTVPQTN(C)EYSKDTSKGMGAYYAFYTSP | Rabbit polyclonal | 23345, Abcam (Cambridge, MA) | 1:250 |
| Calretinin | Recombinant human calretinin containing a 6-his tag at the N-terminal | Rabbit polyclonal | 7699/4, Swant (Bellinzona, Switzerland) | 1:1,000 |
The rabbit anti-human collagen III antibody (Lifespan Biosciences Seattle, WA) was raised against full-length human type III collagen with an intact 3D helical structure. This antibody recognizes a single protein band between 160 and 260 kDa on Western blot of mouse meningeal fibroblasts (Luo et al., 2011). Our immunostaining of this antibody reveals a specific expression pattern, as previously reported (Luo et al., 2011).
The mouse anti-reelin antibody (Chemicon International, Billerica, MA) was raised against a recombinant reelin protein containing amino acids 164–496, with the epitope between amino acids 164 and 189. This antibody detects three protein bands; 420, 310, and 180 kDa on Western blot of cortical and cerebellar cell extract (Botella-Lopez et al., 2006). Our immunostaining pattern was identical to that in the previous report on the mouse cortex (Alcantara et al., 1998).
The rabbit anti-Tbr2 antibody (Abcam, Cambridge, MA) was raised against a synthetic peptide containing amino acids 650 to the C-terminus of mouse TBR2/Eomes conjugated to keyhole limpet hemocyanin. This antibody detects a clear band of 72 kDa on Western blot of cell lysates of EL4 cells expressing V5-tagged Eomesodermin. However, it shows two bands of ~85 and ~75 kDa of either human mesendoderm or E14 mouse embryonic brains (manufacturer’s information). Our immunostaining of this antibody showed the same distribution of Tbr2 transcripts in the mouse neocortex as that previously reported (Bulfone et al., 1999).
The calretinin antibody (Swant, Bellinzona, Switzerland) was raised against a recombinant human calretinin containing a 6-His tag at the N-terminus. This antibody recognizes a single protein band of 29–30 kDa on Western blot of brain homogenates of various species including mouse, rat, guinea pig, rabbit, Macaca fascicularis, zebrafish, and chicken (manufacturer’s information). The antibody specificity was confirmed by immunohistochemistry (IHC) on calretinin knockout mouse brain (manufacturer’s information). Our immunostaining of this antibody showed the same distribution of calretinin in the mouse neocortex as previously reported (Hevner et al., 2003).
Immunohistochemistry (IHC)
Timed pregnant wild-type mice of CD-1 background were ordered from Charles River (Wilmington, MA). The Gpr56 knockout mice were kindly provided by Genentech (South San Francisco, CA) and produced in collaboration between Genentech and Lexicon Genetics (Woodlands, TX) to analyze the function of about 500 secreted and transmembrane proteins. All animals were treated according to the guidelines of the Animal Care and Use Committee of Children’s Hospital Boston.
Histological analysis was carried out as previously described with minor modifications (Brown et al., 1996; Li et al., 2008). Embryonic brains were fixed in 4% paraformaldehyde at 4°C for either 3 hours (E10.5, E11.5, and E12.5) or overnight (E14.5 and E18.5). After protecting in 30% sucrose and embedding in OCT, frozen sections were prepared at 8 μm on a cryostat (Leica, Deerfield, IL). For H11 antibody immunostaining, antigens were retrieved by boiling the slides in Retrievagen A Solution (BD Pharmingen, San Diego, CA) for either 8 minutes (E10.5, E11.5, and E12.5), 12 minutes (E14.5), or 14 minutes (E18.5), followed by cooling down at room temperature for 30 minutes. The slides were then washed three times in phosphate-buffered saline (PBS), once in 1% sodium dodecyl sulfate (SDS) in PBS, and then again three times in PBS. After blocking with 10% goat serum, 1% bovine serum albumin (BSA), and 0.1% Triton X-100 in PBS for 1 hour at room temperature, the sections were incubated with antibody H11 overnight at 4°C followed by washing once in PBS, twice in 2.7% NaCl PBS (instead of 0.8% NaCl), and once more in PBS. Primary antibodies were visualized by incubation in Alexa Fluor 488 or Alexa Fluor 546 (1:1,000; Invitrogen, La Jolla, CA) for 30 minutes at room temperature. Counterstaining was carried out with Hoechst 33342 (1:2,000; Invitrogen).
Primary neural culture and immunocytochemistry
Primary neural culture was performed as previously described (Luo et al., 2011). Briefly, cortical cells were harvested from E13.5 mouse cortices with the meninges removed. Dissociated cells were seeded on 10-ml tissue culture dishes at 37°C for 10 minutes to deplete the fibroblasts. The cells (1 × 10⁵/ml) were placed on cover-slips precoated with poly-D-lysine (100 μg/ml) and cultured in neural culture medium (neurobasal medium supplemented with B27, 1% penicillin/streptomycin, and 1% L-glutamate) for 1 day.
To perform immunocytochemistry, the cultured primary neuronal cells were fixed in cold acetone for antibody 199 or cold 95% ethanol and 5% glacial acetic acid for antibody H11, followed by three washes with PBS. Cells were permeabilized with 0.1% Triton-X 100 in PBS for 10 minutes followed by three washes with PBS. After blocking with 10% goat serum, 1% BSA, and 0.1% Triton-X100 in PBS for 30 minutes, the primary antibodies were incubated at 4°C overnight and visualized by appropriate fluorophore-conjugated secondary antibodies (1:1,000; Invitrogen). Nuclei were stained with Hoechst 33342 (1:2,000; Invitrogen). Images were captured by using a Nikon 80i upright microscope.
Analysis of GPR56 gradient expression
Sagittal sections of E10.5–E12.5 brains (three different brains for each developmental stage) were stained with antibody H11 as described above. The images were captured by using a Nikon 80i upright microscope. The selected region of the preplate and VZ was evenly divided into 10 bins. Fluorescent density in each bin was measured by using Image QuantTL (Amersham Bioscience, Arlington Heights, IL). The fluorescent density was subtracted from the background and divided by the density of the first bin to obtain the relative fluorescent intensity. Two-tailed Student’s t-tests were performed for P values.
RESULTS
Generation of mouse monoclonal antibody against GPR56
The mouse monoclonal antibody was raised against the N-terminal fragment of mouse GPR56 (GPR56N) at the Dana Farber/Harvard Cancer Center Monoclonal Antibody Core. Naturally glycosylated GPR56N-mFc fusion protein (containing amino acids 27–382) was purified from the conditioned media of transfected HEK293T cells and used to immunize Gpr56 knockout mice to generate hybridoma cells. One positive clone, H11, was selected based on its high specificity on both Western blot analysis and IHC (Fig. 1).
Figure 1.

Mouse monoclonal antibody specifically recognizes GPR56. A: Western blot analysis of whole cell lysates of E14.5 Gpr56+/+ and Gpr56−/− brains. Novex Sharp prestained protein marker in SDS-PAGE gels is indicated in kDa. A protein band between 60 and 80 kDa was recognized by antibody H11 in the Gpr56+/+, but not the Gpr56−/− whole cell brain lysates. B: GPR56 IHC staining on coronal sections of E12.5 Gpr56+/+ and Gpr56−/− neocortex using H11 antibody. GPR56 expression (left panel) was detected in Gpr56+/+ but not in the Gpr56−/− (right panel) brains. Scale bar = 50 μm in B (applies to both parts).
Postmitotic neurons express GPR56
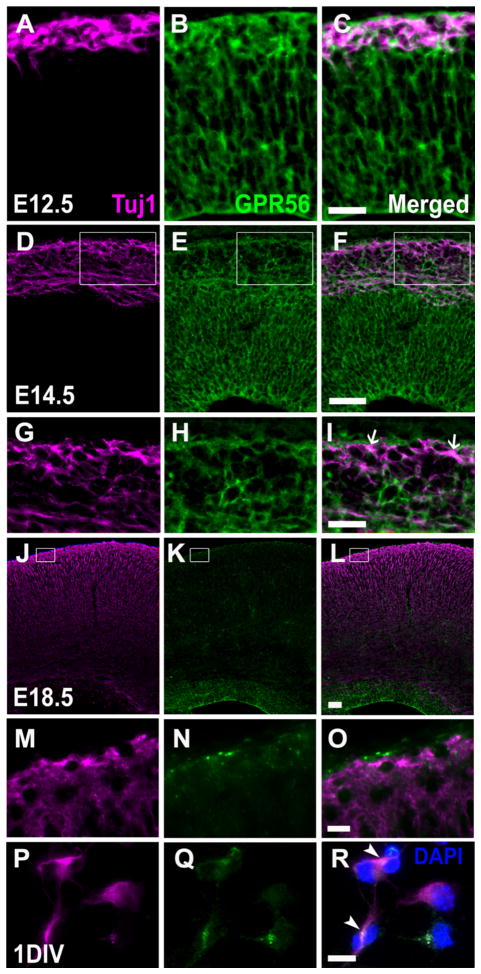
We have previously shown that radial glial cells express GPR56 (Li et al., 2008). However, in an effort to characterize the ligand of GPR56, we recently discovered that the interaction of GPR56 and its ligand, collagen III, inhibits neuronal migration, suggesting a role for GPR56 in migrating neurons (Luo et al., 2011). To examine whether GPR56 is expressed by postmitotic neurons, we performed double IHC of GPR56 and Tuj1 in mouse embryonic brains at E12.5, E14.5, and E18.5. We observed a co-expression of GPR56 and Tuj1 in the pre-plate and marginal zone/subpial neurons in E12.5 and E14.5 brains (Fig. 2A–F). However, GPR56 expression was largely restricted to the ventricular zone (VZ) at E18.5 (Fig. 2J–L). To further demonstrate that Tuj1-positive neurons truly express GPR56, we performed a double immunostaining using H11 and Tuj1 antibodies on 1 day in vitro (1DIV) cultured progenitor cells (Fig. 2P–R). As shown in Figure 2R, some Tuj1-positive cells indeed express GPR56.
Figure 2.
Postmitotic neurons express GPR56. A–F, J–L: Antigens were retrieved for either 8 minutes (E12.5), 12 minutes(E14.5), or 14 minutes (E18.5). Double immunostaining of Tuj1 (magenta) and GPR56 (H11, green) on coronal sections of E12.5 (A–C), E14.5 (D–F), and E18.5 (J–L) neocortex. G–I, M–O: Higher magnification of boxed regions in D–F and J–L. GPR56 is expressed in the Tuj1-positive cell population, most prominently in the preplate at E12.5. By E14.5, only scattered subpial neurons remain positive for GPR56 (arrows in I). P–R: Double immunostaining of Tuj1 and GPR56 on 1DIV progenitor cells fixed in 95% ethanol and 5% glacial acetic acid for 10 minutes at −20°C. Some Tuj1-positve neurons express GPR56 (arrowheads in R). Scale bar = 25 μm in C (applies to A–C) and I (applies to G–I); 50 μm in F (applies to D–F) and L (applies to J–L); 10 μm in O (applies to M–O) and R (applies to P–R).
Anterior-to-posterior gradient expression of GPR56
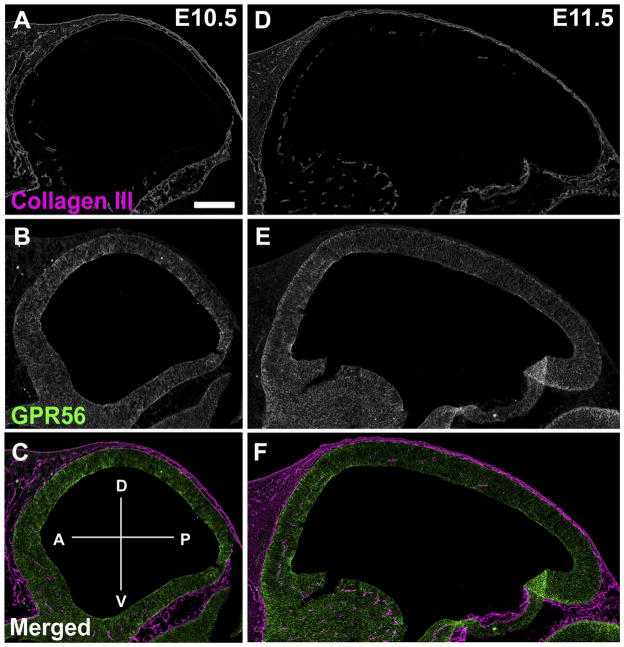
To explore the etiology of the gradient cortical phenotype associated with GPR56 mutations, we first examined the expression pattern of collagen III, the ligand of GPR56. Double IHC of collagen III and GPR56 was conducted on sagittal sections of mouse embryonic brains ranging in age from E10.5 to E11.5. From this analysis, we found that collagen III is largely expressed in the meninges and pial BM, yet no visible expression gradient of collagen III was detected during these developmental stages (Fig. 3A,D).
Figure 3.
Expression pattern of collagen III in developing mouse cortex. A–F: Antigens were retrieved for 8 minutes and double immunostaining of collagen III (magenta) and GPR56 (H11, green) was performed on E10.5 (A–C) and E11.5 (D–F) sagittal mouse cortex. Collagen III was expressed in the meninges and pial BM of both E10.5 and E11.5 brains without visible anterior-to-posterior gradient. A–P and D–V axes are shown in C. Abbreviations: A, anterior; P, posterior; D, dorsal; V, ventral. Scale bar = 200 μm in A (applies to A–F).
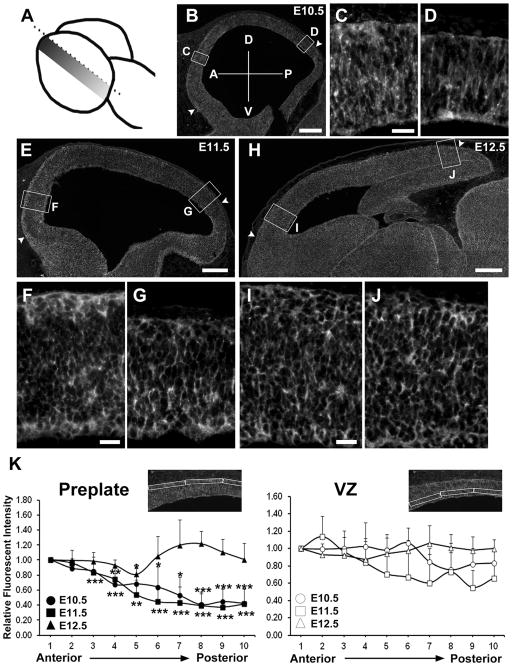
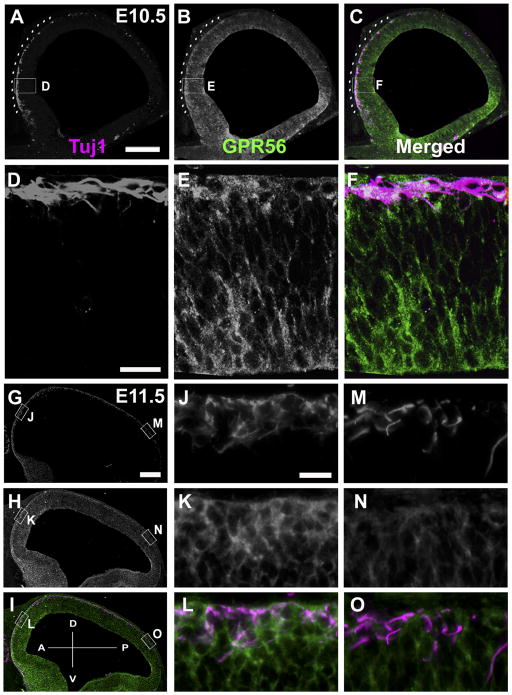
Interestingly, we observed an anterior-to-posterior gradient expression of GPR56 in the preplate neurons in both E10.5 and E11.5 brains (Fig. 3B,E). Next, we carried out a detailed IHC and semiquantification analysis on sagittal sections of E10.5, E11.5, and E12.5 brains. The results were surprising on several accounts. First, we discovered an anterior-to-posterior gradient expression of GPR56 in the basal surface of the neocortex in both E10.5 and E11.5 brains; such a pattern is not apparent within the radial glial cell population (Fig. 4B,E,K). This finding is particularly interesting, as it is the region where preplate neurons reside. The gradient expression pattern, however, dissipated by E12.5 (Fig. 4H). Moreover, there was a parallel gradient pattern in the expression of GPR56 and Tuj1 in E10.5 embryonic brains (Fig. 5A–C). By E11.5, Tuj1-positive neurons covered the entire dorsal surface of the embryonic brain. However, only the rostral one-third of the postmitotic neurons were co-labeled with GPR56 (Fig. 5G–O).
Figure 4.
Gradient expression pattern of GPR56 in early neocortex. A: Schematic representation of embryonic brain showing plane of sectioning (sagittal plane). The shadowed area indicates the region where the brain sections were obtained and analyzed. B–J: IHC of GPR56 (H11, gray) was performed on sagittal sections of E10.5 (B), E11.5 (E), and E12.5 (H) brains followed by antigen retrieval for 8 minutes. Higher magnification views of the boxed regions in B, E, and H for anterior (C,F,I) and posterior (D,G,J) regions of the neocortex. K: The relative fluorescent intensities of GPR56 expression in the region between the two arrowheads in B, E, and H were evenly divided into 10 bins and the intensity was quantified in preplate (left panel) and ventricular zone (VZ; right panel) by using the Image QuantTL program. Data are presented as mean ± SD; n = 3 for all groups. Two-tailed Student’s t-tests were performed with P values denoted as follows: *, P < 0.05; **, P < 0.01; ***, P < 0.005. Anterior (A) to posterior (P) and dorsal (D) to ventral (V) axis is shown in B. Scale bar = 200 μm in B,E,H; 25 μm in C (applies to C,D), F (applies to F,G), and I (applies to I,J).
Figure 5.
GPR56 expression is gradually decreased from anterior to posterior in Tuj1-positive postmitotic neurons. A–C, G–I: Double IHC of Tuj1 (magenta) and GPR56 (H11, green) was performed on sagittal sections of E10.5 (A–C) and E11.5 (G–I) brains. GPR56 expression (B) is parallel with Tuj1-positive postmitotic neurons (A) in the anterior region at E10.5 (C). In the E11.5 brains, GPR56 expression is highly correlated with the Tuj1-positive cell population in the anterior, but not in the posterior region (G–I). D–F, J–O: Higher magnification views of the boxed regions in A–C for anterior (D–F) and in G–I for anterior (J–L) and posterior (M–O). Scale bar = 200 μm in A (applies to A–C) and G (applies to G–I); 20 μm in D (applies to D–F) and J (applies to J–O).
Cajal-Retzius (CR) cells express GPR56
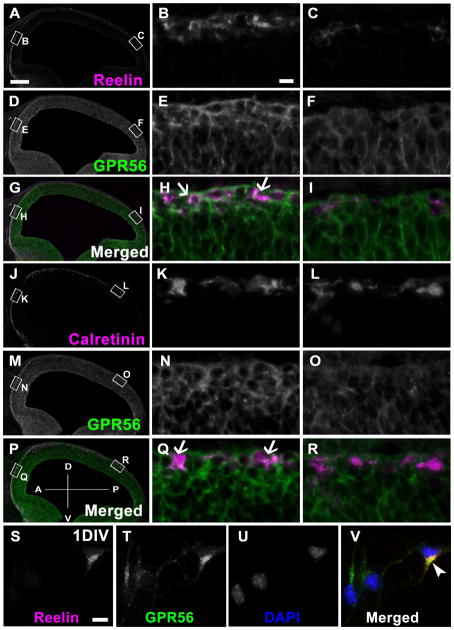
CR cells are the major neurons in the preplate and marginal zone of the developing brain. To investigate whether CR cell populations express GPR56, we carried out a series of double immunostainings. We used calretinin and reelin to reveal the CR cell population. At the basal surface of E11.5 mouse brains, CR cells were present sparsely throughout the dorsal telencephalon, whereas dense GPR56 signals were only detected in the rostral one-third of the neocortex (Fig. 6A,D,G,J,M,P). Most of the CR cells in the rostral region of the brain expressed GPR56, whereas the CR cells in the caudal surface of the neocortex were largely negative for GPR56 (Fig. 6H,I,Q,R). To further demonstrate that CR cells express GPR56, we performed double immunocytochemistry on 1DIV progenitor cells. As shown in Figure 6V, some CR cells indeed express GPR56.
Figure 6.
Cajal-Retzius cells express GPR56. A–R: Double IHC of sagittal E11.5 mouse neocortex shows that reelin-positive (A) and calretinin-positive (J) CR cells are densely distributed in the anterior region, where GPR56 (D,M) is highly co-expressed with them (arrows in H,Q), whereas CR cells are sporadically populated in the posterior region, where GPR56 is largely negative. Higher magnification views of boxed regions in A, D, G, J, M, and P for anterior (B,E,H,K,N,Q) and posterior (C,F,I,L,O,R). S–V: 1DIV progenitor cells were fixed in cold acetone for 10 minutes at −20°C and immunostained with reelin (S, magenta) and GPR56 (199, T, green). Reelin is detected in some cells expressing GPR56 (V, arrowheads). Scale bar = 200 μm in A (applies to A,D,G,J,M,P); 10 μm in B (applies to B,C,E,F,H,I,K,L,N,O,Q,R) and S (applies to S–V).
Intermediate progenitor cells (IPCs) are strongly positive for GPR56
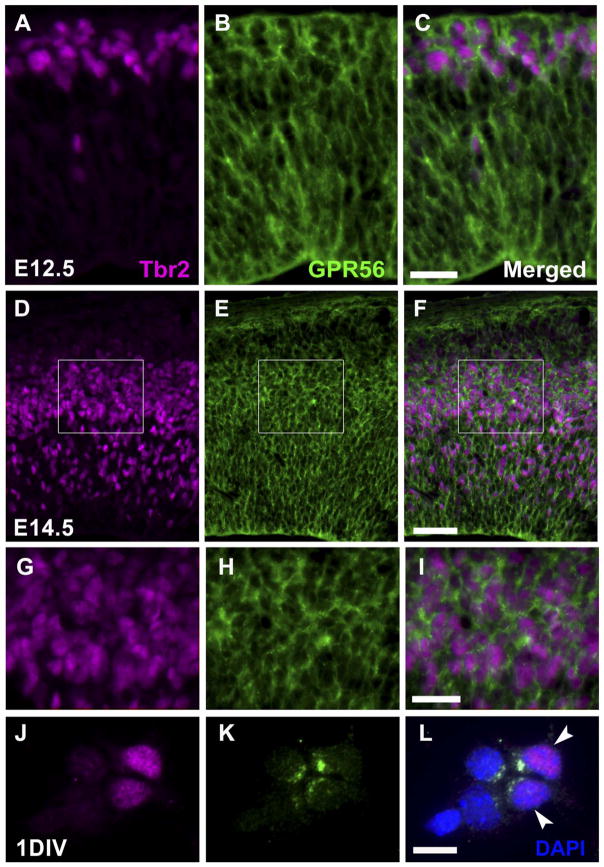
In our previous study, we observed intense GPR56 mRNA expression in the SVZ, a site for IPCs (Piao et al., 2004). Tbr2, a T-domain transcription factor, is highly expressed in IPCs (Englund et al., 2005). To examine whether IPCs themselves express GPR56, we performed double immunostaining of GPR56 and Tbr2 on E12.5 and E14.5 mouse embryonic brains. As expected, Tbr2-positive IPCs strongly express GPR56, suggesting a potentially uncharacterized role for GPR56 in cerebral cortical development (Fig. 7). This observation is further confirmed by double immunocytochemistry on 1DIV progenitor cells (Fig. 7L).
Figure 7.
Intermediate progenitor cells express GPR56. A–F: Immunostaining of Tbr2 (magenta) and GPR56 (green) was performed on coronal sections of E12.5 (A–C) and E14.5 (D–F) neocortex. G–I: Higher magnification views of the boxed regions in D–F. J–L: 1DIV progenitor cells fixed in 95% ethanol and 5% glacial acetic acid were immunostained with Tbr2 (J, magenta) and GPR56 (K, green). GPR56 expression is observed in Tbr2-positive cells (arrowheads in L). Scale bar = 25 μm in C (applies to A–C) and I (applies to G–I); 50 μm in F (applies to D–F); 10 μm in L (applies to J–L).
DISCUSSION
Corticogenesis starts with the first asymmetric division of neural progenitor cells, producing the first wave of postmitotic neurons that migrate along the radial glia processes toward the pia matter. The first-born neurons form the preplate. The second wave splits the preplate into a superficial marginal zone and a deeper subplate, forming the cortical plate in between. Subsequently, the cortical plate expands in an “inside-out” manner, in which newer neurons migrate past the early-born neurons to occupy progressively more superficial layers of the cortex (Ayala et al., 2007; Bystron et al., 2008; Caviness and Rakic, 1978; Gaitanis and Walsh, 2004; Marin and Rubenstein, 2003).
Mutations in GPR56 result in cortical malformation with a decreasing anterior-to-posterior gradient in severity, the mechanism of which was not clear. In this study, we demonstrated that the preplate neurons in the mouse neocortex at E10.5 and E11.5 express GPR56 in an anterior-to-posterior gradient, which is highly correlated with the anatomic distribution of the cortical malformation found in both humans and mice associated with GPR56 mutations. Similarly, our previous work revealed that the expression pattern of GPR56 in cerebellar granule cells accounts for the regional distribution of cerebellar defects associated with Gpr56 gene deletion (Koirala et al., 2009). Taken together, our data suggest that the preplate neurons play an important role in maintaining the integrity of the pial BM and regulating cortical lamination.
IPCs are also called basal progenitors or non-surface-dividing cells (Hevner, 2006). Derived from radial glia, IPCs undergo one or two mitotic cycles to give rise to glutamatergic, pyramidal-projection neurons (Hevner, 2006). IPCs mainly reside in the SVZ of the developing neocortex. Ablation of IPCs by conditional deletion of the mouse Tbr2 in the developing forebrain results in a decrease in cortical surface expansion and thickness as well as neuronal reduction in all cortical layers (Sessa et al., 2008, 2010). Given the fact that GPR56 is implicated in a human cortical malformation and that it shows significant evolutionary differences in its gene structure, it is reasonable to presume that the strong expression of GPR56 in IPCs likely plays a role in regulating the expansion of the cortical surface (Jin et al., 2009; Yu et al., 2009).
In summary, GPR56 is expressed widely in the developing neocortex. How its diverse expression is regulated and what its functions are in different cell lineages, however, remain unknown. In determining the regulation of GPR56 transcription, it is particularly vital to further characterize the promoter region of Gpr56 as well as the contributing transcription factors. By conducting cell type-specific ablation of GPR56, we will be able to study the function of GPR56 in different regions of the developing brain, enabling us to understand how the protein works to regulate brain development as a whole.
Acknowledgments
Grant sponsor: National Institute of Neurological Disorders and Stroke: Grant number: R01 NS057536 (to X.P.); Grant sponsor: the William Randolph Hearst Fund Award (to S.J.); Grant sponsor: the Leonard and Isabelle Goldenson Research Fellowship (to R.L.).
We thank the Monoclonal Antibody Core, Dana Farber/Harvard Cancer Center (supported in part by National Cancer Institute Cancer Center Support Grant P30 CA06516) for their assistance in generating a monoclonal antibody against GPR56.
LITERATURE CITED
- Alcantara S, Ruiz M, D’Arcangelo G, Ezan F, De Lecea L, Curran T, Sotelo C, Soriano E. Regional and cellular patterns of reelin mRNA expression in the forebrain of the developing and adult mouse. J Neurosci. 1998;18:7779–7799. doi: 10.1523/JNEUROSCI.18-19-07779.1998. [DOI] [PMC free article] [PubMed] [Google Scholar]
- Ayala R, Shu T, Tsai LH. Trekking across the brain: the journey of neuronal migration. Cell. 2007;128:29–43. doi: 10.1016/j.cell.2006.12.021. [DOI] [PubMed] [Google Scholar]
- Bahi-Buisson N, Poirier K, Boddaert N, Fallet-Bianco C, Specchio N, Bertini E, Caglayan O, Lascelles K, Elie C, Rambaud J, Baulac M, An I, Dias P, des Portes V, Moutard ML, Soufflet C, El Maleh M, Beldjord C, Villard L, Chelly J. GPR56-related bilateral frontoparietal polymicrogyria: further evidence for an overlap with the cobblestone complex. Brain. 2010;133:3194–3209. doi: 10.1093/brain/awq259. [DOI] [PubMed] [Google Scholar]
- Botella-López A, Burgaya F, Gavín R, García-Ayllón MS, Gómez-Tortosa E, Peña-Casanova J, Ureña JM, Del Río JA, Blesa R, Soriano E, Sáez-Valero J. Reelin expression and glycosylation patterns are altered in Alzheimer’s disease. Proc Natl Acad Sci U S A. 2006;103:5573–5578. doi: 10.1073/pnas.0601279103. [DOI] [PMC free article] [PubMed] [Google Scholar]
- Brown D, Lydon J, McLaughlin M, Stuart-Tilley A, Tyszkowski R, Alper S. Antigen retrieval in cryostat tissue sections and cultured cells by treatment with sodium dodecyl sulfate (SDS) Histochem Cell Biol. 1996;105:261–267. doi: 10.1007/BF01463929. [DOI] [PubMed] [Google Scholar]
- Bulfone A, Martinez S, Marigo V, Campanella M, Basile A, Quaderi N, Gattuso C, Rubenstein JL, Ballabio A. Expression pattern of the Tbr2 (Eomesodermin) gene during mouse and chick brain development. Mech Dev. 1999;84:133–138. doi: 10.1016/s0925-4773(99)00053-2. [DOI] [PubMed] [Google Scholar]
- Bystron I, Blakemore C, Rakic P. Development of the human cerebral cortex: Boulder Committee revisited. Nat Rev Neurosci. 2008;9:110–122. doi: 10.1038/nrn2252. [DOI] [PubMed] [Google Scholar]
- Caviness VS, Jr, Rakic P. Mechanisms of cortical development: a view from mutations in mice. Annu Rev Neurosci. 1978;1:297–326. doi: 10.1146/annurev.ne.01.030178.001501. [DOI] [PubMed] [Google Scholar]
- Chang BS, Piao X, Bodell A, Basel-Vanagaite L, Straussberg R, Dobyns WB, Qasrawi B, Winter RM, Innes AM, Voit T, Grant PE, Barkovich AJ, Walsh CA. Bilateral frontoparietal polymicrogyria: clinical and radiological features in 10 families with linkage to chromosome 16. Ann Neurol. 2003;53:596–606. doi: 10.1002/ana.10520. [DOI] [PubMed] [Google Scholar]
- Englund C, Fink A, Lau C, Pham D, Daza RA, Bulfone A, Kowalczyk T, Hevner RF. Pax6, Tbr2, and Tbr1 are expressed sequentially by radial glia, intermediate progenitor cells, and postmitotic neurons in developing neocortex. J Neurosci. 2005;25:247–251. doi: 10.1523/JNEUROSCI.2899-04.2005. [DOI] [PMC free article] [PubMed] [Google Scholar]
- Gaitanis JN, Walsh CA. Genetics of disorders of cortical development. Neuroimaging Clin N Am. 2004;14:219–229. viii. doi: 10.1016/j.nic.2004.03.007. [DOI] [PubMed] [Google Scholar]
- Hevner RF. From radial glia to pyramidal-projection neuron: transcription factor cascades in cerebral cortex development. Mol Neurobiol. 2006;33:33–50. doi: 10.1385/MN:33:1:033. [DOI] [PubMed] [Google Scholar]
- Hevner R, Neogi T, Englund C, Daza RAM, Fink A. Cajal–Retzius cells in the mouse: transcription factors, neurotransmitters, and birthdays suggest a pallial origin. Dev Brain Res. 2003;141:39–53. doi: 10.1016/s0165-3806(02)00641-7. [DOI] [PubMed] [Google Scholar]
- Jaglin XH, Poirier K, Saillour Y, Buhler E, Tian G, Bahi-Buisson N, Fallet-Bianco C, Phan-Dinh-Tuy F, Kong XP, Bomont P, Castelnau-Ptakhine L, Odent S, Loget P, Kossorotoff M, Snoeck I, Plessis G, Parent P, Beldjord C, Cardoso C, Represa A, Flint J, Keays DA, Cowan NJ, Chelly J. Mutations in the beta-tubulin gene TUBB2B result in asymmetrical polymicrogyria. Nat Genet. 2009;41:746–752. doi: 10.1038/ng.380. [DOI] [PMC free article] [PubMed] [Google Scholar]
- Jin Z, Luo R, Piao X. GPR56 and its related diseases. Prog Mol Biol Transl Sci. 2009;89:1–13. doi: 10.1016/S1877-1173(09)89001-7. [DOI] [PubMed] [Google Scholar]
- Koirala S, Jin Z, Piao X, Corfas G. GPR56-regulated granule cell adhesion is essential for rostral cerebellar development. J Neurosci. 2009;29:7439–7449. doi: 10.1523/JNEUROSCI.1182-09.2009. [DOI] [PMC free article] [PubMed] [Google Scholar]
- Kwiatkowski AV, Rubinson DA, Dent EW, Edward van Veen J, Leslie JD, Zhang J, Mebane LM, Philippar U, Pinheiro EM, Burds AA, Bronson RT, Mori S, Fassler R, Gertler FB. Ena/VASP is required for neuritogenesis in the developing cortex. Neuron. 2007;56:441–455. doi: 10.1016/j.neuron.2007.09.008. [DOI] [PubMed] [Google Scholar]
- Li S, Jin Z, Koirala S, Bu L, Xu L, Hynes RO, Walsh CA, Corfas G, Piao X. GPR56 regulates pial basement membrane integrity and cortical lamination. J Neurosci. 2008;28:5817–5826. doi: 10.1523/JNEUROSCI.0853-08.2008. [DOI] [PMC free article] [PubMed] [Google Scholar]
- Luo R, Jeong SJ, Jin Z, Strokes N, Li S, Piao X. G protein-coupled receptor 56 and collagen III, a receptor-ligand pair, regulates cortical development and lamination. Proc Natl Acad Sci U S A. 2011;108:12925–12930. doi: 10.1073/pnas.1104821108. [DOI] [PMC free article] [PubMed] [Google Scholar]
- Marin O, Rubenstein JL. Cell migration in the forebrain. Annu Rev Neurosci. 2003;26:441–483. doi: 10.1146/annurev.neuro.26.041002.131058. [DOI] [PubMed] [Google Scholar]
- Moers A, Nurnberg A, Goebbels S, Wettschureck N, Offermanns S. Galpha12/Galpha13 deficiency causes localized overmigration of neurons in the developing cerebral and cerebellar cortices. Mol Cell Biol. 2008;28:1480–1488. doi: 10.1128/MCB.00651-07. [DOI] [PMC free article] [PubMed] [Google Scholar]
- Olson EC, Walsh CA. Smooth, rough and upside-down neocortical development. Curr Opin Genet Dev. 2002;12:320–327. doi: 10.1016/s0959-437x(02)00305-2. [DOI] [PubMed] [Google Scholar]
- Piao X, Basel-Vanagaite L, Straussberg R, Grant PE, Pugh EW, Doheny K, Doan B, Hong SE, Shugart YY, Walsh CA. An autosomal recessive form of bilateral frontoparietal polymicrogyria maps to chromosome 16q12.2–21. Am J Hum Genet. 2002;70:1028–1033. doi: 10.1086/339552. [DOI] [PMC free article] [PubMed] [Google Scholar]
- Piao X, Hill RS, Bodell A, Chang BS, Basel-Vanagaite L, Straussberg R, Dobyns WB, Qasrawi B, Winter RM, Innes AM, Voit T, Ross ME, Michaud JL, Descarie JC, Barkovich AJ, Walsh CA. G protein-coupled receptor-dependent development of human frontal cortex. Science. 2004;303:2033–2036. doi: 10.1126/science.1092780. [DOI] [PubMed] [Google Scholar]
- Piao X, Chang BS, Bodell A, Woods K, Benzeev B, Topcu M, Guerrini R, Goldberg-Stern H, Sztriha L, Dobyns WB, Barkovich AJ, Walsh CA. Genotype-phenotype analysis of human frontoparietal polymicrogyria syndromes. Ann Neurol. 2005;58:680–687. doi: 10.1002/ana.20616. [DOI] [PubMed] [Google Scholar]
- Sarkisian MR, Bartley CM, Chi H, Nakamura F, Hashimoto-Torii K, Torii M, Flavell RA, Rakic P. MEKK4 signaling regulates filamin expression and neuronal migration. Neuron. 2006;52:789–801. doi: 10.1016/j.neuron.2006.10.024. [DOI] [PMC free article] [PubMed] [Google Scholar]
- Sessa A, Mao CA, Hadjantonakis AK, Klein WH, Broccoli V. Tbr2 directs conversion of radial glia into basal precursors and guides neuronal amplification by indirect neurogenesis in the developing neocortex. Neuron. 2008;60:56–69. doi: 10.1016/j.neuron.2008.09.028. [DOI] [PMC free article] [PubMed] [Google Scholar]
- Sessa A, Mao CA, Colasante G, Nini A, Klein WH, Broccoli V. Tbr2-positive intermediate (basal) neuronal progenitors safeguard cerebral cortex expansion by controlling amplification of pallial glutamatergic neurons and attraction of subpallial GABAergic interneurons. Genes Dev. 2010;24:1816–1826. doi: 10.1101/gad.575410. [DOI] [PMC free article] [PubMed] [Google Scholar]
- Yu F, Keinan A, Chen H, Ferland RJ, Hill RS, Mignault AA, Walsh CA, Reich D. Detecting natural selection by empirical comparison to random regions of the genome. Hum Mol Genet. 2009;18:4853–4867. doi: 10.1093/hmg/ddp457. [DOI] [PMC free article] [PubMed] [Google Scholar]


