Abstract
Background
Mice are well suited for modeling human congenital heart defects (CHD), given their four-chamber cardiac anatomy. However, mice with CHD invariably die prenatally/neonatally, causing CHD phenotypes to be missed. Therefore, we investigated the efficacy of noninvasive micro-computed tomography (micro-CT) to screen for CHD in stillborn/fetal mice. These studies were carried out using chemically mutagenized mice expected to be enriched for birth defects including CHD.
Methods and Results
Stillborn/fetal mice obtained from the breeding of N-ethyl-N-nitrosourea (ENU) mutagenized mice were formalin-fixed and stained with iodine, then micro-CT scanned. Those diagnosed with CHD and some CHD-negative pups were necropsied. A subset of these were further analyzed by histopathology to confirm the CHD/no-CHD diagnosis. Micro-CT scanning of 2105 fetal/newborn mice revealed an abundance of ventricular septal defects (VSD) (n=307). Overall, we observed an accuracy of 89.8% for VSD diagnosis. Outflow tract anomalies identified by micro-CT included double outlet right ventricle (n=36), transposition of the great arteries (n=14), and persistent truncus arteriosus (n=3). These were diagnosed with a 97.4% accuracy. Aortic arch anomalies also were readily detected with an overall 99.6% accuracy. This included right aortic arch (n=28) and coarctation/interrupted aortic arch (n=12). Also detected by micro-CT were atrioventricular septal defects (n=22), tricuspid hypoplasia/atresia (n=13), and coronary artery fistulas (n=16). They yielded accuracies of 98.9%, 100%, and 97.8% respectively.
Conclusions
Contrast enhanced micro-CT imaging in neonatal/fetal mice can reliably detect a wide spectrum of CHD. We conclude micro-CT imaging can be used for routine rapid assessments of structural heart defects in fetal/newborn mice.
Keywords: micro-computed tomography, congenital heart disease, ENU, mouse mutagenesis screen
Congenital heart disease (CHD) is one of the most common birth defects and over the last decade, mice have become the model system of choice for studying CHD1. Thus mice have similar cardiovascular anatomy as humans - both exhibiting a four-chamber heart with separate pulmonary/systemic circulation that are the major substrates for CHD. However, CHD diagnosis in mice is challenging, given mice with structural heart defects invariably die prenatally or neonatally2. Also, due to the very small size of the fetal/newborn mouse heart, the requisite necropsy and histopathology examination required for CHD diagnosis is difficult. Therefore, in the current era of functional genomics, improved high-throughput phenotyping with proven efficacy is necessary to allow for complete annotation of the mammalian genome, such as in the analysis of knockout and mutant mice being generated in mutagenesis screens or through knockout mouse production in KOMP/KOMP23, 4.
Micro-computed tomography (micro-CT) is an attractive imaging modality for high-throughput fetal/neonatal phenotyping of structural heart defects in mice, especially when this is combined with the use of iodine-based reagent for contrast enhancement5–7. This non-destructive imaging method can provide isotropic resolutions as high as 5 to 10μm, with one study showing feasibility in identifying outflow tract septation defects and aortic arch anomalies in newborn mice5. However, the spectrum of structural heart defects that can be detected in newborn mice by contrast enhanced micro-CT imaging and its detection sensitivity and accuracy have not been evaluated. Furthermore, the feasibility of phenotyping fetal mice by micro-CT imaging has not been examined.
In this study, we evaluated the spectrum of CHD that can be detected by micro-CT imaging in neonatal and fetal mice using animals generated from a N-ethyl-N-nitrosourea (ENU) mutagenized mouse colony. This provided an ideal context to assess the efficacy of micro-CT imaging for CHD diagnosis, as this population of mice is expected to be enriched for mutants with CHD8.
Methods
Sample Preparation
C57BL6/J ENU mutagenized mice were bred for recessive mutations in a two-generation backcross breeding scheme as described previously8, 9. G3 fetuses/pups were fixed in 10% formalin for 48 hours prior to iodine staining for micro-CT imaging. After washing twice with distilled water, iodine-staining was carried out using a solution of 25% Lugol5 with 5% of iodine metal (Sigma-Aldrich). Samples were stained for 48–72 hours, micro-CT scanned, and returned to 10% formalin to de-stain for necropsy and histological analysis. All animal studies were approved by the Institutional Animal Care and Use Committee of the University of Pittsburgh.
Micro-CT Scanning
Mouse fetuses/pups were placed in a custom cradle accommodating 12 neonates, and scanned using the Siemens Inveon Multimodality micro-CT scanner (Siemens Medical Solutions Inc., Knoxville, TN) set to 80 kVp/100μA, and 500–800 milliseconds exposure. The detector and X-ray source were rotated 220 degrees in 1-degree steps, calibration exposures configured to 30, and the field-of-view set at maximum voxel size of 50x50x50mm3. Neonates were scanned at 45μm resolution (45x45x45μm/voxel), while fetuses were scanned at 15μm (15x15x15μm/voxel). CT data were DICOM converted and examined using OsiriX DICOM Viewer (Version 3.8.1; the OsiriX Foundation, Geneva, Switzerland). Typically coronal (anteroposterior), transverse (cross-section), and sagittal views were generated for CHD diagnosis.
Necropsy and Histopathology Assessments
Fetuses/pups determined to have CHD were further evaluated by necropsy and histopathology to confirm the micro-CT assessed CHD diagnosis. Necropsy was performed using a stereomicroscope to examine detailed cardiovascular anatomy. For samples suspected to have structural heart defects, the heart/lung was paraffin embedded, and sectioned using an SM2500 sledge microtome and imaged using episcopic fluorescence image capture (EFIC) as previously described10. EFIC provides serial 2D serial image stacks that are in perfect registration similar to micro-CT/micro-MRI datasets10, 11. As a result, the serial digital images collected can be digitally re-sectioned in any imaging plane or reconstructed in 3D using Osirix or Volocity (Perkin Elmer, Branford, CT, USA). This allowed a full assessment of intracradiac anatomy for CHD diagnosis in every specimen. This same EFIC imaging analysis was carried out for a subset of pups determined not to have CHD based on the micro-CT imaging analysis. This was carried out to estimate the false negative rate for micro-CT diagnosis of CHD
Intra-observer and Inter-observer Variability
To determine the intra- and inter-observer variability in micro-CT diagnosis, a pediatric cardiologist and pathologist assistant who conducted most of the micro-CT diagnosis reanalyzed the micro-CT data for 84 pups. This was conducted approximately 6–10 months from the original date of diagnosis. Each evaluator was blinded with respect to the other individual’s diagnoses, and to his own prior diagnosis. The data generated from this reassessment was used to calculate the inter- and intra-observer variability and the Kappa coefficient were calculated to assess intra-observer (comparison of diagnoses made at two different time points by the same evaluator) and inter-observer (comparison of diagnoses made by two different evaluators) variability. The strength of intra- and inter-observer agreement were defined by the following Kappa coefficient values: almost perfect (>0.80), substantial (0.60–0.79), moderate (0.40–0.59), fair (0.20–0.39), and poor (<0.20) intra- and inter-observer agreement12.
Specificity, Sensitivity, and Accuracy of Micro-CT Imaging
The specificity and sensitivity of micro-CT imaging in identifying each specific CHD were calculated as follows. The sensitivity corresponded to the number of confirmed CHD diagnosis divided by the number of confirmed plus missed CHD (erroneous no-CHD) diagnoses as determined by histopathological analysis. It provided an assessment of the efficacy of micro-CT in correctly identifying CHD. Specificity is calculated as the number of confirmed no-CHD diagnoses divided by the number of confirmed no-CHD plus erroneous no-CHD diagnoses. It provided an estimate of the efficacy of micro-CT in not misidentifying normal no-CHD samples as having CHD. The overall accuracy is calculated by summing the number of confirmed CHD and no-CHD diagnoses identified by micro-CT for each specific defect divided by the total micro-CT scanned fetuses/neonates.
Results
We conducted micro-CT scans of 2,105 mice generated from an ENU mutagenesis colony, comprising 1,968 newborn pups and 137 mid to late term fetuses (E14.5 to E17.5). Micro-CT scanning was conducted at 45μm resolution for neonates, and 15μm resolution for fetal mice. These resolutions were determined to be sufficient for visualizing all of the major cardiovascular anatomy in the fetal and neonatal mouse. From this analysis, we identified 380 pups (19.3%), and 41 fetuses (29.9%) with structural heart defects (Table 1).
Table 1.
Micro-CT Phenotyping for Congenital Heart Defects in Neonatal and Fetal Mice
| Summary | # Total (%) | # Neonates (%) | # Fetuses (%) |
|---|---|---|---|
| Total # Scanned by Micro-CT | 2105 | 1968 | 137 |
| Total # with congenital heart defects | 421 (20.0%) | 380 (19.3%) | 41 (29.9%) |
| Cardiac Phenotype | |||
| Ventricular Septal Defect (VSD) | 307 (14.6%) | 285 (14.5%) | 22 (16.1%) |
| - Perimembranous VSD | 189 (9.00%) | 175 (8.89%) | 14 (10.2%) |
| - Muscular VSD | 120 (5.70%) | 111 (5.64%) | 9 (6.57%) |
| Double Outlet Right Ventricle | 36 (1.71%) | 26 (1.32%) | 10 (7.30%) |
| - with VSD | 35 (1.66%) | 26 (1.32%) | 9 (6.57%) |
| - with AVSD | 9 (0.43%) | 5 (0.25%) | 4 (2.92%) |
| - with Hypoplastic Pulmonary Artery | 2 (0.10%) | 0 (0.00%) | 2 (1.46%) |
| Transposition of the Great Arteries | 14 (0.67%) | 13 (0.66%) | 1 (0.73%) |
| - with VSD | 10 (0.48%) | 10 (0.51%) | 0 (0.00%) |
| - with AVSD | 3 (0.14%) | 3 (0.15%) | 0 (0.00%) |
| Persistent Truncus Arteriosus | 3 (0.14%) | 1 (0.05%) | 2 (1.46%) |
| Right Aortic Arch | 28 (1.33%) | 21 (1.07%) | 7 (5.11%) |
| Aortic Coarctation or Interruption | 12 (0.57%) | 10 (0.51%) | 2 (1.46%) |
| Atrioventricular Septal Defect | 22 (1.05%) | 17 (0.86%) | 5 (3.65%) |
| Tricuspid Hypoplasia/Atresia | 13 (0.62%) | 10 (0.51%) | 3 (2.19%) |
| Coronary Artery Fistula | 16 (0.76%) | 15 (0.76%) | 1 (0.73%) |
| Dextrocardia | 6 (0.29%) | 6 (0.30%) | 0 (0.00%) |
All of the fetuses/pups with CHD were necropsied, and for 160 samples (18 fetuses/142 neonates), EFIC histopathology was carried out to confirm the structural heart defect diagnosis. EFIC is a high-resolution histological imaging technique (0.1x0.1x0.1μm/voxel) that streamlines structural heart defect assessment by allowing visualization of intracardiac anatomy in three dimensions (see Methods) and was used as the gold standard for CHD diagnosis in this study. In parallel, we also carried out necropsy and EFIC histopathology examination of 114 fetuses/pups identified by micro-CT as CHD negative. These were selected from litters in which other fetuses/pups had been identified with CHD.
Statistical power calculations showed the combined 274 CHD positive/CHD negative samples were more than adequate for VSD assessment given its high prevalence (0.146; Table 1). Thus for VSD, only 62 samples are required to achieve 93% power at 5% significance level for detecting a change in sensitivity from 0.5 to 0.95 using a two-sided binomial test. Similar power was not achieved for other CHD with lower prevalence, as many more samples would be required - 526 for double outlet right ventricle (prevalence of 0.0171; Table 1), and 1184 for coronary fistulas (prevalence of 0.0076; Table 1).
The overall reproducibility of the micro-CT assessments was also evaluated with analysis of inter- and intra-observer variability12 using Kappa coefficients calculated based on CHD diagnosis obtained by EFIC histopathology. This showed micro-CT inter-observer variability of 0.90, while intra-observer variability was 0.88. These results showed overall micro-CT diagnostic reproducibility was excellent.
Micro-CT Detection of Ventricular Septal Defects
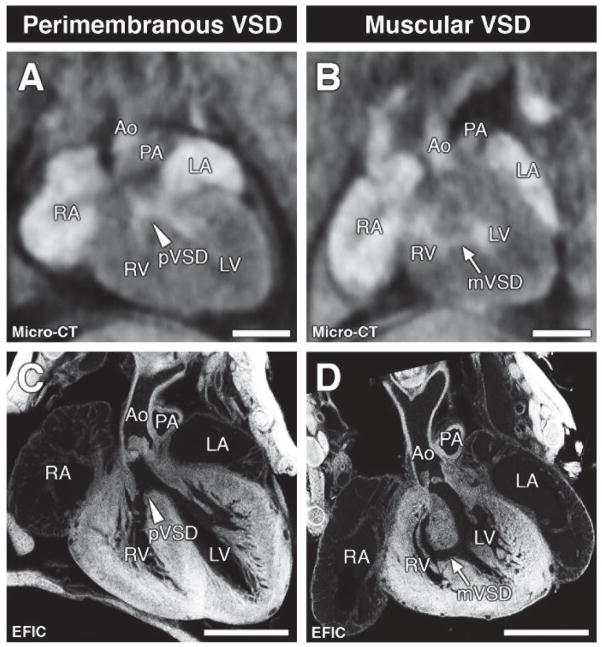
The most prevalent structural heart defect detected consisted of VSDs (n=307), corresponding to 14.6% of mice that were micro-CT scanned (Figure 1; Table 1). This included 189 perimembranous VSDs (9%) (Figure 1A, C) and 120 muscular VSDs (5.7%) (Figure 1B, D), 12 of which had both perimembranous and muscular VSDs. The incidence of VSDs were similar in neonates (14.5%) and fetuses (16.1%) (Table 1). The efficacy of micro-CT in VSD diagnosis was evaluated by EFIC histopathology examination. Of the 274 samples analyzed by EFIC imaging (160 diagnosed by micro-CT as CHD positive and 114 CHD negative), 84 had VSDs. This is comprised of 72 samples that were micro-CT diagnosed and 12 samples with VSD missed by micro-CT (9 with perimembranous, 3 with small muscular VSD). Of the 160 micro-CT diagnosed VSD samples,16 were found to be normal. Together these findings show micro-CT has a VSD detection sensitivity of 85.7%, specificity of 91.6% and accuracy of 89.8% (see Methods).
Figure 1. Ventricular septal defects.
Micro-CT (A, B) and corresponding EFIC histology images (C, D) showing a perimembranous (pVSD, arrowhead; A, C) or muscular VSD (mVSD, arrow; B, D) in the four-chamber view. Scale bars = 1mm.
Ao = aorta; LA = left atrium, LV = left ventricle; PA = pulmonary artery; RA= right atrium, RV = right ventricle.
Micro-CT Detection of Aortic Arch Anomalies
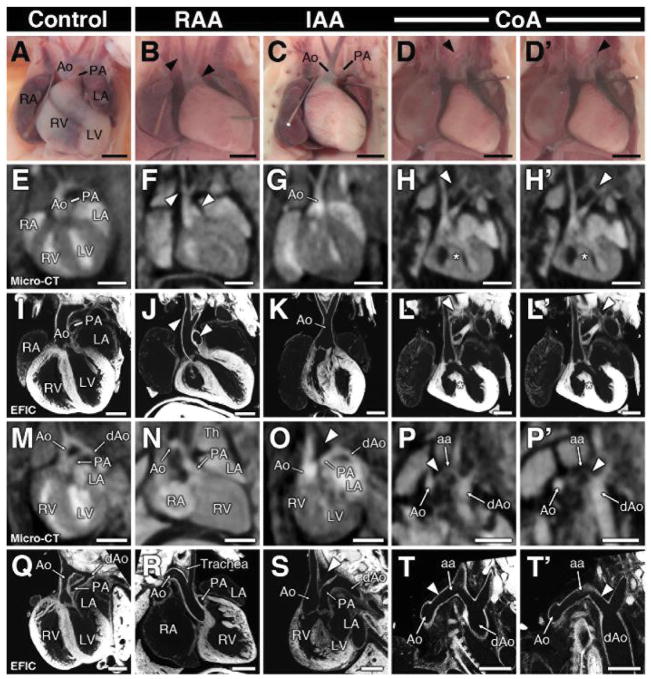
Micro-CT imaging readily detected aortic arch anomalies (Figure 2), including right aortic arch (RAA), interrupted aortic arch (IAA), and coarctation (CoA). As the narrowed portion of the aorta was often difficult to visualize (Figure 2H, H′, P, P′), CoA and IAA were combined into one defect category (Figure 2G, K, O, S; Table 1). Micro-CT identified aortic arch defects in 38 fetuses/pups (1.9%), with 28 RAA and 12 IAA/CoA. This included 2 animals exhibiting both RAA and IAA/CoA (Table 1). Amongst the 9 fetuses identified with arch anomalies, 7 exhibited RAA and 2 had IAA/CoA. All of the aortic arch anomalies identified by micro-CT were confirmed by necropsy, with 21 further validated by EFIC imaging. Of the latter, 15 had RAA, and 6 showed IAA or CoA. Of the remaining fetuses/pups analyzed by EFIC histopathology, only one had an aortic arch anomaly that was missed, a pre-ductal CoA. Together this yielded a sensitivity of 95.5%, specificity of 100%, and overall accuracy of 99.6% (Table 2).
Figure 2. Aortic arch anomalies.
Visualization of aortic arch by necropsy (A–D′) and by micro-CT and EFIC imaging in the coronal (E–L′) and frontal-oblique plane (M–T′). Aortic arch anomalies detected by micro-CT include right aortic arch (RAA; B, F, J, N, R), interrupted aortic arch (IAA; C, G, K, O, S), and coarctation (CoA; D, D′, H, H′, L, L′, P, P′, T, T′). Arrowheads in panels B, F, J denote right aortic arch and orientation of the pulmonary artery. Note the aortic arch artery in panel R descends to the right of the trachea. An arrowhead in (O,S) depicts the interrupted segment of the aortic arch, with the ductus arteriosus extending and connecting to the descending aorta. Two regions of aortic coarctation in the same heart are shown in two separate panels (columns D, D′). In (P′, T′), the image orientation was tilted to show the descending aorta (P′,T′).
Scale bars = 1mm (A–H′, M–P′), and 0.5mm (I–L′, Q–T′).
aa = aortic arch; dAo = descending aorta; Th = thymus.
Table 2.
EFIC Confirmation of Micro-CT Diagnosis of CHD in Fetal and Neonatal Mice
| Cardiac Diagnosis | CHD Diagnosis Confirmed‡ | Missed CHD Diagnosis§ | Sensitivity|| | Specificity# | Accuracy** |
|---|---|---|---|---|---|
| Neonates | |||||
| VSD | 62/78 | 11/178 | 84.9% (62/73) | 91.3% (167/183) | 89.5% |
| Outflow Tract Defects* | 22/24 | 5/232 | 81.5% (22/27) | 99.1% (227/229) | 97.3% |
| Aortic Arch Defects† | 17/17 | 1/239 | 94.4% (17/18) | 100% (238/238) | 99.6% |
| AVSD | 9/10 | 1/246 | 90.0% (9/10) | 99.6% (245/246) | 99.2% |
| Coronary Artery Fistula | 5/6 | 5/268 | 50.0% (5/10) | 99.6% (263/264) | 97.8% |
| Tricuspid Hypoplasia/Atresia | 3/3 | 0/253 | 100% (3/3) | 100% (253/253) | 100% |
| Dextrocardia | 4/4 | 0/270 | 100% (4/4) | 100% (270/270) | 100% |
| Fetuses | |||||
| VSD | 10/10 | 1/8 | 90.9% (10/11) | 100% (7/7) | 94.4% |
| Outflow Tract Defects* | 9/9 | 0/9 | 100% (9/9) | 100% (9/9) | 100% |
| Aortic Arch Defects† | 4/4 | 0/14 | 100% (4/4) | 100% (14/14) | 100% |
| AVSD | 5/5 | 1/13 | 83.3% (5/6) | 100% (12/12) | 94.4% |
| Coronary Artery Fistula | --- | --- | --- | --- | --- |
| Triscupid Hypoplasia/Atresia | 1/1 | 0/17 | 100% (1/1) | 100% (17/17) | 100% |
| Dextrocardia | --- | --- | --- | --- | --- |
| Neonates + Fetuses | |||||
| VSD | 72/88 | 12/186 | 85.7% (72/84) | 91.6% (174/190) | 89.8% |
| Outflow Tract Defects* | 31/33 | 5/241 | 86.1% (31/36) | 99.2% (236/238) | 97.4% |
| Aortic Arch Defects† | 21/21 | 1/253 | 95.5% (21/22) | 100% (252/252) | 99.6% |
| AVSD | 14/15 | 2/259 | 87.5% (14/16) | 99.6% (257/258) | 98.9% |
| Coronary Artery Fistula | 5/6 | 5/268 | 50.0% (5/10) | 99.6% (263/264) | 97.8% |
| Tricuspid Hypoplasia/Atresia | 4/4 | 0/270 | 100% (4/4) | 100% (270/270) | 100% |
| Dextrocardia | 4/4 | 0/270 | 100% (4/4) | 100% (270/270) | 100% |
VSD = ventricular septal defect; AVSD = atrioventricular septal defect.
Transposition of the great arteries, double outlet right ventricle and persistent truncus arteriosus.
Right aortic arch and coarctation/interrupted aortic arch.
CHD Diagnoses Confirmed = (No. of confirmed micro-CT “CHD” diagnoses)/(total no. of micro-CT “CHD” diagnoses).
Missed CHD Diagnosis = (no. of confirmed false-negative “No-CHD” Micro-CT diagnoses)/(total no. of Micro-CT “No-CHD” diagnoses).
Sensitivity = (no. of confirmed micro-CT “CHD” diagnoses)/(no. of confirmed CHD + no. of confirmed false-negative “No-CHD” diagnoses).
Specificity = (no. of confirmed “No-CHD” diagnoses)/(no. of confirmed “No-CHD” diagnoses + no. of false-positive “CHD” diagnoses).
Accuracy = (no. of confirmed “CHD” + no. of confirmed “No-CHD” diagnoses)/(total no. of micro-CT scanned animals).
Micro-CT Detection of Outflow Tract Anomalies
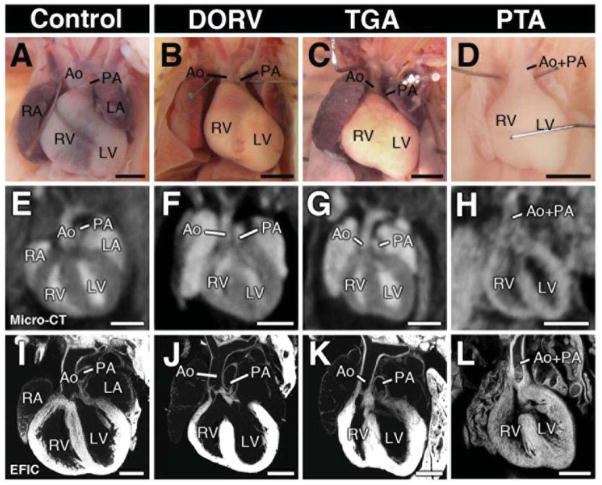
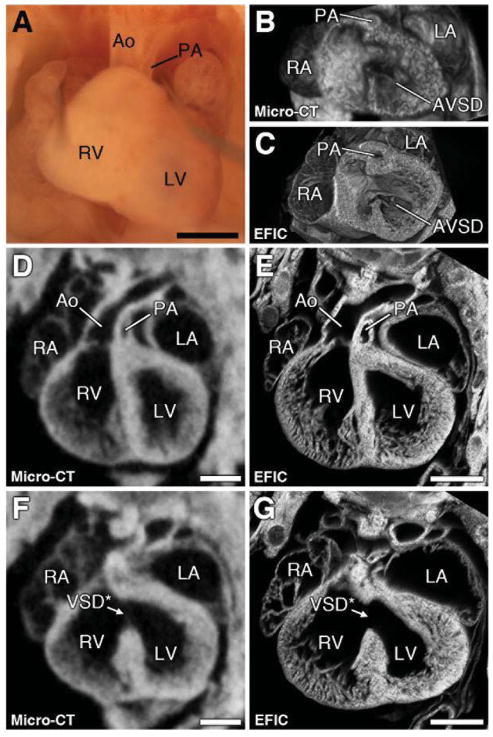
Micro-CT imaging indicated 53 (2.5%) fetuses/pups had outflow tract (OFT) anomalies, including double outlet right ventricle (DORV), transposition of the great arteries (TGA), and persistent truncus arteriosus (PTA) (Figure 3). Thirteen of the 55 samples were fetuses. Shown in Figure 4 is an E15.5 fetus micro-CT diagnosed with double outlet right ventricle (DORV), hypoplastic pulmonary artery, stenotic pulmonary valve, and a large ventricular septal defect (VSD) (Figure 4A, D, F). All the diagnoses in this fetus were confirmed by EFIC histopathology (Figure 4E, G). 3D rendering of EFIC or micro-CT imaging data showed the VSD was part of an atrioventricular septal defect (AVSD) (Figure 4B, C; Supplemental Videos S1 and S2).
Figure 3. Outflow tract malalignment defects.
Micro-CT in the coronal imaging plane revealed OFT malalignment defects, including double outlet right ventricle (DORV; F), transposition of the great arteries (TGA;G) and persistent truncus arteriosus (PTA;H). Necropsy and EFIC image of each heart is shown in (A–D) and (E–L).
Scale bars = 1mm (A–H), 0.5mm (I–L).
Figure 4. DORV with pulmonary artery hypoplasia and AVSD.
Micro-CT imaging of a mouse at E16.5 showed the aorta arising from the right ventricle with hypoplastic pulmonary artery and a large VSD (asterisk in F, G). Subsequent necropsy (A) and EFIC histology (E) confirmed the pulmonary artery hypoplasias. 3D rendering of the micro-CT (B) and EFIC (C) images revealed the VSD is part of a four-leaflet common atrioventricular valve, indicating an atrioventricular septal defect (B, C). Scale bars = 1mm (A), 0.5mm (D–G). AVSD = atrioventricular septal defect.
Overall, micro-CT imaging identified 36 animals with DORV, 14 with TGA, and 3 with PTA. EFIC analysis confirmed the OFT CT-diagnosis in 31 of 36 samples, while amongst the other EFIC analyzed specimen, there were 6 shown to have OFT anomalies that were missed by micro-CT - 2 from the 160 CHD positive and 4 from the 114 CHD negative micro-CT analyzed samples. This yielded a sensitivity of 86.1% and specificity of 99.2%, and an overall accuracy of 97.4% (Table 2). It should be noted 9 of the 13 fetuses with micro-CT diagnosis of OFT anomalies were EFIC analyzed, and in all 9 cases, their CHD diagnosis were confirmed. This demonstrates the efficacy of micro-CT in detecting OFT anomalies in fetal mice.
Micro-CT Detection of Other Cardiac Anomalies
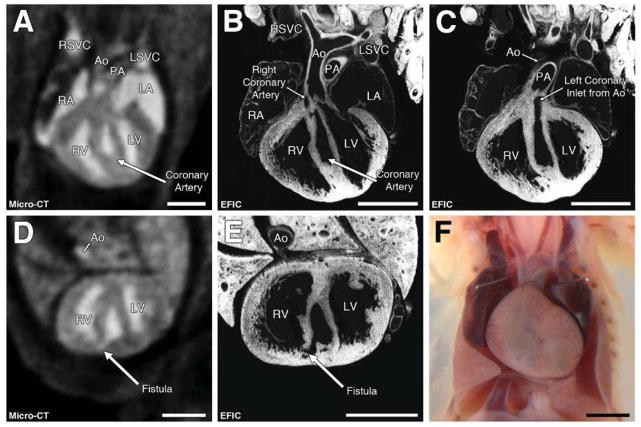
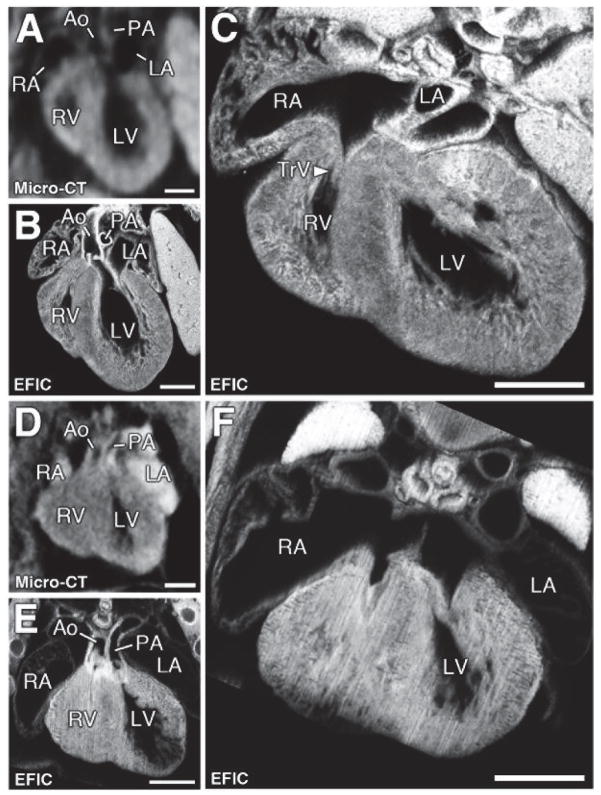
Micro-CT imaging identified other structural heart anomalies, including coronary artery fistulas, AVSD, and tricuspid valve hypoplasia/atresia (TA). Coronary artery fistulas were detected with micro-CT imaging in 16 fetuses/neonates (Figure 5). EFIC imaging analysis in six of these animals confirmed five had coronary artery fistulas. EFIC analysis of the other 268 animals revealed another five with coronary artery fistulas missed by micro-CT (Table 2). This included one found among the 114 CHD-negative micro-CT analyzed samples. Together, this yielded a detection sensitivity of 50.0%, specificity of 99.6% and accuracy of 97.8% (Table 2). AVSD was found in 22 samples by micro-CT, and EFIC histopathology on 16 confirmed the diagnosis in 14 specimens. Of the remaining EFIC analyzed samples, only 1 AVSD was identified that was missed by micro-CT. Together this yielded a sensitivity of 87.5%, specificity of 99.6%, and an overall accuracy of 97.8% for AVSD (Table 2). Tricuspid valve hypoplasia/atresia was found in 13 animals and was based primarily on a marked reduction in the size of the right ventricle (Figure 6A, D). EFIC histopathology confirmed the hypoplastic RV and also identified hypoplastic tricuspid valves, thereby affirming the diagnosis of tricuspid hypoplasia/atresia in three neonates and one fetus (Figure 6B, C, E, F) for a 100% accuracy overall.
Figure 5. Coronary artery fistulas.
Micro-CT imaging in the coronal (A) and transverse (D) views revealed a large cavity in the interventricular septum with a fistula into the right ventricle (D). EFIC histology (B,C,E) shows the fistula initiating from the origin of the left and right coronary arteries (B,C).
Scale bars = 1mm (A–E), 2mm (F).
LSVC = left superior vena cava; RSVC = right superior vena cava.
Figure 6. Tricuspid valve hypoplasia/atresia and hypoplastic right ventricle.
Micro-CT (A, D) and corresponding EFIC (B, E) images of two pups (A–C and D–F) with hypoplastic right ventricle with enlarged right atrium shown in the four-chamber view. EFIC imaging confirmed the hypoplastic RV and also showed hypoplastic tricuspid valves (C, F).
Scale bars = 0.5mm.
TrV = tricuspid valve.
Micro-CT Detection of Complex CHD Associated with Heterotaxy
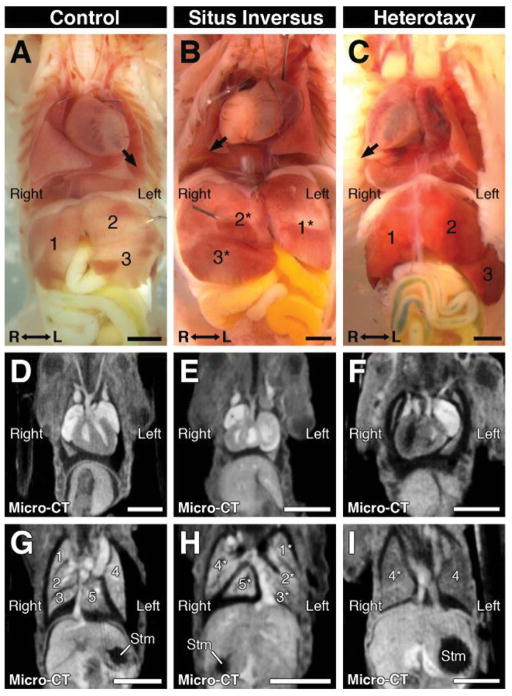
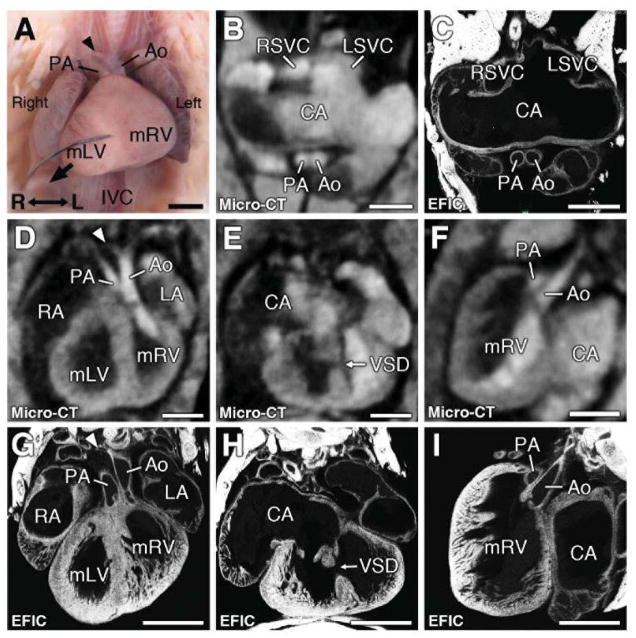
Another cardiac anomaly readily detected by micro-CT was dextrocardia (Table 1). This was found in four newborn pups, all of which were confirmed by necropsy, with no additional dextrocardia found in the remaining 270 samples analyzed by necropsy and EFIC imaging (Figure 7). Dextrocardia was associated with complete mirror symmetric reversal of visceral organ situs (situs inversus totalis) (Figure 7B, E, H) or left-right randomized visceral organ situs (heterotaxy; Figure 7C, F, I). Heterotaxy is of particular interest given complex CHD is often found in patients with heterotaxy. This was also observed in mice. Shown in Figure 8 is a neonate identified with dextrocardia by micro-CT. It exhibited bilateral single lung lobes, indicating left-pulmonary isomerism. Both OFTs emerged from the left-sided morphological right ventricle, indicating DORV (Figure 8D, F). Also observed were hypoplastic RAA (Figure 8A, D), atrial septal defect (ASD) and muscular VSD (Figure 8B, E). All of these structural heart defects were confirmed by EFIC histopathology (Figure 8C, G, H, I). While dual superior vena cavae were observed by micro-CT and necropsy, suggesting right atrial isomerism (Figure 8A, B), EFIC imaging revealed two coronary sinuses, normally a left-sided structure, thus indicating atrial situs ambiguous (data not shown). These findings show the efficacy of micro-CT imaging in detection of complex structural heart defects in fetal/newborn mice.
Figure 7. Micro-CT imaging detection of dextrocardia and other visceral organ situs defects.
Necropsy (A–C) and corresponding micro-CT images (D–I) of newborn mice with normal placement of visceral organs (A, D, G), situs inversus totalis with complete mirror reversal of organ situs (B, E, H), and heterotaxy with left-right randomized organ situs (C, F, I). Situs inversus pup exhibited dextrocardia, left-sided inferior vena cava, inversion of lung and liver lobes, and a right-sided stomach (A,D,G), while heterotaxy pup exhibited dextrocardia, duplicated inferior vena cavae, left pulmonary isomerism, normal liver lobation, and a left-sided stomach (C,F,I). Arrows denote the direction to which the heart apex is pointing; asterisks indicate mirrored organ positioning.
Scale bars = 2.5mm. Stm = stomach.
Figure 8. Complex congenital heart disease associated with heterotaxy.
Micro-CT showed heart with dextrocardia (D, G) with muscular VSD (E,H), hypoplastic right aortic arch (see arrowhead in D), and DORV with the aorta and pulmonary trunk arising from the morphologic right ventricle (D, F). This was confirmed by EFIC imaging (G,H,I). Atrial appendages showed bilateral superior vena cava (RSVC, LSVC in panel B), indicating right atrial isomerism, which EFIC histology showed was a common atrium (C).
Scale bars = 1mm.
Ao = aorta; CA = common atrium; IVC = inferior vena cava; LA = left atrium; LSVC = left superior vena cava; mLV = morphological left ventricle; mRV = morphological right ventricle; PA = pulmonary artery; RA = right atrium; RSVC = right superior vena cava; VSD = ventricular septal defect.
Discussion
Analysis of 2105 fetal/newborn mice by iodine contrast-enhanced micro-CT showed this imaging modality is highly effective in identifying a wide spectrum of CHD. This is despite the intrinsic resolution limit (15–45μm) of micro-CT relative to the small size of the newborn (<3.5 mm) and fetal (<2 mm) mouse hearts. As micro-CT scan times are short (~30 min), the rate-limiting step is the image processing required for reconstruction of the CT imaging data (~4 hours). With the capability to simultaneously image 8–12 fetuses or pups per scan, CHD mutants can be readily identified from an entire litter with just one scan. This is cost effective andf advantageous when examining multiple segregating genotypes in an entire litter of mice, or in high-throughput projects such as with forward genetic screens or large-scale phenotyping of knockout mice for functional gene annotation in KOMP23, 4. We also noted micro-CT imaging can detect non-cardiac defects, such as visceral organ situs anomalies, as well as craniofacial anomalies, brain defects, or other organ malformations (data not shown).
In this post-genomic era with the completion of human and mouse genome sequencing, there is great impetus for sophisticated high-throughput phenotyping methodologies to elucidate the genetic etiology of human diseases. However, the success of phenotype-driven screens is contingent upon having assays that are both high-throughput and with high detection sensitivity and specificity. While necropsy and histopathology are the gold standard for confirming structural heart defect/disease diagnosis13, such analyses are not practical for large-scale screening and must be reserved for pre-selected animals deemed most likely to have defect phenotypes. Our study show micro-CT is well suited for such high-throughput screening for structural heart defect diagnosis. This can be invaluable for routine interrogation for CHD in mutant mouse models and in large-scale screens for the de novo recovery of CHD mouse mutants.
In addition to micro-CT, several other imaging modalities have been adapted from their clinical counterparts for mouse cardiovascular phenotyping, such as high-frequency ultrasound8, 9, 14–17 and micro-MRI imaging18, 19. MRI is advantageous in that it has high soft tissue contrast that obviates the need for contrast enhancement, but MRI equipment is much more costly and image acquisition time is much longer (spanning 3–12 hours). In addition, training for MRI has a steeper learning curve. Another imaging modality to consider is high-frequency ultrasound. Ultrasound imaging, while ideally suited for CHD diagnosis, has the steepest learning curve. Thus unlike CT and MRI, CHD detection with ultrasonography requires clinical knowledge alterations in cardiac anatomy associated with CHD to guide manual manipulation of the ultrasound transducer during image acquisition. In contrast, MRI and CT scans are conducted in a uniform manner with no clinical knowledge required, and the imaging data generated can later be evaluated by experienced clinicians.
Limitations
While micro-CT imaging has high efficiency for identifying various structural cardiovascular defects, there are several limitations. In the present study, we used EFIC histopathology as the gold standard to confirm all CHD diagnoses. EFIC imaging provides image resolution at 0.1μm voxel size which compares favorably to fetal and newborn mouse hearts with 0.5 to 2mm-diameter (ventricular width). This is equivalent to using 40μm voxel image resolution in imaging 40mm-diameter newborn human heart20, which should be sufficient for accurate diagnoses of cardiovascular structural defects. In contrast, the 15–45μm voxel size used for micro-CT imaging in this study is equivalent to only a 1–1.3mm voxel size in imaging the 40mm-diameter human heart.
Of paramount importance for micro-CT diagnosis of CHD is the efficacy of contrast agent staining of soft tissue in the cardiovascular system. With poor contrast staining, not only were CHD diagnoses missed, but imaging artifacts also led to false diagnoses, such as VSDs or coronary artery fistulas. This underlies the difficulty with micro-CT detection of small interventricular septal defects, small vessels, and valvular defects. It also likely accounts for the inability to differentiate between CoA and IAA.
Conclusions
Contrast-enhanced micro-CT imaging of fetal/newborn mice provided greater than 97% accuracy in the diagnosis of OFT defects, aortic arch anomalies, AVSD, tricuspid valve hypoplasia/atresia and coronary artery fistulas. We observed lower accuracy for VSD (89.8%), which largely was due to difficulty in detection of very small VSDs and erroneous VSD diagnoses due to imaging artifacts. OFT anomalies comprising of PTA, DORV or TGA can be readily differentiated by micro-CT imaging. The overall diagnostic sensitivity was greater than 85% for all of the anomalies analyzed, except for coronary artery fistulas which was 50.0%. These findings show micro-CT is a robust imaging technique that can be used for high-throughput CHD phenotyping of fetal/newborn mice.
Supplementary Material
3D reconstruction of an E16.5 fetal heart using micro-CT shows an AVSD, illustrated by a common four-leaflet valve and a large VSD.
The same specimen shown in Video S1 was processed for EFIC imaging, and the resulting 3D EFIC reconstruction also revealed an AVSD, illustrated by a common four-leaflet valve and a large VSD.
Clinical Perspective.
Congenital heart disease (CHD) is one of the most common human birth defects and yet it remains poorly understood. In the post-genomic era, high-throughput systems genetics with large-scale mutagenesis screens in mice is emerging as an attractive experimental strategy to investigate the genetic etiopathology of CHD. Mice are well suited for such studies, as they have the same four chamber cardiovascular anatomy that are the major substrates of CHD. From micro-CT scanning over 2,000 fetal/newborn mice, we showed contrast-enhanced microcomputed tomography can be used for CHD diagnosis. Using necropsy and histopathology examinations as the gold standard to confirm the micro-CT generated CHD diagnoses, we showed micro-CT imaging has high accuracy in the detection of a wide spectrum of CHD. This includes outflow tract defects, aortic arch anomalies, atrioventricular septal defects, tricuspid valve hypoplasia/atresia and coronary artery fistulas. While ventricular septal defects also can be detected, small VSDs may be missed. We found outflow tract anomalies comprising of persistent truncus arteriosus, double outlet right ventricle, and transposition of the great arteries can be readily differentiated by micro-CT imaging. The overall diagnostic sensitivity was greater than 85% for all of the anomalies analyzed, except for coronary artery fistulas. These findings show micro-CT is a robust imaging technique that can be used for rapid assessments of structural heart defects in fetal and newborn mice. This can be invaluable for routine interrogation for CHD in mutant mouse models and in high-throughput screens for the de novo recovery of CHD mouse mutants.
Acknowledgments
We would like to thank Maliha Zahid for her statistical guidance in this study.
Sources of Funding
This study was supported by NIH grant HL098180.
Footnotes
Disclosures
None.
References
- 1.Hoffman JI, Kaplan S. The incidence of congenital heart disease. J Am Coll Cardiol. 2002;39:1890–1900. doi: 10.1016/s0735-1097(02)01886-7. [DOI] [PubMed] [Google Scholar]
- 2.Conway SJ, Kruzynska-Frejtag A, Kneer PL, Machnicki M, Koushik SV. What cardiovascular defect does my prenatal mouse mutant have, and why? Genesis. 2003;35:1–21. doi: 10.1002/gene.10152. [DOI] [PubMed] [Google Scholar]
- 3.Austin CP, Battey JF, Bradley A, Bucan M, Capecchi M, Collins FS, Dove WF, Duyk G, Dymecki S, Eppig JT, Grieder FB, Heintz N, Hicks G, Insel TR, Joyner A, Koller BH, Lloyd KC, Magnuson T, Moore MW, Nagy A, Pollock JD, Roses AD, Sands AT, Seed B, Skarnes WC, Snoddy J, Soriano P, Stewart DJ, Stewart F, Stillman B, Varmus H, Varticovski L, Verma IM, Vogt TF, von Melchner H, Witkowski J, Woychik RP, Wurst W, Yancopoulos GD, Young SG, Zambrowicz B. The knockout mouse project. Nat Genet. 2004;36:921–924. doi: 10.1038/ng0904-921. [DOI] [PMC free article] [PubMed] [Google Scholar]
- 4.Collins FS, Rossant J, Wurst W. A mouse for all reasons. Cell. 2007;128:9–13. doi: 10.1016/j.cell.2006.12.018. [DOI] [PubMed] [Google Scholar]
- 5.Degenhardt K, Wright AC, Horng D, Padmanabhan A, Epstein JA. Rapid 3d phenotyping of cardiovascular development in mouse embryos by micro-ct with iodine staining. Circ Cardiovasc Imaging. 2010;3:314–322. doi: 10.1161/CIRCIMAGING.109.918482. [DOI] [PMC free article] [PubMed] [Google Scholar]
- 6.Schambach SJ, Bag S, Schilling L, Groden C, Brockmann MA. Application of micro-ct in small animal imaging. Methods. 2010;50:2–13. doi: 10.1016/j.ymeth.2009.08.007. [DOI] [PubMed] [Google Scholar]
- 7.Metscher BD. Microct for comparative morphology: Simple staining methods allow high-contrast 3d imaging of diverse non-mineralized animal tissues. BMC Physiol. 2009;9:11. doi: 10.1186/1472-6793-9-11. [DOI] [PMC free article] [PubMed] [Google Scholar]
- 8.Yu Q, Shen Y, Chatterjee B, Siegfried BH, Leatherbury L, Rosenthal J, Lucas JF, Wessels A, Spurney CF, Wu YJ, Kirby ML, Svenson K, Lo CW. Enu induced mutations causing congenital cardiovascular anomalies. Development. 2004;131:6211–6223. doi: 10.1242/dev.01543. [DOI] [PubMed] [Google Scholar]
- 9.Shen Y, Leatherbury L, Rosenthal J, Yu Q, Pappas MA, Wessels A, Lucas J, Siegfried B, Chatterjee B, Svenson K, Lo CW. Cardiovascular phenotyping of fetal mice by noninvasive high-frequency ultrasound facilitates recovery of enu-induced mutations causing congenital cardiac and extracardiac defects. Physiol Genomics. 2005;24:23–36. doi: 10.1152/physiolgenomics.00129.2005. [DOI] [PubMed] [Google Scholar]
- 10.Weninger WJ, Mohun T. Phenotyping transgenic embryos: A rapid 3-d screening method based on episcopic fluorescence image capturing. Nat Genet. 2002;30:59–65. doi: 10.1038/ng785. [DOI] [PubMed] [Google Scholar]
- 11.Rosenthal J, Mangal V, Walker D, Bennett M, Mohun TJ, Lo CW. Rapid high resolution three dimensional reconstruction of embryos with episcopic fluorescence image capture. Birth Defects Res C Embryo Today. 2004;72:213–223. doi: 10.1002/bdrc.20023. [DOI] [PubMed] [Google Scholar]
- 12.Landis JR, Koch GG. The measurement of observer agreement for categorical data. Biometrics. 1977;33:159–174. [PubMed] [Google Scholar]
- 13.Savolainen SM, Foley JF, Elmore SA. Histology atlas of the developing mouse heart with emphasis on e11.5 to e18.5. Toxicol Pathol. 2009;37:395–414. doi: 10.1177/0192623309335060. [DOI] [PMC free article] [PubMed] [Google Scholar]
- 14.Leatherbury L, Yu Q, Lo CW. Noninvasive phenotypic analysis of cardiovascular structure and function in fetal mice using ultrasound. Birth Defects Res C Embryo Today. 2003;69:83–91. doi: 10.1002/bdrc.10005. [DOI] [PubMed] [Google Scholar]
- 15.Corrigan N, Brazil DP, Auliffe FM. High-frequency ultrasound assessment of the murine heart from embryo through to juvenile. Reprod Sci. 2010;17:147–157. doi: 10.1177/1933719109348923. [DOI] [PubMed] [Google Scholar]
- 16.Phoon CK, Ji RP, Aristizabal O, Worrad DM, Zhou B, Baldwin HS, Turnbull DH. Embryonic heart failure in nfatc1−/− mice: Novel mechanistic insights from in utero ultrasound biomicroscopy. Circ Res. 2004;95:92–99. doi: 10.1161/01.RES.0000133681.99617.28. [DOI] [PubMed] [Google Scholar]
- 17.Phoon CK. Imaging tools for the developmental biologist: Ultrasound biomicroscopy of mouse embryonic development. Pediatr Res. 2006;60:14–21. doi: 10.1203/01.pdr.0000219441.28206.79. [DOI] [PubMed] [Google Scholar]
- 18.Schneider JE, Bose J, Bamforth SD, Gruber AD, Broadbent C, Clarke K, Neubauer S, Lengeling A, Bhattacharya S. Identification of cardiac malformations in mice lacking ptdsr using a novel high-throughput magnetic resonance imaging technique. BMC Dev Biol. 2004;4:16. doi: 10.1186/1471-213X-4-16. [DOI] [PMC free article] [PubMed] [Google Scholar]
- 19.Schneider JE, Bhattacharya S. Making the mouse embryo transparent: Identifying developmental malformations using magnetic resonance imaging. Birth Defects Res C Embryo Today. 2004;72:241–249. doi: 10.1002/bdrc.20017. [DOI] [PubMed] [Google Scholar]
- 20.Burnard ED. Changes in heart size in the dyspnoeic newborn baby. Br Med J. 1959;1:1495–1500. doi: 10.1136/bmj.1.5136.1495. [DOI] [PMC free article] [PubMed] [Google Scholar]
Associated Data
This section collects any data citations, data availability statements, or supplementary materials included in this article.
Supplementary Materials
3D reconstruction of an E16.5 fetal heart using micro-CT shows an AVSD, illustrated by a common four-leaflet valve and a large VSD.
The same specimen shown in Video S1 was processed for EFIC imaging, and the resulting 3D EFIC reconstruction also revealed an AVSD, illustrated by a common four-leaflet valve and a large VSD.


