

Abstract
Purpose: Studies have shown that functional analysis of knee cartilage based on magnetic resonance (MR) relaxation times is a valuable tool in the understanding of osteoarthritis (OA). In this work, the regional spatial distribution of knee cartilage and relaxation times based on texture and laminar analyses was studied to investigate if they provide additional insight compared to global mean values in the study of OA.
Methods: Knee cartilage of 36 subjects, 19 healthy controls and 17 with mild OA, was divided into 16 compartments. and relaxation times were studied with first order statistics, eight texture parameters with four different orientations using gray-level co-occurrence matrices and by subdividing each compartment into two different layers: Deep and superficial. Receiver operating characteristic curve analysis was performed to evaluate the potential of each technique to correctly classify the populations.
Results: Although the deep and superficial cartilage layers had in general significantly different and relaxation times, they performed similarly in terms of subject discrimination. The subdivision of lateral and medial femoral compartments into weight-bearing and non-weight-bearing regions did not improve discrimination. Also it was found that the most sensitive region was the patella and that discriminated better than . The most important finding was that with respect to global mean values, laminar and texture analyses improved subject discrimination.
Conclusions: Results of this study suggest that spatially assessing MR images of the knee cartilage relaxation times using laminar and texture analyses could lead to better and probably earlier identification of cartilage matrix abnormalities in subjects with OA.
Keywords: osteoarthritis (OA), T1ρ, T2, laminar, texture, magnetic resonance imaging (MRI)
INTRODUCTION
In vivo studies of osteoarthritis (OA) of the knee with magnetic resonance imaging (MRI) have gained recognition because this imaging modality facilitates the study of cartilage using morphological and biochemical approaches.1 Morphologic studies measuring the cartilage thickness and volume have shown that knee OA is usually accompanied by cartilage thinning and loss.2 However, it has also been suggested that prior to these morphologic events, the cartilage biochemical composition experiences changes which can be captured by MRI relaxation time measurements.3 and more recently (Refs. 4, 5) have emerged as potential noninvasive cartilage degradation biomarkers in studies of OA.6, 7, 8, 9, 10, 11 Studies have shown that cartilage and relaxation times are usually longer in subjects with mild OA than in healthy controls.7, 10, 12 Possible explanations for these phenomena are that early osteoarthritic changes decrease collagen content and structure increasing the mobility of water, thus yielding an increase in relaxation times and that changes in concentration, structure, and mobility of macromolecules due to damage to the collagen-proteoglycan cartilage matrix also increases the mobility of water in early OA and results in an increase in relaxation times.
Common approaches to quantify relaxation time measurements in knee OA are based on mean values of different cartilage compartments7, 12 or Z-score maps.6 However, Dray et al.13 found no difference between mean values in cartilage with OA, but they demonstrated visual differences in the spatial distribution of the relaxation time maps. Furthermore, studies have also demonstrated that a laminar organization of relaxation times exists in knee7, 14, 15, 16 and hip cartilage,17, 18, 19 with shorter and values close to the subchondral bone (deep layer) and longer values close to the articular surface (superficial layer). These findings highlight the importance that in addition to first order statistics, techniques that take into account the spatial distribution of relaxation time values are needed to quantify the degree of cartilage degeneration. Texture analysis based on gray-level co-occurrence matrices (GLCMs) is certainly a technique of this kind, and Blumenkrantz et al.20 showed its application in an OA study where the GLCM entropy of cartilage MR maps was significantly different between healthy controls and OA patients.
The purpose of this study is to investigate whether the regional spatial distribution of knee cartilage and values, based on laminar and texture analyses, provides additional insight compared to mean and values in the study of OA. The rationale behind this study is that the loading patterns in the knee articulation are region specific leading to nonuniform cartilage degeneration,21 that and maps show a laminar distribution that probably gets disrupted with OA,14 and that the spatial organization of cartilage and is also affected with OA and can be detected with texture analysis.20, 22 In comparison to other works, this study is the first to simultaneously analyze laminar and texture analyses of and values.
MATERIALS AND METHODS
Subjects and clinical assessment
Thirty-six subjects, 19 healthy controls (mean age ; 9 male, 10 female) and 17 patients with mild OA (mean age ; 8 male, 9 female), were included in this work. All subjects had good health by medical history, physical examination, clinical laboratories, and no contraindications for the use of MRI at the time of enrollment. Clinical symptoms of knee OA based on the ACR criteria23 and mild radiographic signs of OA based on the Kellgren-Lawrence (KL) score24 were additional inclusion criteria for patients. Subjects were classified as having mild OA if their KL scores were 1 or 2. Patients with inflammatory arthritis were excluded and also those with knee OA secondary to other causes (acute or chronic infection, metabolic abnormalities, previous surgery or history of intra-articular fracture). Controls had no clinical evidence of knee OA.
Written informed consent was obtained from all subjects after the nature of the study was fully explained. All studies were performed in accordance with the regulations of the Committee of Human Research at our institution.
Magnetic resonance imaging
Sagittal magnetic resonance images of the affected knee joint in OA patients and of the dominant knee joint in the controls were acquired at 3.0 T (Signa, GE Medical Systems, Waukesha, WI) using a dedicated knee coil (Clinical MR Solutions, Brookfield, WI). A high-spatial resolution scan for cartilage depiction, and - and -mapping sequences for compositional analysis were included in the scanning protocol. The high-spatial resolution scan consisted of a 3D fat-suppressed -weighted sequence using a spoiled gradient-echo (SPGR) with repetition time (TR) of 20 ms, echo time (TE) of 7.5 ms, flip angle of 12°, field of view (FOV) of 16 cm, and matrix size of for an in-plane spatial resolution of and slice thickness of 1 mm, with an acquisition time of 7 min and 37 s. -weighted images were obtained using a previously developed 3D segmented elliptic-centric SPGR sequence5 that acquires data during transient signal evolution . The magnetization preparation consisted of four spin-lock times (TSL) (0, 10, 40, and 80 ms) and 500 Hz spin-lock frequency. Additional scan parameters were 110 ms inversion time, 12° flip angle, 31.25 kHz readout bandwidth, 12 cm FOV, and acquisition matrix for a final in-plane resolution of and 3 mm slice thickness in 12 min and 42 s. Images to compute maps were acquired using a previously developed 3D segmented elliptic-centric SPGR sequence25 that acquires data during transient signal evolution , four echo times (6.7, 17.4, 28, and 49.3 ms), and the same spatial resolution as for the scans for an acquisition time of 10 min and 36 s.
Image processing
All images were transferred to a Sun Workstation (Sun Microsystems, Mountain View, CA), which was used to perform image analysis. maps were generated performing monoexponential fittings on a pixel-by-pixel basis using a Levenberg-Marquardt algorithm developed in-house. The equation to be fitted was of the following form:
| (1) |
where TSL is the time of spin lock, S is the signal intensity in a -weighted image with a certain TSL, and is the signal intensity when .
maps were generated in a similar manner based on
| (2) |
where TE is the echo time, S is the signal intensity in a -weighted image with a certain TE, and is the signal intensity when .
Due to knee motion between the scans, automatic rigid body registration was applied to align the and maps to the high-spatial resolution SPGR images using the first TSL and TE images to compute the transformations, respectively (VTK CISG REGISTRATION TOOLKIT). Figure 1 shows the first TSL image of a -mapping acquisition before and after image registration to the high-spatial resolution scan, where the same medial femoral region of interest (ROI) has been overlaid on both images demonstrating the improvement in ROI alignment after image registration.
Figure 1.
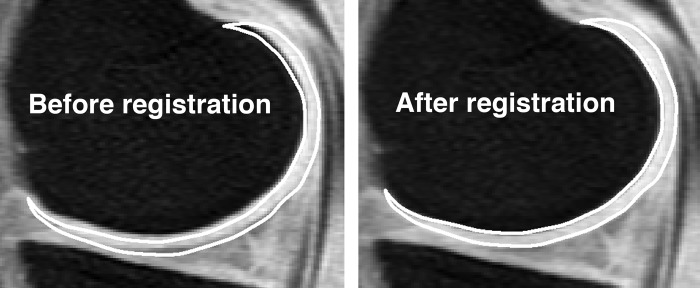
First TSL image of a -mapping acquisition before and after image registration to the high-spatial resolution SPGR scan with fat suppression. The same ROI representing the medial femoral compartment has been overlaid on both images demonstrating the improvement in ROI alignment after image registration.
Cartilage was segmented on a slice-by-slice basis by the same user from the 3D high-spatial resolution SPGR images with a semiautomatic technique based on Bezier splines and edge detection using MATLAB (Mathworks, Natick, MA) as described by Carballido-Gamio et al.26 Segmentation was defined in six distinct regions: patella, trochlea, medial and lateralfemur, and medial and lateral tibia. The medial and lateral femoral compartments were further divided into weight-bearing and non-weight-bearing regions as described by Stahl et al.12
Subsequently, the above-mentioned regions were merged to create larger units: Patella and trochlea were combined to create the patello-femoral compartment, trochlea and medial and lateral femur were called femur, lateral and medial tibial plateaus yielded the tibia compartment, medial femur and medial tibial plateau together represented the medial compartment, while the lateral compartment resulted from merging the lateral femur and lateral tibial plateau. The six initial compartments together were referred to as all. These merging and partition processes resulted in a total of 16 cartilage compartments. The basic units of these compartments and their combinations are represented in Fig. 2.
Figure 2.
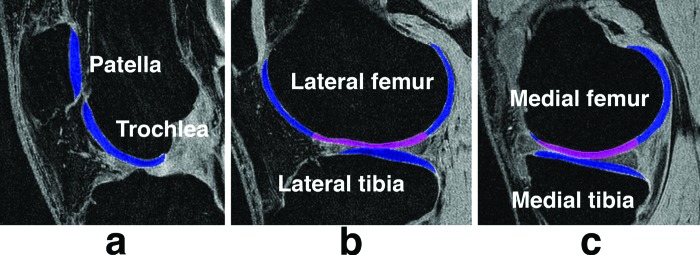
Sixteen cartilage compartments were analyzed in this study. (a) Patello-femoral compartment resulting from the merging of two compartments: Trochlea and patella. (b) Lateral compartment composed of the lateral femur and lateral tibia compartment. (c) Medial compartment composed of the medial femur and medial tibia compartment. Magenta and blue regions in the lateral and medial femur compartments represent the weight-bearing and non-weight-bearing femoral compartments, respectively. Regions of interest are overlaid on high-spatial resolution SPGR scans with fat suppression.
The original splines representing the bone-cartilage interface and articular surface were transferred from the high-spatial resolution SPGR images to the registered and maps to define the regions of interest for and assessment. and cartilage laminar analysis was performed on a slice-by-slice basis by using an in-house developed software implemented in MATLAB (Mathworks, Natick, MA). Cartilage was automatically divided into two layers: Deep (closest to the bone-cartilage interface) and superficial (closest to the articular surface). Cartilage pixels were classified to only one layer based on minimum Euclidean distances to the transferred splines. Cartilage was partitioned into two layers and not three27 to minimize imminent partial volume effects between layers. Figure 3 shows an example of the laminar partition in the medial femoral compartment, as described above.
Figure 3.

Laminar analysis in this work was performed by dividing the cartilage into two layers. This figure shows a medial femoral compartment mask representing in magenta and blue the deep and superficial layers, respectively.
Texture analysis of relaxation time maps was performed using GLCM.28 GLCM extracts information related to the spatial distribution of pixel intensities by analyzing their co-occurrences at a certain orientation and offset. The easy yet powerful process consists in creating matrices of pixel-intensity co-occurrences, converting the matrices into probabilities, and computing parameters by combining the probabilities with different weight factors. One pixel offset, four directions (0°–180°, 45°–225°, 90°–270°, 135°–315°), and eight features were evaluated. The horizontal and vertical directions were in close correspondence to the anterior-posterior and superior-inferior anatomic directions, respectively. GLCM texture features included eight parameters,28 two from the contrast group (contrast and homogeneity), three from the orderliness group [angular second-moment (ASM), energy, and entropy], and three from the stats group (mean, variance, and correlation).
Statistical analysis
All statistical analysis was performed using JMP 7.0 (SAS Institute, Cary, NC). To evaluate if the deep and superficial layers were significantly different from each other, a paired-t test was performed to each compartment. The ability of global mean values, mean values of different cartilage layers, and texture parameters to discriminate between healthy controls and subjects with OA was assessed in each compartment using the area under the curve (AUC) of the receiver operating characteristic (ROC) curve analysis,29 which is a visual as well as numerical method used for assessing the performance of classification algorithms. The significance of the discriminations was evaluated with a two-tailed t test. All statistical analysis was considered significant at .
RESULTS
Global and laminar analyses
Table 1 summarizes the results of the global and laminar mean values for both and . Values providing , signifying good accuracy for the ROC analysis, are in boldface in the table. Higher AUCs and smaller p values were observed in the patella for global mean , and higher AUCs and smaller p values were observed in the medial femoral compartment for global mean . Mean values of the superficial layer were significantly higher than those of the deep layer in both healthy controls and subjects with OA, with the exception of the medial femoral non-weight-bearing compartment of healthy controls. Mean values of the superficial layer were also significantly higher than those of the deep layer in both healthy controls and subjects with OA. When mean values, either global or laminar, were significantly different between healthy controls and subjects with OA, values were higher for subjects with mild OA. When mean values, either global or laminar, were significantly different between healthy controls and subjects with OA, values were higher for subjects with OA, except for the deep layers of the tibia and lateral tibia compartments. The dynamic ranges for healthy controls were 7.46 ms at the deep layer and 3.62 ms at the superficial layer. The dynamic ranges for OA patients were 9.32 ms at the deep layer and 4.83 ms at the superficial layer. The dynamic ranges for healthy controls were 6.05 ms at the deep layer and 3.23 ms at the superficial layer. The dynamic ranges for OA patients were 11.02 ms at the deep layer and 7.11 ms at the superficial layer. The dynamic range for significantly different values between subjects with OA and healthy controls was on average , while for values the average difference was .
Table 1.
AUCs of the ROC analysis of mean and values to discriminate between subjects with and without knee OA (boldface indicates ).
| Compartment | Deep and superficial layers | Deep layer | Superficial layer | |||
|---|---|---|---|---|---|---|
| Patella | 0.841 | 0.67 | 0.742 | 0.54 | 0.891 | 0.77 |
| Trochlea | 0.752 | 0.63 | 0.66 | 0.59 | 0.802 | 0.67 |
| Patello femoral | 0.801 | 0.63 | 0.692 | 0.54 | 0.851 | 0.712 |
| Femur | 0.751 | 0.691 | 0.701 | 0.672 | 0.761 | 0.691 |
| Lateral femoral | 0.742 | 0.64 | 0.732 | 0.63 | 0.752 | 0.66 |
| Lateral femoral non-weight-bearing | 0.762 | 0.63 | 0.742 | 0.63 | 0.742 | 0.67 |
| Lateral femoral weight-bearing | 0.66 | 0.60 | 0.64 | 0.61 | 0.67 | 0.60 |
| Medial femoral | 0.712 | 0.811 | 0.66 | 0.821 | 0.742 | 0.752 |
| Medial femoral non-weight-bearing | 0.722 | 0.791 | 0.63 | 0.712 | 0.762 | 0.811 |
| Medial femoral weight bearing | 0.59 | 0.692 | 0.63 | 0.752 | 0.60 | 0.58 |
| Tibia | 0.54 | 0.57 | 0.682 | 0.52 | 0.59 | 0.63 |
| Lateral tibia | 0.56 | 0.56 | 0.712 | 0.57 | 0.63 | 0.64 |
| Medial tibia | 0.53 | 0.58 | 0.63 | 0.54 | 0.56 | 0.61 |
| Lateral | 0.57 | 0.56 | 0.52 | 0.51 | 0.692 | 0.65 |
| Medial | 0.57 | 0.622 | 0.51 | 0.60 | 0.64 | 0.662 |
| All | 0.651 | 0.612 | 0.56 | 0.55 | 0.721 | 0.671 |
Significant subject discrimination based on ROC analysis.
Significant subject discrimination based on ROC analysis.
In terms of regional laminar analysis, discriminated better between healthy controls and patients with OA at the patella, trochlea, and patello-femoral compartments, while discriminated better between the two populations at the medial femoral and medial femoral non-weight-bearing compartments. Table 1 shows that laminar analysis was able to discriminate between the populations in the tibia, lateral tibia, and lateral compartments, where global mean values could not discriminate between the populations. Global means and laminar analysis could not discriminate between the populations in the lateral femoral weight-bearing and the medial tibia compartments.
Texture analysis
Tables 2, 3, 4 summarize the GLCM texture analysis results, showing that performed best with contrast and stats measures in differentiating OA subjects and controls, while performed well with the three texture feature categories. In these tables, values providing are also indicated, representing good accuracy for the ROC analysis. A similar trend was observed for and when comparisons of texture features were significantly different between healthy controls and subjects with OA: Healthy controls showed lower contrast, higher homogeneity, higher ASM, higher energy, lower entropy, lower mean, lower variance, and lower correlation at all compartments and orientations than OA patients. discriminated best at the patella, trochlea, patello-femoral, medial femoral, medial femoral non-weight-bearing, and lateral tibia compartments, while discriminated best at the patella, medial femoral, medial femoral non-weight-bearing, femur, tibia, and all compartments.
Table 2.
Discrimination between subjects with and without knee OA based on AUC of the ROC analysis of contrast textural features of GLCM of and . significant subject discrimination based on ROC analysis. subject discrimination based on ROC analysis. subject discrimination based on ROC analysis. subject discrimination based on ROC analysis and . , , , and .
| Compartment | Contrast | Homogeneity | ||
|---|---|---|---|---|
| 1234 | 1234 | 1234 | 1234 | |
| Patella | ||||
| Trochlea | – | |||
| Patello femoral | ||||
| Femur | ||||
| Lateral femoral | – | – | – | – |
| Lateral femoral non-weight-bearing | – | – | – | – |
| Lateral femoral weight-bearing | – | – | – | – |
| Medial femoral | – | – | ||
| Medial femoral non-weight-bearing | – | – | ||
| Medial femoral weight bearing | ||||
| Tibia | ||||
| Lateral tibia | ||||
| Medial tibia | – | – | – | – |
| Lateral | – | – | ||
| Medial | – | – | – | |
| All | ||||
Table 3.
Discrimination between subjects with and without knee OA based on AUC of the ROC analysis of orderliness textural features of GLCM of and . significant subject discrimination based on ROC analysis. subject discrimination based on ROC analysis. subject discrimination based on ROC analysis. subject discrimination based on ROC analysis and . , , , and .
| Compartment | ASM | Energy | Entropy | |||
|---|---|---|---|---|---|---|
| 1234 | 1234 | 1234 | 1234 | 1234 | 1234 | |
| Patella | – | – | – | – | – | – |
| Trochlea | – | – | – | – | – | – |
| Patello femoral | – | – | – | – | – | – |
| Femur | ||||||
| Lateral femoral | – | – | – | – | – | – |
| Lateral femoral non-weight-bearing | – | – | – | – | – | – |
| Lateral femoral weight-bearing | – | – | – | – | – | – |
| Medial femoral | – | – | – | |||
| Medial femoral non-weight-bearing | – | – | – | |||
| Medial femoral weight bearing | – | – | – | – | – | – |
| Tibia | – | – | – | – | – | – |
| Lateral tibia | – | – | – | – | – | – |
| Medial tibia | – | – | – | – | – | – |
| Lateral | – | – | – | – | – | – |
| Medial | – | – | – | – | – | – |
| All | – | – | – | – | ||
Table 4.
Discrimination between subjects with and without knee OA based on AUC of the ROC analysis of stats textural features of GLCM of and . significant subject discrimination based on ROC analysis. subject discrimination based on ROC analysis. subject discrimination based on ROC analysis. subject discrimination based on ROC analysis and . , , , and .
| Compartment | Mean | Variance | Correlation | |||
|---|---|---|---|---|---|---|
| 1234 | 1234 | 1234 | 1234 | 1234 | 1234 | |
| Patella | – | |||||
| Trochlea | – | – | – | |||
| Patello femoral | – | – | ||||
| Femur | – | – | ||||
| Lateral femoral | – | – | – | |||
| Lateral femoral non-weight-bearing | – | – | – | – | ||
| Lateral femoral weight-bearing | – | – | – | – | – | |
| Medial femoral | – | – | – | |||
| Medial femoral non-weight-bearing | – | – | – | |||
| Medial femoral weight bearing | – | – | – | – | ||
| Tibia | – | – | – | |||
| Lateral tibia | – | – | – | |||
| Medial tibia | – | – | – | – | ||
| Lateral | – | – | – | |||
| Medial | – | – | – | |||
| All | – | – | ||||
In terms of contrast measures, and provided the best discriminations in the patella with homogeneity. In fact, provided the best texture discrimination with this feature at this compartment reaching an with . In terms of orderliness features, provided better discriminations in the medial femoral compartment, while only provided significant discriminations in the femur. With respect to GLCM-stats measures, provided its best discriminations in the patella, medial femoral, medial femoral non-weight-bearing, trochlea, patello-femoral, and lateral tibia, while provided its best discriminations in the medial femoral, medial femoral non-weight-bearing, femur, tibia, and all compartments.
DISCUSSION
In this study we have quantified and relaxation time maps of knee cartilage of healthy controls and subjects with mild OA. The quantification was performed in 16 compartments using global mean values, laminar, and texture analyses. For laminar analysis, cartilage was partitioned in two layers to reduce partial volume effects between layers. For texture analysis, eight different texture features were investigated including measures of contrast, orderliness, and stats at four different orientations and one offset. Based on AUC of the ROC analysis, results indicate that laminar and texture analyses improve classification of healthy controls and patients with OA compared to global mean values.
In terms of laminar analysis compared to global mean values, when global mean or values significantly discriminated between healthy controls and subjects with mild OA, laminar analysis improved this discrimination yielding better p values and in some instances larger AUCs. Although better subject discrimination was expected for the superficial than for the deep layers, based on the assumption of earlier degeneration on the articular surface, this could not be observed for both and ; however, layers were found to be significantly different from each other. In general, yielded better discrimination than with both global means and laminar analysis.
The observed tendencies for longer cartilage relaxation times in subjects with mild OA than in healthy controls and for longer values in the superficial cartilage layers compared to the deep layers agree with published results. Dunn et al. in a study of femoral and tibial cartilage demonstrated longer relaxation times in patients with OA compared with healthy subjects,6 while Mosher et al. showed a continuous increase in from the radial zone to the articular surface in the patellar cartilage.14 In an ex vivo study of Regatte et al., elevated and values of OA cartilage specimens were found compared to healthy cartilage tissue.7 In the same work, a decrease in and relaxation times was found from the articular surface towards the subchondral bone. A 7.0 T study by Welsch et al. also demonstrated the laminar architecture,30 and Carballido-Gamio et al. found similar and laminar organization in hip cartilage in vivo.19 Furthermore, the larger dynamic range observed for compared to between subjects with OA and healthy controls also agrees with the literature.7
In contrast to global means and laminar analysis, results indicate that all compartments yielded significant subject discrimination of OA patients and controls by at least one texture feature. In terms of contrast measures, coherent with the laminar analysis results that showed some laminar disruption and assuming that the main orientation of the long axis of the patellar cartilage in the sagittal scans is superior-inferior, directions related to the laminar organization in this compartment, 0°–180° (anterior-posterior), 45°–225° (posterior/superior-anterior/inferior), and 135°–315° (posterior/inferior-anterior/superior), yielded significant subject discriminations with and , also suggesting a possible damage to the laminar integrity. A similar behavior in terms of directionality was observed with the trochlea (main orientation /inferior-anterior/superior) and the tibia (main orientation -posterior), where 135°–315° and 0°–180° orientations did not yield significant discriminations, respectively. The compartment corresponding to the femur showed no particular tendency in terms of orientations, which is most probably due to its shape resembling that of a semicircle. In general, discriminated better between the populations than with contrast features.
Results for texture features of the orderliness category showed no particular preference in terms of orientation because the only significant results were related to the femur. In general, also discriminated better between the populations than with orderliness features.
Texture features of the stats category seemed to discriminate better between the populations than those of the contrast and orderliness categories. However, once again, a better discrimination was observed. In fact, GLCM variance of was the only feature able to discriminate between healthy controls and subjects with OA in the lateral femur weight-bearing compartment.
Trends observed in texture analysis using GLCM were also as expected. Contrast was higher and homogeneity was lower in knee cartilage of mild OA subjects than in healthy controls, signifying that more pixels with different relaxation times were neighboring in osteoarthritic cartilage. Angular second moment and energy were higher in healthy controls than in subjects with mild OA meaning that the probabilities of pixel co-occurrences were concentrated on certain values in healthy subjects, i.e., certain pairs of relaxation time co-occurrences were dominant. Entropy was higher in subjects with mild OA, which means a more uniform distribution of probabilities of relaxation time co-occurrences, i.e., it is more likely to find any combination of relaxation time co-occurrence. These two findings are well in agreement with the feasibility study of Blumenkrantz et al.20 where higher entropy and lower ASM were found in osteoarthritic cartilage. In terms of the stats group of texture features, osteoarthritic cartilage showed a higher mean indicating the existence of more pixel co-occurrences involving high relaxation times. The variance was lower for healthy subjects showing lower dispersion of co-occurrences of relaxation times, and the correlation was also lower indicating less linear dependency between neighboring relaxation times.
Part of this study also consisted of the investigation of the effects of merging or partitioning basic compartments such as patella, femur, and tibia into larger or smaller units. With respect to the merging of the patella and trochlea as the patello-femoral compartment, this seems to bring positive effects in the global and laminar analyses for both and ; however, the small benefits seen in the texture results, where the patella provided better discriminations alone, seem not to outweigh the negative ones. A common subdivision of the femoral compartment consists of the medial and lateral regions. No benefits were found for for this subdivision, while improved its global and deep layer discrimination in the medial femoral compartment with a small decline in the performance of the superficial layer. An opposite effect was seen for texture analysis, with improving its discrimination at the medial femoral compartment while worse results were found for . The lateral femoral compartment provided in general no significant discriminations. Opposite to what was expected, the further subdivision of the medial and lateral femoral compartments into weight-bearing and non-weight-bearing regions had no major impact in the discrimination with global means, laminar, or texture analysis for and . The partition of the tibia compartment into lateral and medial regions had no effect in the global and laminar analyses of and , but it had a positive impact in the GLCM variance of yielding better discriminations in the lateral tibia compartment. Merging the medial and lateral femoral and tibia compartments into medial and lateral compartments, respectively, had no positive impact for and discriminations. Merging all the compartments into a single one yielded significant discriminations for both and in most of the compartments; however, areas under the curve never reached values greater than 0.8 as with the individual compartments.
Based on the previous analysis and discussion, in this study seems to be more sensitive to cartilage changes than no matter which technique is used for their quantification: global means, laminar, or texture analysis. Texture analysis provided generally better discriminations than global means and laminar analysis capturing spatial information that even visually is difficult to observe as shown in Figs. 45.
Figure 4.
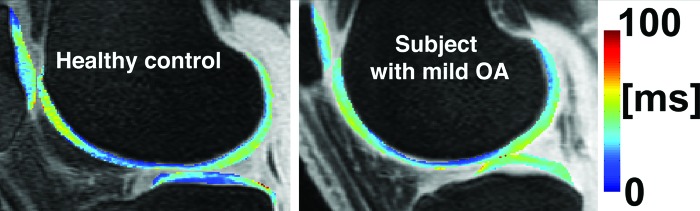
maps of knee cartilage of a healthy control and a subject with mild OA.
Figure 5.
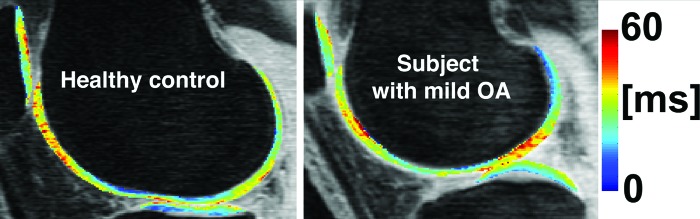
maps of knee cartilage of a healthy control and a subject with mild OA.
While the patella provided good global and laminar discrimination for and the medial femur for , the patella alone provided excellent discriminations with and GLCM homogeneities. The subdivision of the medial and lateral femoral compartments into weight and non-weight-bearing regions, as presented in this manuscript, might be unnecessary. Together, these findings may suggest that osteoarthritic cartilage in the patella experiences changes in its integrity to a greater extent than other compartments or that the patella experiences less partial volume effects resulting in better laminar and texture analyses. There is an increasing interest in performing a more localized comparison of cartilage properties; however, it seems that the question of which region to be examined in terms of relaxation times remains as a topic of research.
The main limitation of this study is that the control and OA patient groups were not age matched, and this was due to the difficulty of recruiting age-matched controls. However, no significant correlations were observed between age and both and relaxation times within the groups demonstrating no age effects on this study. A second limitation of this study was the low number of TEs in the -mapping sequence and TSLs in the -mapping sequence. While implementing additional TEs and TSLs may have resulted in more accurate fits, the number of TEs and TSLs chosen in this study was limited by the total allotted scan time. The total scan time in this study comprised of the and sequences, the high-spatial resolution SPGR sequence, as well as other clinical sequences. Thus, increasing the number of TEs and TSLs would have prolonged scan time and possibly compromised subject comfort in the scanner.
In conclusion, research of the potential of relaxation times in the quantification of cartilage degradation in knee OA has recently demonstrated the importance of and . This study is the first to simultaneously analyze and in healthy controls and subjects with knee OA using global, laminar, and texture analyses. Results suggest that spatially analyzing maps of magnetic resonance relaxation times of the knee cartilage could lead to better and probably earlier identification of cartilage abnormalities in subjects with OA. Future studies are underway to investigate the combination of features presented in this study.
ACKNOWLEDGMENT
This work was supported by Glaxo Smith Kline (GSK) Inc., Research and Development, London, UK.
References
- Potter H. G., Black B. R., and Chong le R., “New techniques in articular cartilage imaging,” Clin. Sports Med. 28, 77–94 (2009). 10.1016/j.csm.2008.08.004 [DOI] [PubMed] [Google Scholar]
- Eckstein F., Burstein D., and Link T. M., “Quantitative MRI of cartilage and bone: Degenerative changes in osteoarthritis,” NMR Biomed. 19, 822–854 (2006). 10.1002/nbm.1063 [DOI] [PubMed] [Google Scholar]
- Li X., Han E. T., Busse R. F., and Majumdar S., “In vivo T(1rho) mapping in cartilage using 3D magnetization-prepared angle-modulated partitioned k-space spoiled gradient echo snapshots (3D MAPSS),” Magn. Reson. Med. 59, 298–307 (2008). 10.1002/mrm.21414 [DOI] [PMC free article] [PubMed] [Google Scholar]
- Regatte R. R., Akella S. V., Borthakur A., Kneeland J. B., and Reddy R., “In vivo proton MR three-dimensional T1rho mapping of human articular cartilage: Initial experience,” Radiology 229, 269–274 (2003). 10.1148/radiol.2291021041 [DOI] [PubMed] [Google Scholar]
- Han E. T., Busse R. F., Li X., Crane J., Wright G. A., Majumdar S., and Brittain J. H., presented at the Proceedings of the 13th Annual Meeting of ISMRM, Miami, FL, 2005. (unpublished).
- Dunn T. C., Lu Y., Jin H., Ries M. D., and Majumdar S., “T2 relaxation time of cartilage at MR imaging: Comparison with severity of knee osteoarthritis,” Radiology 232, 592–598 (2004). 10.1148/radiol.2322030976 [DOI] [PMC free article] [PubMed] [Google Scholar]
- Regatte R. R., Akella S. V., Lonner J. H., Kneeland J. B., and Reddy R., “T1rho relaxation mapping in human osteoarthritis (OA) cartilage: Comparison of T1rho with T2,” J. Magn. Reson. Imaging 23, 547–553 (2006). 10.1002/jmri.20536 [DOI] [PubMed] [Google Scholar]
- Regatte R. R., Akella S. V., Wheaton A. J., Lech G., Borthakur A., Kneeland J. B., and Reddy R., “3D-T1rho-relaxation mapping of articular cartilage: In vivo assessment of early degenerative changes in symptomatic osteoarthritic subjects,” Acad. Radiol. 11, 741–749 (2004). [DOI] [PubMed] [Google Scholar]
- Li X., Benjamin Ma C., Link T. M., Castillo D. D., Blumenkrantz G., Lozano J., Carballido-Gamio J., Ries M., and Majumdar S., “In vivo T(1rho) and T(2) mapping of articular cartilage in osteoarthritis of the knee using 3 T MRI,” Osteoarthritis Cartilage 15, 789–797 (2007). 10.1016/j.joca.2007.01.011 [DOI] [PMC free article] [PubMed] [Google Scholar]
- Stahl R., Luke A., Li X., Carballido-Gamio J., Ma C. B., Majumdar S., and Link T. M., “T1rho, T(2) and focal knee cartilage abnormalities in physically active and sedentary healthy subjects versus early OA patients-a 3.0-Tesla MRI study,” Eur. Radiol. 19, 132–143 (2008). [DOI] [PubMed] [Google Scholar]
- Welsch G. H., Trattnig S., Scheffler K., Szomonanyi P., Quirbach S., Marlovits S., Domayer S., Bieri O., and Mamisch T. C., “Magnetization transfer contrast and T2 mapping in the evaluation of cartilage repair tissue with 3T MRI,” J. Magn. Reson. Imaging 28, 979–986 (2008). 10.1002/jmri.21516 [DOI] [PubMed] [Google Scholar]
- Stahl R., Blumenkrantz G., Carballido-Gamio J., Zhao S., Munoz T., Hellio Le Graverand-Gastineau M. P., Li X., Majumdar S., and Link T. M., “MRI-derived T2 relaxation times and cartilage morphometry of the tibio-femoral joint in subjects with and without osteoarthritis during a 1-year follow-up,” Osteoarthritis Cartilage 15, 1225–1234 (2007). 10.1016/j.joca.2007.04.018 [DOI] [PubMed] [Google Scholar]
- Dray N., Williams A., Prasad P. V., Sharma L., and Burstein D., presented at the Proceedings of the 13th Annual Meeting of ISMRM, Miami, FL, 2005. (unpublished).
- Mosher T. J., Dardzinski B. J., and Smith M. B., “Human articular cartilage: Influence of aging and early symptomatic degeneration on the spatial variation of T2--preliminary findings at 3 T,” Radiology 214, 259–266 (2000). [DOI] [PubMed] [Google Scholar]
- Smith H. E., Mosher T. J., Dardzinski B. J., Collins B. G., Collins C. M., Yang Q. X., Schmithorst V. J., and Smith M. B., “Spatial variation in cartilage T2 of the knee,” J. Magn. Reson. Imaging 14, 50–55 (2001). 10.1002/jmri.1150 [DOI] [PubMed] [Google Scholar]
- Dardzinski B. J., Laor T., Schmithorst V. J., Klosterman L., and Graham T. B., “Mapping T2 relaxation time in the pediatric knee: Feasibility with a clinical 1.5-T MR imaging system,” Radiology 225, 233–239 (2002). 10.1148/radiol.2251011461 [DOI] [PubMed] [Google Scholar]
- Watanabe A., Boesch C., Siebenrock K., Obata T., and Anderson S. E., “T2 mapping of hip articular cartilage in healthy volunteers at 3T: A study of topographic variation,” J. Magn. Reson. Imaging 26, 165–171 (2007). 10.1002/jmri.21014 [DOI] [PubMed] [Google Scholar]
- Nishii T., Tanaka H., Sugano N., Sakai T., Hananouchi T., and Yoshikawa H., “Evaluation of cartilage matrix disorders by T2 relaxation time in patients with hip dysplasia,” Osteoarthritis Cartilage 16, 227–233 (2007). [DOI] [PubMed] [Google Scholar]
- Carballido-Gamio J., Link T. M., Li X., Han E. T., Krug R., Ries M. D., and Majumdar S., “Feasibility and reproducibility of relaxometry, morphometric, and geometrical measurements of the hip joint with magnetic resonance imaging at 3T,” J. Magn. Reson. Imaging 28, 227–235 (2008). 10.1002/jmri.21411 [DOI] [PubMed] [Google Scholar]
- Blumenkrantz G., Stahl R., Carballido-Gamio J., Zhao S., Lu Y., Munoz T., Hellio Le Graverand-Gastineau M. P., Jain S. K., Link T. M., and Majumdar S., “The feasibility of characterizing the spatial distribution of cartilage T(2) using texture analysis,” Osteoarthritis Cartilage 16, 584–590 (2008). 10.1016/j.joca.2007.10.019 [DOI] [PMC free article] [PubMed] [Google Scholar]
- Koo S. and Andriacchi T. P., “A comparison of the influence of global functional loads vs. local contact anatomy on articular cartilage thickness at the knee,” J. Biomech. 40, 2961–2966 (2007). [DOI] [PMC free article] [PubMed] [Google Scholar]
- Qazi A. A., Folkesson J., Pettersen P. C., Karsdal M. A., Christiansen C., and Dam E. B., “Separation of healthy and early osteoarthritis by automatic quantification of cartilage homogeneity,” Osteoarthritis Cartilage 15, 1199–1206 (2007). 10.1016/j.joca.2007.03.016 [DOI] [PubMed] [Google Scholar]
- Altman R. et al. , “Development of criteria for the classification and reporting of osteoarthritis. Classification of osteoarthritis of the knee. Diagnostic and Therapeutic Criteria Committee of the American Rheumatism Association,” Arthritis Rheum. 29, 1039–1049 (1986). 10.1002/art.1780290816 [DOI] [PubMed] [Google Scholar]
- Kellgren J. and Lawrence J., “Radiologic assessment of osteoarthritis,” Ann. Rheum. Dis. 16, 494–502 (1957). 10.1136/ard.16.4.494 [DOI] [PMC free article] [PubMed] [Google Scholar]
- Oh J., Han E. T., Pelletier D., and Nelson S. J., “Measurement of in vivo multi-component T2 relaxation times for brain tissue using multi-slice T2 prep at 1.5 and 3 T,” Magn. Reson. Imaging 24, 33–43 (2006). 10.1016/j.mri.2005.10.016 [DOI] [PubMed] [Google Scholar]
- Carballido-Gamio J., Bauer J. S., Stahl R., Lee K. Y., Krause S., Link T. M., and Majumdar S., “Inter-subject comparison of MRI knee cartilage thickness,” Med. Image Anal. 12, 120–135 (2008). 10.1016/j.media.2007.08.002 [DOI] [PMC free article] [PubMed] [Google Scholar]
- Dardzinski B. J., Mosher T. J., Li S., Van Slyke M. A., and Smith M. B., “Spatial variation of T2 in human articular cartilage,” Radiology 205, 546–550 (1997). [DOI] [PubMed] [Google Scholar]
- Haralick R. M., Shanmugam K., and Dinstein I., “Textural features for image classification,” IEEE Trans. Syst. Man Cybern. SMC-3, 610–621 (1973). 10.1109/TSMC.1973.4309314 [DOI] [Google Scholar]
- Sonego P., Kocsor A., and Pongor S., “ROC analysis: Applications to the classification of biological sequences and 3D structures,” Briefings Bioinf. 9, 198–209 (2008). 10.1093/bib/bbm064 [DOI] [PubMed] [Google Scholar]
- Welsch G. H., Mamisch T. C., Hughes T., Zilkens C., Quirbach S., Scheffler K., Kraff O., Schweitzer M. E., Szomolanyi P., and Trattnig S., “In vivo biochemical 7.0 Tesla magnetic resonance: Preliminary results of dGEMRIC, zonal T2, and mapping of articular cartilage,” Invest. Radiol. 43, 619–626 (2008). 10.1097/RLI.0b013e31817e9122 [DOI] [PubMed] [Google Scholar]