Abstract
There is an urgent need to improve the prediction of fracture risk for cancer patients with bone metastases. Pathological fractures that result from these tumors frequently occur in the femur. It is extremely difficult to determine the fracture risk even for experienced physicians. Although evolving, fracture risk assessment is still based on inaccurate predictors estimated from previous retrospective studies. As a result, many patients are surgically over-treated, whereas other patients may fracture their bones against expectations.
We mechanically tested ten pairs of human cadaveric femurs to failure, where one of each pair had an artificial defect simulating typical metastatic lesions. Prior to testing, finite element (FE) models were generated and computed tomography rigidity analysis (CTRA) was performed to obtain axial and bending rigidity measurements. We compared the two techniques on their capacity to assess femoral failure load by using linear regression techniques, Student's t tests, the Bland-Altman methodology and Kendall rank correlation coefficients.
The simulated FE failure loads and CTRA predictions showed good correlation with values obtained from the experimental mechanical testing. Kendall rank correlation coefficients between the FE rankings and the CTRA rankings showed moderate to good correlations. No significant differences in prediction accuracy were found between the two methods.
Non-invasive fracture risk assessment techniques currently developed both correlated well with actual failure loads in mechanical testing suggesting that both methods could be further developed into a tool that can be used in clinical practice. The results in this study showed slight differences between the methods, yet validation in prospective patient studies should confirm these preliminary findings.
Keywords: Finite element analysis, CT-based structural rigidity analysis, lytic lesion, femur
Introduction
After lungs and liver, bone tissue constitutes the third most common site for the development of metastases in cancer [1]. Carcinomas of the breast, prostate, lungs, and thyroid are the most prone to metastasizing to the skeleton, accounting for approximately 80% of all bone metastases [2-4]. Although prognosis after development of metastatic bone disease is better than that seen after visceral invasion, the morbidity associated with these lesions considerably affects patients’ quality of life. Main clinical features include intractable pain, metabolic alterations such as hypercalcemia, neurological deficit in cases of spinal involvement, and spontaneous pathological fracture [3, 5]. The latter is considered the most important and troublesome complication for both the patient and the physician. Management of these types of fractures accounts for the majority of the calculated national cost burden of patients with metastatic bone disease, estimated to be $12.6 billion in the United States [1]. As survival rates from patients with primary cancer continue to improve, so will the incidence of these major complications [6].
Primary cancer site, presence of pain, and risk of fracture represent main factors to consider while choosing the most appropriate treatment following the diagnosis of a suspiciously malignant bone lesion [7]. Given the detrimental effects of bone fractures, the main challenge for the treating physician is to effectively determine the extent of the lesion, and decide whether it has weakened the bone enough to cause a pathological fracture. Patients with a low risk of pathological fracture are effectively treated for pain using nonsurgical approaches such as radiation therapy, immunotherapy, endocrine or cytotoxic chemotherapy, and bisphosphonates [8, 9]. On the other hand, operative treatment is indicated for cases of impending and pathological fractures in long bone and pelvic girdle metastases. As for patients with spinal lesions, surgical intervention is recommended when evidence of spinal cord compression and/or spinal instability ensues [8].
Although evolving, fracture risk assessment is still based on inaccurate predictors estimated from previous retrospective studies. In 1989, Mirels [10] proposed a weighted scoring system combining clinical and radiographic criteria to quantify the risk of sustaining a pathologic fracture through a metastatic long bone lesion. Although Mirels score is often used for screening of metastatic appendicular skeletal lesions, it is associated with a variety of limitations. It is based on a 2D radiographic representation of a 3D lesion which is rather imprecise in evaluating the size and nature of the lesions compared to current imaging modalities such as computed tomography and magnetic resonance imaging. Despite the low false-positive rate for lesions with scores of 9 and above, the low specificity of less than 35% [11] means that strict application of these criteria will result in unnecessary surgery in approximately two thirds of cases. A comparative analysis of risk factors conducted by Van der Linden et al. [12] provided proof of the overestimation of fracture risk when making decisions based on conventional risk factors. As an alternative to existing methods, Van der Linden et al. proposed an approach based on axial cortical involvement, the accuracy of which was further demonstrated in a randomized trial [13]. There are also conflicting data on reproducibility and reliability of the results obtained from different specialties [14] and anatomical sites [15], further emphasizing the need for a more accurate clinical tool to assess fracture risk in the presence of metastatic lesions.
We have previously demonstrated the effective use of non-invasive imaging techniques using quantitative computed tomography (QCT) for the assessment of structural rigidity and prediction of failure loads in ex-vivo and in-vivo models [16-20]. Additionally, using the same principle, we and others have shown that case-specific finite element (FE) models are capable of effectively simulating the mechanical behavior of bones under axial loading with a relatively high level of precision [21-27]. However, the prediction accuracies of computed tomography rigidity analysis (CTRA) and FE analysis have never been directly compared. In the current study we aim to establish and assess statistical comparisons between QCT structural rigidity analyses and FE analyses, in their accuracy for the estimation of femoral failure load. For that purpose, we use an experimental dataset and the corresponding FE simulations as described previously [27, 28]. Based on these experiments, we performed a QCT structural rigidity analysis and compared these results to the results from the FE analyses.
Materials and Methods
Quantitative Computed Tomography and Mechanical Experiments
For the validation of CTRA and FEA we relied on the exact results of mechanical experiments as performed previously [27, 28]. For an elaborate description of the setup of these experiments, the reader is referred to this previous work. In short, ten paired femurs from fresh-frozen human cadavers (mean age 81.7 ± 10.65 years) were obtained from the Department of Anatomy, Radboud university medical center, with institutional approval. One of the femurs in each pair was left intact and assigned to the control group. The contralateral femur was assigned to the metastatic group, while one or more defects were created. Size and location of these lesions resembled clinical appearance of lytic metastatic lesions, as discussed with orthopaedic oncologists (Table 3). Hence, they were not related to the femoral size or geometry. QCT images were acquired with the following settings: 120 kVp, 220 mA, slice thickness 3 mm, pitch 1.5, spiral and standard reconstruction, in-plane resolution 0.9375 mm (ACQSim, Philips, Eindhoven, The Netherlands). The femurs were scanned in a water basin, on top of a solid calibration phantom (Image Analysis, Columbia, KY, USA). Following imaging, the specimens underwent mechanical testing in a hydraulic mechanical testing system (MTS) machine. An axial load was applied on the head of the femur, with 10 N/s from 0 N until failure, while force and displacement of the plunger were recorded. The failure location of each femur was photographically documented.
Table 3.
Fracture locations for all specimens as predicted by FEA and CTRA methods
| Lesion Characteristics | CTRA | |||||
|---|---|---|---|---|---|---|
| Specimen | Size (mm) | Location | Mech. Testing | FEA | EA | EI |
| 1 | - | - | Neck | Neck | Neck | Neck |
| 1 | 40 | Med, prox | Intertroch. | Intertroch. | Intertroch. | Intertroch. |
| 2 | - | - | Neck | Neck | Neck | Neck |
| 2 | 40 | Med, shaft | Midshaft | Midshaft | Midshaft | Midshaft |
| 3 | - | - | Intertroch. | Neck | Intertroch. | Intertroch. |
| 3 | 22 | Med, prox | Intertroch. | Intertroch. | Intertroch. | Intertroch. |
| 4 | - | - | Neck | Neck | Neck | Neck |
| 4 | 40 | Post, prox | Intertroch. | Neck/Intertroch. | Intertroch. | Intertroch. |
| 5 | - | - | Neck | Neck | Neck | Neck |
| 5 | 45 | Med, prox | Subtroch. | Subtroch. | Subtroch. | Subtroch. |
| 6 | - | - | Neck | Neck | Neck | Neck |
| 6 | 40 | Lat, prox | Subtroch. | Neck | Subtroch. | Subtroch. |
| 7 | - | - | Neck | Neck | Neck | Neck |
| 7 | 2×22 | Med, prox&shaft | Neck | Neck | Neck | Neck/Intertroch |
| 8 | - | - | Neck | Neck | Neck | Neck |
| 8 | 40 | Ant, prox | Intertroch. | Neck/Intertroch. | Intertroch. | Intertroch. |
| 9 | - | - | Neck | Neck | Neck | Neck |
| 9 | 22 | Ant, prox | Neck | Neck | Neck | Neck |
| 10 | - | - | Neck | Neck | Neck | Neck |
| 10 | 2×30 | Ant, prox&shaft | Proximal Shaft | Neck | Proximal Shaft | Proximal Shaft |
Finite Element Analysis
The mesh generation for the FE models was accomplished by segmenting the QCT images and converting them to a solid mesh (Patran 2005 r2, MSC Software Corporation, Santa Ana, CA, USA) [28]. Calibration of the QCT scans and material property assignment was performed using the DICOM Toolkit software package, developed at the Orthopaedic Research Lab in Nijmegen [28]. The experimental boundary conditions were reproduced in the FE simulations (Figure 1). The FE simulations, adopting non-linear isotropic material behavior [29], were performed using MSC Marc (MSC.MARC2007r1, MSC Software Corporation, Santa Ana, CA, USA). The global failure load (FFE) was defined as the maximum total reaction force, i.e. the sum of the contact normal forces in the model. The elements that plastically deformed at the moment of maximal total reaction force defined the failure location [28].
Figure 1.

Anterior view of the FE-model, generated from a QCT scan. Displacement was applied to the model via the cup on the head of the femur, while the bottom of the model was fixated by means of high stiffness springs.
CT-based Structural Rigidity Analysis
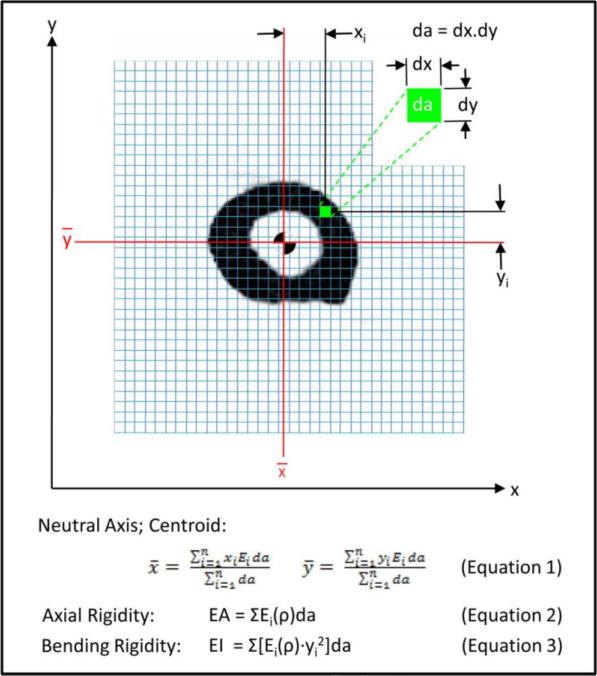
For CTRA, the grey values in the CT scan were converted to equivalent mineral density by using the linear relationship between Hounsfield units (HU) and equivalent mineral density as established by the hydroxyapatite phantom scanned with each bone. Then, the mineral density of each pixel was converted to modulus of elasticity (E) for axial (EA) and bending (EI) rigidity measurements, using empirically derived constitutive relationships for cancellous [30] and cortical [31] bone (Figure 2). The modulus neutral axis and centroid were calculated based on the coordinates of the ith pixel and its corresponding area (da), modulus (Ei), and total number of pixels in the cross section (n), as depicted in Equation 1.
| (1) |
where xi and yi represent the distance of each pixel from the x and y axes, respectively. The Young's modulus of elasticity (Ei) is defined as the ratio of tensile strength to strain in the linear region.
Figure 2.
Schematic diagram illustrating the pixel-based CTRA analysis algorithm to calculate axial (EA) and bending (EI) rigidities. Each grid element is intended to represent one pixel (the exaggeration of the grid element size is done solely for illustration purposes). The different equations are presented, where ρ represents bone density, xi and yi represent the distance of each pixel form the x and y axes respectively, da represents the area of each pixel, Ei represents Young's modulus of elasticity (defined as the ratio of tensile strength to strain in the linear region), and Gi represents the shear modulus (defined as the ratio of shear stress to shear strain in the linear region).
The modulus neutral axis and centroid (Equation 1) are determined based on the coordinates of the ith pixel, its modulus (Ei), area (da), and total number of pixels in the bone cross-section (n). Axial rigidity, which provides a measure of the bone's resistance to deformation when subjected to uniaxial tensile or compressive loads (equation 2), is estimated by summing the products of each pixel's elastic modulus (Ei) and pixel area (da). Bending rigidity provides a measure of the bone's resistance to flexure deformation when subjected to bending moments. Its rigidity about the y-axis (equation 3) is the sum of the products of the elastic modulus (Ei), square of the ith pixel distance to the neutral axis (ȳ), and the pixel area (da).
Axial rigidity provides a measure of the bone's resistance to uniaxial (tensile or compressive) loads, whereas bending rigidity provides a measure of the bone's resistance to bending moments. For each trans-axial image, EA and EI were calculated by summing the modulus-weighted area of each pixel within the bone contour by the position of the pixel relative to the centroid of the bone cross-section as described in Equations 2 and 3:
| (2) |
| (3) |
The cross-section through the affected bone that has the lowest rigidity value is the weakest and assumed to govern failure of the entire bone. Therefore, the cross section with the lowest rigidity in the tested area is considered the failure region.
Data Analysis
CTRA-based axial (EA) and bending (EI) rigidities and FE-based failure load results were correlated with the experimental failure load from mechanical testing. Paired t-tests were used to assess the mean difference in failure load (N) determined by mechanical testing (FMECH) and CTRA-based EA and FE-based failure load (FFE).
The Bland-Altman technique was applied to assess agreement in CTRA-based axial rigidity and FE-based failure load compared to the gold standard mechanical testing with limits of agreement determined as mean difference ± 1.96 standard deviations (i.e. 95% confidence interval of the difference) [32]. The Bland-Altman technique is based on plotting the difference between two sets of measurements and plots the difference on the y-axis and the average of the two measurements on the x-axis (this is done for each pair of observations; hence the paired comparison between the two methods). By convention, a line is drawn to represent the mean difference and this is called the “bias”. In addition, two lines are drawn to represent the precision of agreement, called the “limits of agreement” and are calculated as 1.96 × standard deviations of the mean difference (i.e., these are analogous to the 95% confidence interval) and by definition will encompass 95% of the data points.
The correlation between the difference in CTRA-based EA and FE-based failure load with the gold standard failure load was calculated to assess whether the bias was constant across the range of possible loads to failure. Although CTRA does not provide a direct failure load prediction, the output parameters in FE (failure load in N) and CTRA-based EA (axial rigidity in N) are the same and therefore comparable using the Bland-Altman method. In contrast, the output parameters in CTRA-based EI (in Nm2) are not the same unit-wise and therefore not directly comparable using this particular analysis.
To test the robustness of the two methods in predicting failure load, the size and location of the artificial lesions were varied as much as possible. Obviously, this makes it impossible to study lesion-specific prediction accuracy between the two methods as a large variation in lesion characteristics comes with a small number of specimens per variation. Therefore we studied differences in prediction accuracy between subgroups, i.e. for the intact specimens and the specimens with a defect, in addition to the analyses on total group of specimens.
In addition, the output parameters were used to rank the femurs from weak to strong; this was done for both the outcome parameters of FE and CTRA. These rankings were subsequently compared with the experimental ranking and with each other using the Kendall rank correlation coefficient (τ), which allowed for studying prediction accuracy among the different methods.
The fracture locations in the experiments were qualitatively compared to the fracture lines predicted by the FE model and to the cross-section that was assumed to govern failure of the femur in the CTRA analysis.
Power analysis indicated that 10 femur pairs (n = 20) were required [33]. Statistical analyses were performed using MedCalc version 12.2.1 (MedCalc Software, Mariakerke, Belgium) and STATA (Statistics/Data Analysis 11.2, College Station, TX, USA) software packages. Two-tailed P < 0.05 was considered statistically significant.
Results
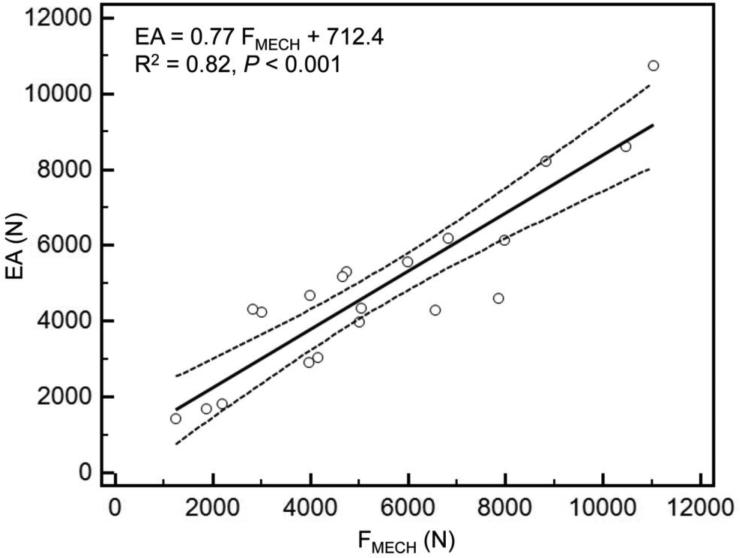
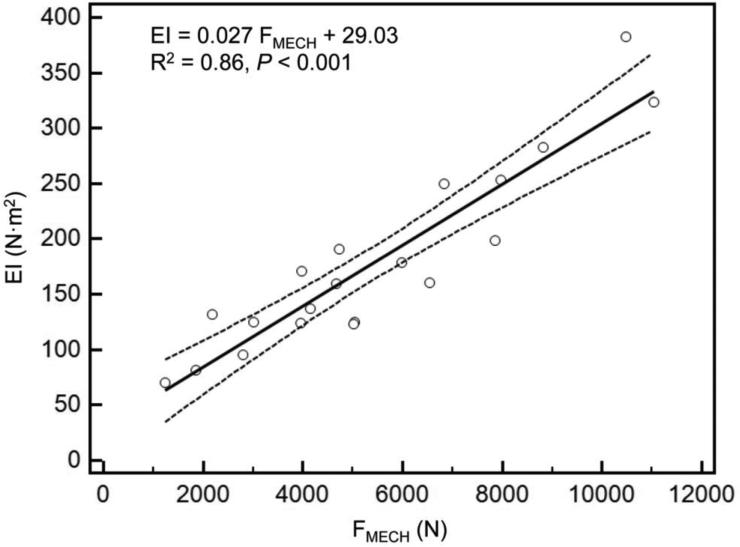
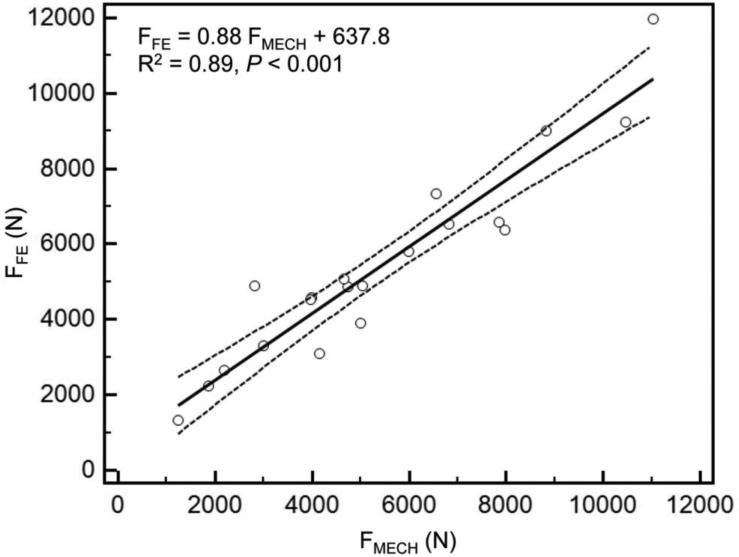
As reported previously [28], mechanical testing procedures were successfully completed on every specimen. Overall, the axial and bending rigidities obtained through CTRA correlated well with the load capacity obtained from mechanical testing (Figures 3a and 3b). The coefficients of determination for the femurs were 0.82 for EA and 0.86 for EI (< 0.001 for all cases). As shown in previous work, the simulated FE models accurately predicted the failure load of the intact as well as the metastatic femurs as measured in the experiments (R2=0.89 and p < 0.001) (Figure 3c).
Figure 3.
A) Linear regression between failure load from mechanical testing versus axial rigidity (a) and bending rigidity (b) and failure load predicted by the FE models (c).
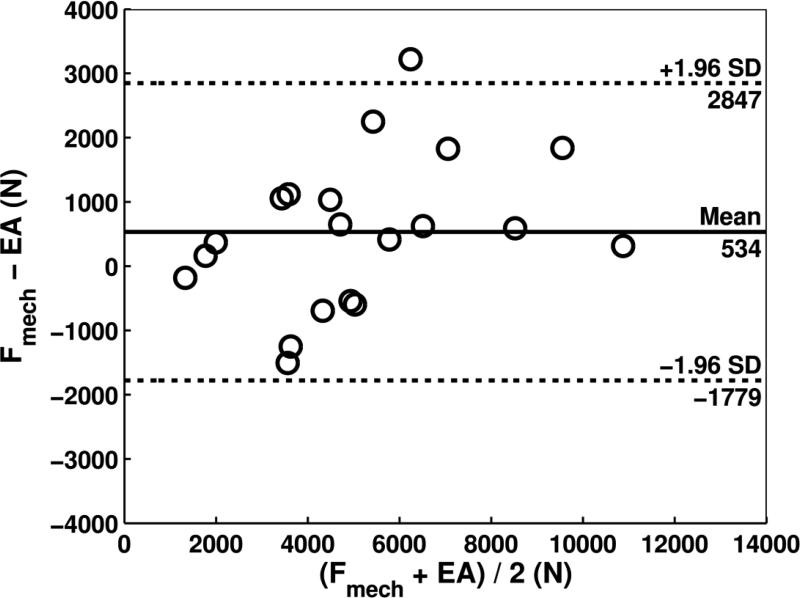
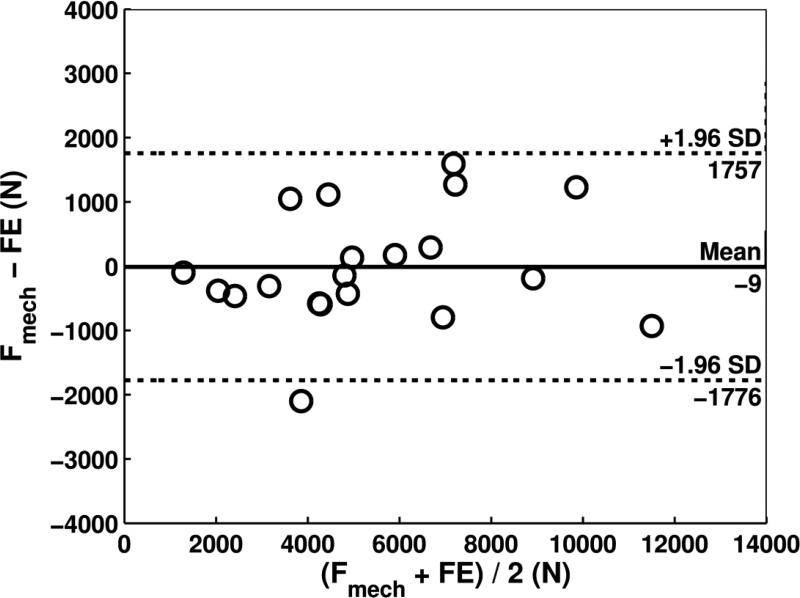
When considering all specimens, paired t-tests did not indicate differences between CTRA-based EA index and mechanical testing with an average underestimation of 534 N for failure load (Table 1, P = 0.06). FE demonstrated a mean difference of −9 N compared to mechanical testing, which was not significant (P = 0.96). Bland-Altman analysis revealed that the limits of agreement defined as 95% confidence intervals were moderate for CTRA-based EA (Figure 4a). For example, the mean difference of 534 N for EA is associated with a precision between −1779 to 2847 N, implying that 95% of the time, EA will provide an estimate of failure in this range compared to the gold standard. For EA, the bias was constant across the magnitude of failure load as judged by non-significant correlation between the average versus the difference (r = 0.36, P = 0.12). FE showed more accurate estimates of failure load than each of the two CT-based rigidity parameters (all P < 0.001, paired t-tests on the deltas versus mechanical testing). The limits of agreement in the Bland-Altman plot indicate that the FE estimated failure load on average is nearly the same as mechanical testing (mean difference of −9 N) and provides estimates that are within the range of −1776 to 1757 N (Figure 4b, Table 1). Moreover, the bias throughout the magnitude of possible failure loads is constant as indicated by a non-significant correlation between the average versus the difference (r = 0.20, P = 0.39).
Table 1.
Comparison of CTRA based EA and FE based failure load for estimation of experimental failure load
| TOTAL | INTACT | DEFECT | |||||||
|---|---|---|---|---|---|---|---|---|---|
| EXP | EA | FE | EXP | EA | FE | EXP | EA | FE | |
| Failure load (N) | 5404 ± 2764 | 4870 ± 2347 | 5413 ± 2583 | 6771 ± 2498 | 5823 ± 2297 | 6255 ± 2634 | 4037 ± 2394 | 3916 ± 2081 | 4572 ± 2362 |
| P-value (paired t-test) | 0.06* | 0.96* | 0.03** | 0.09** | 0.74** | 0.02** | |||
| Mean ± SD of Difference vs. Mechanical Testing | 534 ± 1180 | −9 ± 901 | 948 ± 1153 | 517 ± 850 | 120 ± 1108 | −535 ± 615 | |||
| Bland-Altman Method#, 95% CI | −1779 to 2847 | −1776 to 1757 | −1311 to 3208 | −1149 to 2183 | −2052 to 2292 | −1740 to 670 | |||
Plus-minus values are mean ± SD and data are based on 10 paired femurs.
Plus-minus values are mean ± SD and data are based on 10 single femurs.
Bland-Altman method evaluating limits of agreement between each method (QCT and FEA) versus mechanical testing based on mean difference (bias) and 95% confidence interval of difference (± 1.96 SDs).
Figure 4.
Bland-Altman plots for CTRA based axial rigidity (a) and FE based failure load (b). In Figure 4a, the Bland-Altman plot compares the force (N) between mechanical testing and EA for 20 human femurs and shows that the mean difference is 534 N, indicating that on average, force as measured by mechanical testing was 534 N greater than force determined by EA (solid line). The dashed lines represent the 95% limits of agreement and indicate that the difference between the two methods, while averaging 534 N, may range between 1779 N lower to 2847 N higher for mechanical testing compared to EA. There was no significant correlation between the difference on the y-axis and the mean on the x-axis of the two methods, suggesting that the bias is approximately constant throughout the range of values for the 20 human specimens. Regarding Figure 4b, the Bland-Altman plot shows the mean difference in force between mechanical testing and finite element (FE) analysis to be only -9 N, meaning that on average the difference or bias between the two sets of measurements is very close to 0, (ie, about 9 N greater with FE than with mechanical testing). In addition, the limits of agreement as denoted by the dashed lines (+/− 1.96 × SD of the mean difference) reveals that 95% of the time the force using mechanical testing can be somewhere 1776 N lower than FE to 1757 N higher than FE. Again, the bias appears to be constant throughout the range of values, meaning that the variability of the paired measurements between mechanical and FE vary almost equally above and below the mean (solid) line. The Bland-Altman plots in essence provide an excellent graphical representation for assessing agreement between two different methods of measurement and the limits of agreement demarcate the width of the difference that can be expected 95% of the time. The Bland-Altman technique does not require having a “gold standard,” but typically the “new method of interest” (e.g., EA or FE) is subtracted from the conventional method (in this case, mechanical testing) on the y-axis.
To further study differences in prediction accuracy between the two methods, the paired t-tests and Bland-Altman analysis were repeated for the intact and defect specimens separately (Table 1). Paired t-tests then showed a significant difference between mechanical testing and EA for the intact femurs and between mechanical testing and FE for the metastatic femurs. In addition, for EA the bias varied over the different analyses (total group and both subgroups), but the limits of agreement were constant. For FE there were differences in both the bias and the limits of agreement over the analyses. The more narrow limits of agreement in the subgroup analysis of the defect specimens suggested a higher accuracy at the cost of a larger systemic error (as the bias was larger than in the overall analysis). For the defect femurs, which are of main interest here, CTRA showed the smallest bias (120 N vs. −535 N for FE), whereas FE showed a higher agreement among predictions (SD 615 N vs. 1108 N for CTRA).
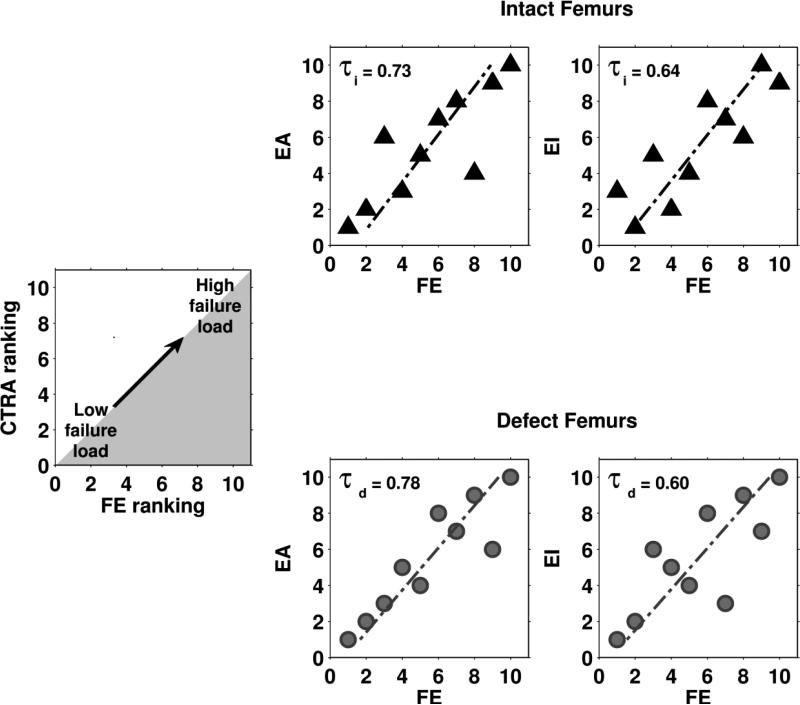
High Kendall rank correlations between the experiments and the predictions by either FE or CTRA (all significant at the p=0.05 level) were found (Table 2). Furthermore, Kendall rank correlations between the FE rankings and the CTRA rankings showed moderate to good correlations (Figure 5). No significant differences in prediction accuracy were found between the two methods.
Table 2.
Correlations between rankings of the femurs in the experiments and the predictions by FE and CTRA using Kendall Tau ranking coefficients
indicates significant correlations at the p-level of 0.05.
Figure 5.
The output parameters (failure load for FE and EA and EI for CTRA) were used to rank the femurs from weak to strong. These rankings were subsequently compared by calculating the Kendall rank correlation coefficient (τ). This figure shows Kendall rank correlation coefficients between failure load predicted by the FE models and axial (left panel) and bending (right panel) rigidities calculated by CTRA, both for intact (τi , triangles) and metastatic femurs (τd , circles).
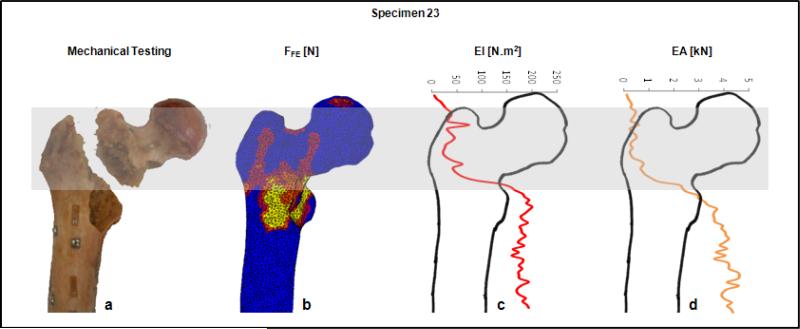
The fracture locations in the experiments were qualitatively compared to the fracture lines predicted by the FE model and to the minimum rigidity cross-section from CTRA analysis. (Figure 6 provides a graphic presentation of a representative specimen). The results indicated that the fracture locations were always directed through the lesion in the defect specimens, if applicable. Overall, the fracture locations were reasonably well predicted by both FE [28] and CTRA methods as highlighted in Table 3.
Figure 6.
Fracture location as demonstrated by mechanical testing (a), FE (b) and CTRA analysis (c and d) on a representative specimen. The grey band highlights the failed area as outlined from mechanical testing (panel a). The FE results indicate the elements that underwent plastic deformation in this region (red to yellow sections in panel b), and the bending and axial rigidities (panel c and d) show the lowest EI and EA values for the CT slices residing in the grey fracture zone. The horizontal bar at the top provides the EA and EI axes, and the vertical axis (not shown in axis, which is collinear with the long axis of the bone) is the slice number of the CT data stack.
Discussion
In recent years, different diagnostic tools have been developed to address the common quandary encountered by physicians when assessing fracture risk prediction in patients found to have a metastatic bone lesion. The choice for the most appropriate therapeutic approach should be objectively determined by methods that consider bone as a structure, whose mechanical behavior depends on both material and geometric properties. This study compared the prediction accuracy of CTRA to the prediction accuracy of FEA, determined on the basis of actual mechanical experiments using paired femurs with and without simulated lytic lesions. We were able to demonstrate that structural rigidity retrieved from CTRA, as well as failure loads predicted by FE correlated well with the actual failure loads obtained from mechanical testing. There were no significant differences in prediction accuracy between the two modeling techniques.
As reported previously [28], the correlation coefficients between the FE predicted and the actual measured failure forces (R2=0.89) were similar to those obtained in other FE studies [27, 29, 34, 35]. Similarly, relatively high correlation coefficients between CTRA and mechanical testing data were evidenced (R2=0.82 and 0.86, EA and EI respectively). These results are comparable to those obtained by Hong et al. [17], who showed high coefficients of determination when comparing reductions in failure loads versus reductions in axial, bending and torsional rigidity (R2=0.84, 0.80 and 0.71, respectively) in samples from whale trabecular bone. Similarly, Whealan et al [20] demonstrated the effectiveness of QCT derived measurements of rigidity for the prospective prediction of yield loads of vertebrae with simulated lytic lesions (rc=0.74). Finally, by assessing fracture prediction through benign skeletal lesions in children and young adults, Snyder et al [19] indicated that bending and torsional rigidities were each highly significant predictors of fracture occurrence and combined, these measures could predict femoral fractures with 97% accuracy.
Studying the intact and defect specimens separately allowed for further evaluating potential differences in prediction accuracy between the two methods. Especially in the specimens with an artificial defect, contrasting results were seen. CTRA seemed to have a higher accuracy (as the bias was lowest), whereas FE showed a higher precision (due to smaller limits of agreement). This could indicate that FE calculations need a correction for the systemic bias but could more closely approach the failure load in defect femurs on a subject-specific level. In contrast, CTRA will provide more accurate estimates of axial rigidity (as a surrogate for failure load) on the group level. However, further studies using larger numbers of specimens should confirm our findings.
Unlike previously proposed radiographic guidelines, both methods are able to deliver objective predictions while considering important biomechanical aspects of the bone, being a three-dimensional structure governed by its material and geometric properties; even if these are affected by the presence of a lytic lesion. Both techniques are based on QCT imaging, but computational times differ considerably between the two methods. Generating and running the FE simulations in this study takes about 8 hours per sample, and the sophisticated and relatively complex FE software required asks for a certain level of expertise as well as background in biomechanics. CTRA takes only approximately 30 minutes, as this software is intentionally designed to be simple and be readily useable on a regular computer with an operator without expertise in structural mechanics. For those reasons, one would choose CTRA analysis. In contrast, FE simulations would be more suitable for the implementation of complex loading conditions. It is likely that the decrease in bone strength resulting from metastatic lesions is very focal and can differ a lot between patients. As a result, small muscle forces that insert on the femur close to the lesion site can be more dangerous than larger forces such as for example the hip contact force. The comprehension of such potentially important anatomical characteristics might be more straightforward using FEA.
Furthermore, prospective patient studies should resolve whether the two modeling techniques have equal prediction accuracy in clinical practice. That is, clinical experts have difficulties relating predicted biomechanical parameters, such as global strength or rigidity, to the clinical fracture risk for a certain patient.
Limitations of our study are shared with many previous works done in the field using ex-vivo models for the assessment of failure load prediction using non-invasive imaging methods. On a group level, both methods accurately predict the femoral load capacity, but on the individual level there can be rather large over- and under-estimations of the femoral strength. These subject-specific over- and under-estimations should be improved before either of the methods can be implemented in clinical practice.
Moreover, isotropic material behaviour was implemented in the FE models. We found that fracture locations in intact femora were often predicted in the subcapital region, whereas the experimental fractures were located more in between the greater and lesser trochanter. The implementation of isotropic material behaviour rather than anisotropic behaviour is a plausible cause for this. However, it is not yet possible to practically implement realistic anisotropic material behaviour in FE models based on clinical CT images. Trabecular architecture is only visible on the micro-level, and as such anisotropic measures can only be determined from micro-CT scans or high-resolution CT-scans. In contrast, CTRA is an axial analysis by default, where it uses compressive and tensile constitutive properties in their axial direction to convert pixel density to modulus of elasticity. Therefore, it does not take into consideration mechanical properties of the bone in the transverse direction.
Furthermore, it is a universal rule that ex-vivo experimental results introduce a certain amount of limitation when extrapolating to in-vivo conditions. Evident differences exist between the metastatic lytic lesions that were artificially simulated in this study and those seen in patients in the clinical practice. In our case, regularly shaped defects were limited to cortical lesions, while metastatic bone lesions generally show an irregular pattern and additionally involve trabecular tissue. However, QCT would be readily able to detect these irregularities and incorporate them into both algorithmic analytical processes, although accurately modeling the material properties of blastic metastatic tissue might be challenging. Moreover, we are currently working on the evaluation of the FE simulations for the prediction of femoral failure load using in-vivo patient data, and the preliminary results are promising [23].
In summary, the results of our study showed that non-invasive subject-specific fracture risk assessment techniques correlate evenly well with actual failure loads measured in mechanical experiments. This suggests that both methods could be further developed into a tool that can be used in clinical practice. When analyzing the defect femurs only, the results suggested that predictions by FEA are slightly more accurate on a subject-specific level, yet CTRA analysis can be conducted expediently by non-expert operators. However, validation in prospective patient studies should confirm these preliminary findings. Such future clinical studies should additionally resolve how these methods can be implemented in clinical settings in order to improve the prediction of the fracture risk in metastatic bone disease.
Highlights file.
There is an urgent need to improve the prediction of fracture risk for cancer patients with bone metastases.
Finite element (FE) models and computed tomography rigidity analysis (CTRA) are promising, non-invasive techniques to improve fracture risk assessments.
Predictions by both FE models and CTRA analysis correlated well with actual femoral failure loads retrieved from mechanical tests.
No significant differences in prediction accuracy were found between the two methods.
Prospective patient studies should resolve whether the two modeling techniques have equal prediction accuracy in clinical practice.
Acknowledgements
Funding
This work has been funded by the Dutch Science Foundation NWO-STW (NPG.06778), Stichting Anna Fonds, the Furlong Research Charitable Foundation and Fonds NutsOhra. This work has also been funded by the National Institute of Health Loan Repayment Program (AN) and internal funds from the Department of Orthopaedic Surgery at Boston Children's Hospital (BDS).
Footnotes
Publisher's Disclaimer: This is a PDF file of an unedited manuscript that has been accepted for publication. As a service to our customers we are providing this early version of the manuscript. The manuscript will undergo copyediting, typesetting, and review of the resulting proof before it is published in its final citable form. Please note that during the production process errors may be discovered which could affect the content, and all legal disclaimers that apply to the journal pertain.
References
- 1.Schulman KL, Kohles J. Economic burden of metastatic bone disease in the U.S. Cancer. 2007;109:2334–2342. doi: 10.1002/cncr.22678. [DOI] [PubMed] [Google Scholar]
- 2.Clezardin P, Teti A. Bone metastasis: pathogenesis and therapeutic implications. Clin Exp Metastasis. 2007;24:599–608. doi: 10.1007/s10585-007-9112-8. [DOI] [PubMed] [Google Scholar]
- 3.Coleman RE. Clinical features of metastatic bone disease and risk of skeletal morbidity. Clin Cancer Res. 2006;12:6243s–6249s. doi: 10.1158/1078-0432.CCR-06-0931. [DOI] [PubMed] [Google Scholar]
- 4.Hage WD, Aboulafia AJ, Aboulafia DM. Incidence, location, and diagnostic evaluation of metastatic bone disease. Orthop Clin North Am. 2000;31:515–28, vii. doi: 10.1016/s0030-5898(05)70171-1. [DOI] [PubMed] [Google Scholar]
- 5.Toma CD, Dominkus M, Nedelcu T, Abdolvahab F, Assadian O, Krepler P, Kotz R. Metastatic bone disease: a 36-year single centre trend-analysis of patients admitted to a tertiary orthopaedic surgical department. J Surg Oncol. 2007;96:404–410. doi: 10.1002/jso.20787. [DOI] [PubMed] [Google Scholar]
- 6.Papagelopoulos PJ, Savvidou OD, Galanis EC, Mavrogenis AF, Jacofsky DJ, Frassica FJ, Sim FH. Advances and challenges in diagnosis and management of skeletal metastases. Orthopedics. 2006;29:609–620. doi: 10.3928/01477447-20060701-01. [DOI] [PubMed] [Google Scholar]
- 7.Johnson SK, Knobf MT. Surgical interventions for cancer patients with impending or actual pathologic fractures. Orthop Nurs. 2008;27:160–171. doi: 10.1097/01.NOR.0000320543.90115.d5. [DOI] [PubMed] [Google Scholar]
- 8.Bickels J, Dadia S, Lidar Z. Surgical management of metastatic bone disease. J Bone Joint Surg Am. 2009;91:1503–1516. doi: 10.2106/JBJS.H.00175. [DOI] [PubMed] [Google Scholar]
- 9.Houston SJ, Rubens RD. The systemic treatment of bone metastases. Clin Orthop Relat Res. 1995:95–104. [PubMed] [Google Scholar]
- 10.Mirels H. Metastatic disease in long bones. A proposed scoring system for diagnosing impending pathologic fractures. Clin Orthop Relat Res. 1989;249:256–264. [PubMed] [Google Scholar]
- 11.Damron TA, Morgan H, Prakash D, Grant W, Aronowitz J, Heiner J. Critical evaluation of Mirels’ rating system for impending pathologic fractures. Clin Orthop Relat Res. 2003:S201–S207. doi: 10.1097/01.blo.0000093842.72468.73. [DOI] [PubMed] [Google Scholar]
- 12.Van der Linden YM, Dijkstra PD, Kroon HM, Lok JJ, Noordijk EM, Leer JW, Marijnen CA. Comparative analysis of risk factors for pathological fracture with femoral metastases. J Bone Joint Surg Br. 2004;86:566–573. [PubMed] [Google Scholar]
- 13.Van der Linden YM, Kroon HM, Dijkstra SP, Lok JJ, Noordijk EM, Leer JW, Marijnen CA. Simple radiographic parameter predicts fracturing in metastatic femoral bone lesions: results from a randomised trial. Radiother Oncol. 2003;69:21–31. doi: 10.1016/s0167-8140(03)00232-9. [DOI] [PubMed] [Google Scholar]
- 14.El-Husseiny M, Coleman N. Inter- and intra-observer variation in classification systems for impending fractures of bone metastases. Skeletal Radiol. 2010;39:155–160. doi: 10.1007/s00256-009-0823-6. [DOI] [PubMed] [Google Scholar]
- 15.Evans AR, Bottros J, Grant W, Chen BY, Damron TA. Mirels’ rating for humerus lesions is both reproducible and valid. Clin Orthop Relat Res. 2008;466:1279–1284. doi: 10.1007/s11999-008-0200-0. [DOI] [PMC free article] [PubMed] [Google Scholar]
- 16.Entezari V, Basto PA, Vartanians V, Zurakowski D, Snyder BD, Nazarian A. Non invasive assessment of failure torque in rat bones with simulated lytic lesions using computed tomography based structural rigidity analysis. J Biomech. 2011;44:552–556. doi: 10.1016/j.jbiomech.2010.09.022. [DOI] [PMC free article] [PubMed] [Google Scholar]
- 17.Hong J, Cabe GD, Tedrow JR, Hipp JA, Snyder BD. Failure of trabecular bone with simulated lytic defects can be predicted non-invasively by structural analysis. J Orthop Res. 2004;22:479–486. doi: 10.1016/j.orthres.2003.09.006. [DOI] [PubMed] [Google Scholar]
- 18.Nazarian A, Pezzella L, Tseng A, Baldassarri S, Zurakowski D, Evans CH, Snyder BD. Application of structural rigidity analysis to assess fidelity of healed fractures in rat femurs with critical defects. Calcif Tissue Int. 2010;86:397–403. doi: 10.1007/s00223-010-9353-4. [DOI] [PMC free article] [PubMed] [Google Scholar]
- 19.Snyder BD, Hauser-Kara DA, Hipp JA, Zurakowski D, Hecht AC, Gebhardt MC. Predicting fracture through benign skeletal lesions with quantitative computed tomography. J Bone Joint Surg Am. 2006;88:55–70. doi: 10.2106/JBJS.D.02600. [DOI] [PubMed] [Google Scholar]
- 20.Whealan KM, Kwak SD, Tedrow JR, Inoue K, Snyder BD. Noninvasive imaging predicts failure load of the spine with simulated osteolytic defects. J Bone Joint Surg Am. 2000;82:1240–1251. doi: 10.2106/00004623-200009000-00004. [DOI] [PubMed] [Google Scholar]
- 21.Bessho M, Ohnishi I, Matsuyama J, Matsumoto T, Imai K, Nakamura K. Prediction of strength and strain of the proximal femur by a CT-based finite element method. J Biomech. 2007;40:1745–1753. doi: 10.1016/j.jbiomech.2006.08.003. [DOI] [PubMed] [Google Scholar]
- 22.Cody DD, Gross GJ, Hou FJ, Spencer HJ, Goldstein SA, Fyhrie DP. Femoral strength is better predicted by finite element models than QCT and DXA. J Biomech. 1999;32:1013–1020. doi: 10.1016/s0021-9290(99)00099-8. [DOI] [PubMed] [Google Scholar]
- 23.Derikx LC, van der Linden YM, Snyers A, Verdonschot N, Tanck E. Patient-specific finite element models differentiate between patients with and without a pathological fracture in metastatic bone disease.. In: Fernandes P, Folgado J, Silva M, editors. 18th Congress of the European Society of Biomechanics; Lisbon. 2012; Journal of Biomechanics, Elsevier; p. S534. [Google Scholar]
- 24.Keyak JH, Falkinstein Y. Comparison of in situ and in vitro CT scan-based finite element model predictions of proximal femoral fracture load. Med Eng Phys. 2003;25:781–787. doi: 10.1016/s1350-4533(03)00081-x. [DOI] [PubMed] [Google Scholar]
- 25.Schileo E, Taddei F, Cristofolini L, Viceconti M. Subject-specific finite element models implementing a maximum principal strain criterion are able to estimate failure risk and fracture location on human femurs tested in vitro. J Biomech. 2008;41:356–367. doi: 10.1016/j.jbiomech.2007.09.009. [DOI] [PubMed] [Google Scholar]
- 26.Taddei F, Cristofolini L, Martelli S, Gill HS, Viceconti M. Subject-specific finite element models of long bones: An in vitro evaluation of the overall accuracy. J Biomech. 2006;39:2457–2467. doi: 10.1016/j.jbiomech.2005.07.018. [DOI] [PubMed] [Google Scholar]
- 27.Tanck E, van Aken JB, Van der Linden YM, Schreuder HW, Binkowski M, Huizenga H, Verdonschot N. Pathological fracture prediction in patients with metastatic lesions can be improved with quantitative computed tomography based computer models. Bone. 2009;45:777–783. doi: 10.1016/j.bone.2009.06.009. [DOI] [PubMed] [Google Scholar]
- 28.Derikx LC, van Aken JB, Janssen D, Snyers A, Van der Linden YM, Verdonschot N, Tanck E. The assessment of the risk of fracture in femora with metastatic lesions: Comparing case-specific finite element analyses with predictions by clinical experts. J Bone Joint Surg Br. 2012;94:1135–1142. doi: 10.1302/0301-620X.94B8.28449. [DOI] [PubMed] [Google Scholar]
- 29.Keyak JH, Kaneko TS, Tehranzadeh J, Skinner HB. Predicting proximal femoral strength using structural engineering models. Clin Orthop Relat Res. 2005;437:219–228. doi: 10.1097/01.blo.0000164400.37905.22. [DOI] [PubMed] [Google Scholar]
- 30.Rice JC, Cowin SC, Bowman JA. On the dependence of the elasticity and strength of cancellous bone on apparent density. J Biomech. 1988;21:155–168. doi: 10.1016/0021-9290(88)90008-5. [DOI] [PubMed] [Google Scholar]
- 31.Snyder SM, Schneider E. Estimation of mechanical properties of cortical bone by computed tomography. J Orthop Res. 1991;9:422–431. doi: 10.1002/jor.1100090315. [DOI] [PubMed] [Google Scholar]
- 32.Bland JM, Altman DG. Statistical methods for assessing agreement between two methods of clinical measurement. Lancet. 1986;1:307–310. [PubMed] [Google Scholar]
- 33.Moore D, McCabe G. Introduction to the Practice of Statistics. 4 ed. W.H. Freeman and Company; New York: 2003. [Google Scholar]
- 34.Bessho M, Ohnishi I, Okazaki H, Sato W, Kominami H, Matsunaga S, Nakamura K. Prediction of the strength and fracture location of the femoral neck by CT-based finite-element method: a preliminary study on patients with hip fracture. J Orthop Sci. 2004;9:545–550. doi: 10.1007/s00776-004-0824-1. [DOI] [PubMed] [Google Scholar]
- 35.Dragomir-Daescu D, Op Den BJ, McEligot S, Dai Y, Entwistle RC, Salas C, Melton LJ, III, Bennet KE, Khosla S, Amin S. Robust QCT/FEA models of proximal femur stiffness and fracture load during a sideways fall on the hip. Ann Biomed Eng. 2011;39:742–755. doi: 10.1007/s10439-010-0196-y. [DOI] [PMC free article] [PubMed] [Google Scholar]


