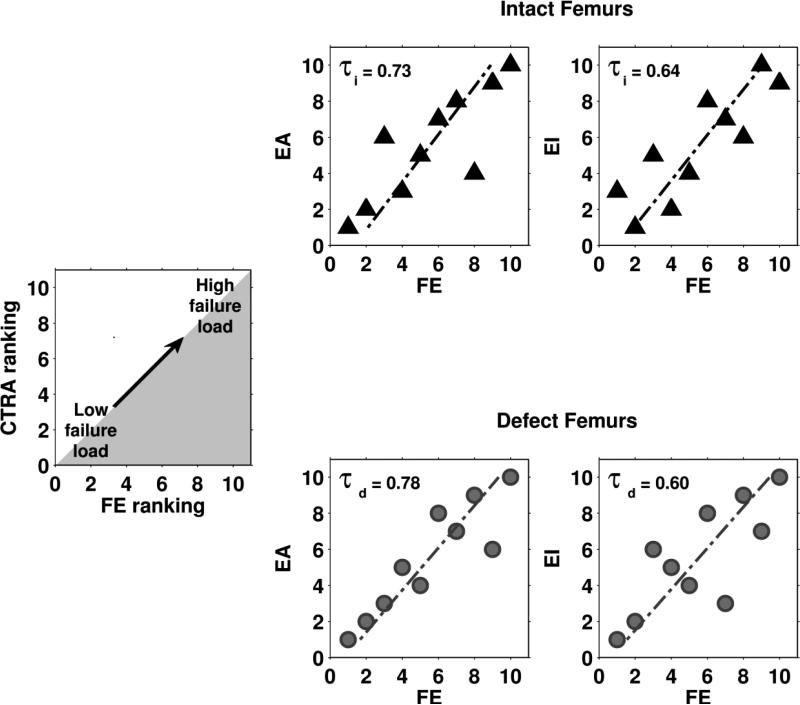
Figure 5.
The output parameters (failure load for FE and EA and EI for CTRA) were used to rank the femurs from weak to strong. These rankings were subsequently compared by calculating the Kendall rank correlation coefficient (τ). This figure shows Kendall rank correlation coefficients between failure load predicted by the FE models and axial (left panel) and bending (right panel) rigidities calculated by CTRA, both for intact (τi , triangles) and metastatic femurs (τd , circles).

