Abstract
Purpose
To determine the precision and accuracy of Accu-Beads and their utility as a quality control product for manual and automated measurements of sperm concentration.
Methods
This observational study was performed at an Assisted Reproductive Technology laboratory in a tertiary-care, university hospital. To simulate sperm concentration, bead concentrations were measured with the use of a manual and an automated method.
Results
The manual counts did not vary significantly from the automated counts regardless of the concentration. However, the counts did vary between lots of low concentration of Accu-Beads and between the two different types of fixed counting chambers. The two bead concentrations used in this study were below the 95 % confidence interval for the values listed by the manufacturer.
Conclusion(s)
In our laboratory, Accu-Beads met enough of the requirements of a good control material to be acceptable for daily quality control use, especially if we set our own ranges of acceptability for each vial of Accu-Beads. It is necessary to evaluate each new lot of Accu-Beads when they are received and again if they are used with a different counting chamber.
Keywords: Accu-Beads, Computer automated semen analyzer, CASA, Quality control, Semen analysis
Introduction
The ability to verify the accuracy and precision of a diagnostic test is essential, especially in the medical field. The semen analysis is no exception.
Measurement of sperm concentration can be performed manually or with automation via the computer automated semen analyzer (CASA). The potential of imprecision of an analytical semen analysis method falls into four areas: 1) the instrumentation used to evaluate the semen specimen, 2) the counting chamber used, 3) the inter-personnel differences in technique, and 4) the analyte.
The CASA is primarily computer-driven and operator intervention is required only in selecting fields for analysis and reviewing results. Algorithms used to determine sperm concentration and motility characteristics are programmed into computer software and cannot be changed by the operator. Furthermore, parameter settings (either preset by the manufacturer or developed by the operator) do not change from analysis to analysis. In addition, the CASA requires no external reagents and once initial calibration has been performed, little to no re-calibration of the CASA by the operator is needed.
Previous experiments have determined that a disposable microscope slide with a fixed depth and volume, such as the MicroCell (Vitrolife, Englewood, Colorado), is the most accurate chamber available to evaluate semen [1, 2]. The chamber fills by capillary action and cannot be over-filled. If the chamber is under-filled, air bubbles are easily seen and the chamber can be discarded. As for accuracy of the MicroCell, we previously reported that, when used with a CASA, it has its maximum effectiveness when the range of sperm concentration is 20 × 106 M/mL to 149 × 106 M/mL [1].
Laboratory personnel can introduce error into an analytical method with poor specimen handling techniques [3]. Technicians can inadequately mix a specimen and thus introduce error before sampling. Other sources of technician-introduced error include improper specimen dilution, improper pipetting techniques, and incorrect loading of counting chambers. Proper training and periodic review of work habits of andrologists will help insure that they perform semen analyses correctly and in a similar manner [4].
Characteristics of the analyte in question may also contribute error to a method, particularly if the analyte is semen. Because semen is a nonhomogeneous fluid, it is difficult to obtain an even distribution of sperm cells in seminal plasma [5]. In addition, motility of sperm decreases over time [1]. In our laboratory, sperm cells appear to aggregate with each other and with debris in seminal plasma over time.
Characteristics of a good control material include 1) similarity to actual patient specimens; 2) availability in large enough quantities to allow evaluation over a long time; 3) availability in concentrations representative of normal values or medical decision-making levels; 4) similarity in concentration drop-to-drop and vial-to-vial (precision); and 5) stability over a long time (a year or more) [6].
Previously, we reported that a semen-based quality control product (Semen CMC, Conception Technologies, San Diego, CA) proved too unreliable as a daily-use quality control material for semen analysis when used with a CASA [7]. Accu-Beads (Hamilton-Thorne Research, Beverly, MA), latex spheres suspended in an aqueous solution, are also sold as a control material. These latex beads are similar in size to sperm heads [7] and are available in two known concentrations–35 M/mL (High) and 18 M/mL (Low). In addition, the beads are available in large quantities and are stable for years. The only drawback to these beads is that they do not simulate an actual semen specimen because of their lack of motility [7].
The purpose of this study is to determine precision and accuracy of Accu-Beads and their utility as a quality control (QC) product for manual and automated measurements of sperm concentration.
Materials and methods
Background
This was a single-center, observational study conducted in Greenville, South Carolina at a university hospital-based Assisted Reproductive Technology practice. We conducted this study between December 16, 2011 and September 15, 2013. Because no patient data were involved, this study did not require Internal Review Board approval.
Qualifications of laboratory personnel
Earlier investigations have reported variability among technicians [8]. By limiting the number of individuals responsible for assessing the various properties of semen analysis and ensuring that the andrologists are well trained in semen analysis, variability can be reduced [8–10]. We used two well-trained technicians for this study.
CASA information
The CASA used for this study was the Sperm Class Analyzer® (SCA; Version 5.1, Fertility Technology Resources, Inc., Marietta, GA). Our CASA consisted of a computer and monitor, a digital camera attached to a microscope, and a printer. We loaded Accu-Beads onto a MicroCell and placed the slide onto the microscope stage. Images of the beads were passed through the camera to a monitor and stored in the computer. Twenty-five digital images were captured per second. On the basis of a formulation that included depth of the chamber used, calibration of the system and specific algorithms, bead concentration was determined, or in the case of sperm, concentration and trajectory of individual sperm were determined.
The importance of reporting CASA parameter settings has been alluded to previously [11]. The parameter settings that we used for evaluating the Accu-Beads are listed below. A minimum of two samples, three fields per sample, and at least 200 beads were analyzed per Accu-Bead vial per day.
The standard parameter settings used with the SCA were as follows: frames acquired: 25; frame rate: 25; minimum contrast: not used in SCA, it automatically selects the best value; minimum size: 2; maximum size: 60; LO/HI size gates: not used in SCA; LO/HI intensity: not used in SCA; nonmotile head size: 2; and nonmotile brightness head intensity: not used in SCA. While not used to measure Accu-Beads, the following settings are still preset in the CASA program: medium path velocity (VCL): 35; low VCL value: 15; slow cells motile: 10; threshold straightness (STR): 80; number of points to calculate the VAP: 5; and minimum number of points: 10.
Procedure
Experiment 1
The stated concentrations of Accu-Beads on the vials were 35 ± 5 M/mL (Vial 1) and 18 ± 2.5 M/mL (Vial 2). A five-μL sample from a well-vortexed aliquot of each vial of beads was placed on a MicroCell counting chamber and allowed to settle. After the beads settled, we analyzed them via two methods: 1) manually with the use of a bright-field microscope and 2) computer automated semen analysis with the use of SCA. The MicroCell chambers were analyzed in duplicate and the duplicate results were averaged; therefore, each day of analysis produced two results for Vial 1 (one manual and one automated) and two results for Vial 2 (one manual and one automated).
Experiment 2
We used the same procedures as described in Experiment 1 except we utilized a different lot number of Low and High concentration Accu-Beads and we used a Standard Count fixed slide (Leja Products, The Netherlands) to determine if there were differences between lots of Accu-Beads as well as differences in counting chambers.
Definition and application of Westgard quality control rules
In 1981, Westgard and coworkers published a series of control rules that are now commonly referred to as “Westgard Rules” [6]. When used in combination with a Shewhart quality control chart (an X versus Y graph that demonstrates mean and standard deviation [SD] of repeated measurements of a control product), Westgard Rules provide a simple statistical procedure to determine whether observed control measurements represent stable or unstable performance of an analytical method. When used with a stable control material that is analyzed repeatedly over a long time, Westgard Rules can tell an investigator when an analysis method is “out of control” and when subsequent patient data should not be used by a physician to make diagnostic decisions.
Six quality control rules that we used to evaluate data are listed in Table 1. A minimum of two control rules should be used, one that detects random analytical error (error that occurs on both sides of the mean) and one that detects systematic error (error that occurs on only one side of the mean). This way, the control rule violated will indicate the type of error that arises and will aid in problem solving (or troubleshooting). Simultaneous use of several rules can improve performance of a test procedure and minimize false rejection of test results. The rules can be applied “within” a control material if only one level of control is run, or “across” control materials if two levels of control are run.
Table 1.
Definitions of Westgard quality control rules
| Control rule | Definition | Type of error detected |
|---|---|---|
| 12s | One control observation exceeds control limits set as the mean ± 2SD. This is the “warning” rule for a Shewhart chart signaling need for additional inspection of control data using additional control rules. | __ |
| 13s | A run is rejected when a single control measurement exceeds control limits set as the mean ± 3SD. This is the usual “action” or rejection limit on a Shewhart control chart. | Random |
| 22s | A run is rejected when two consecutive control measurements exceed the same limit, either the mean + 2SD or the mean–2SD. This rule can be applied “within” materials (consecutive observations on the same control material) or “across” materials (consecutive observations on different control materials). | Systematic |
| R4s | A run is rejected when the range or difference between two control observations within a run exceeds 4SD. In other words, one control observation exceeds a + 2SD limit and the second control observation exceed a–2SD limit for a total of 4SD difference between them. | Random |
| 41s | A run is rejected when four consecutive control observations exceed the same limit, which is the mean + 1SD or the mean–1SD. Consecutive observations can occur within one control material or across control materials. | Systematic |
| 10Mean | A run is rejected when 10 consecutive control observations fall on the same side of the mean. Consecutive observations can occur within one control material or across control materials. | Systematic |
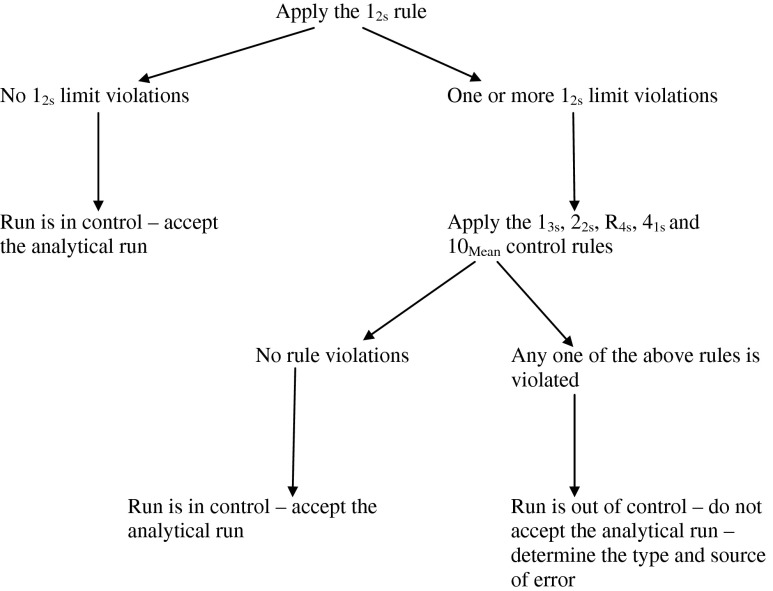
Figure 1 shows an algorithm for the order of application of Westgard Rules “across” two control levels. In practice, control materials are run at specified intervals (i.e., daily, at every shift change, with every batch of patient specimens) and results graphed on a Shewhart quality control chart. In this way, a large volume of data is readily available for inspection and the application of control rules can be easily accomplished.
Fig. 1.
Algorithm demonstrating the application of Westgard quality control rules across control materials
This simple statistical control procedure lends itself well to the control of Clinical Chemistry methods where, for example, the analyte being tested is glucose and a supply of stable glucose control material is readily available. However, in our case, we have a very stable method (the CASA plus the MicroCell), but the stability of control material (Accu-Beads) is in question and this is what we intend to investigate.
Statistics
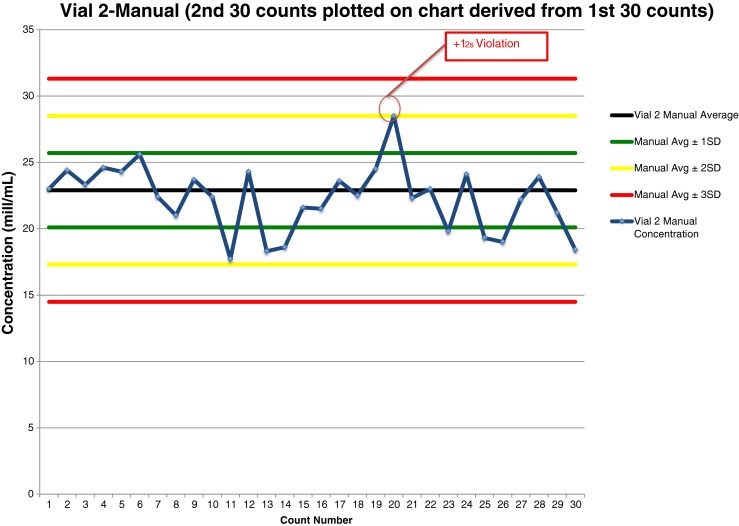
Two concentrations of beads (Vial 1 and Vial 2) were counted each day for 60 days. The first 30 results from each method of analysis (manual and CASA) were used to calculate means and standard deviations (SD). We used the means and SD to calculate mean ± 1 SD, mean ± 2 SD and mean ± 3 SD ranges (See Table 2).
Table 2.
From experiment 1–means, standard deviations (SD), mean ± 1, 2 and 3SD ranges, and confidence intervals (CI) calculated from the first 30 counts of two levels of Accu-Beads with the use of two different analysis methods
| Item | N | Mean (M/mL) | SD (M/mL) | ± 1SD range | ± 2SD range | ± 3SD range | CI |
|---|---|---|---|---|---|---|---|
| Vial 1–manual | 30 | 42.6 | 3.45 | 39.2–46.0 | 35.7–49.5 | 32.2–53.0 | 41.30–43.89 |
| Vial 1–CASA | 30 | 42.7 | 3.48 | 39.2–46.2 | 35.7–49.7 | 32.2–53.1 | 41.40–44.0 |
| Vial 2–manual | 30 | 22.9 | 2.81 | 20.1–25.7 | 17.3–28.5 | 14.5–31.3 | 21.85–23.95 |
| Vial 2–CASA | 30 | 22.8 | 2.21 | 20.6–25.0 | 18.4–27.2 | 16.2–29.4 | 21.98–23.62 |
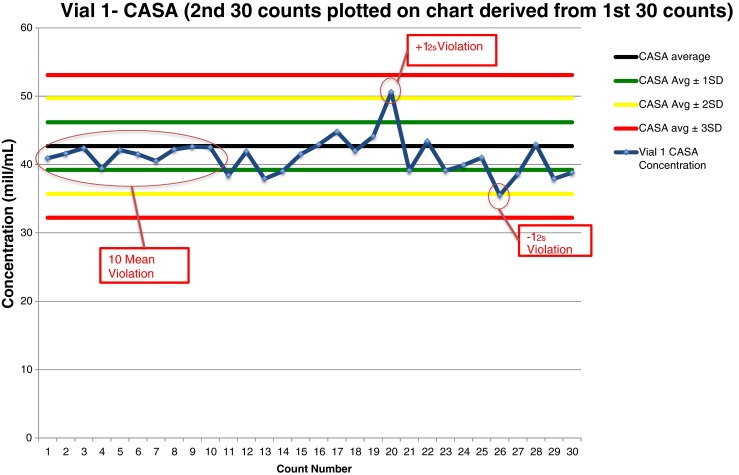
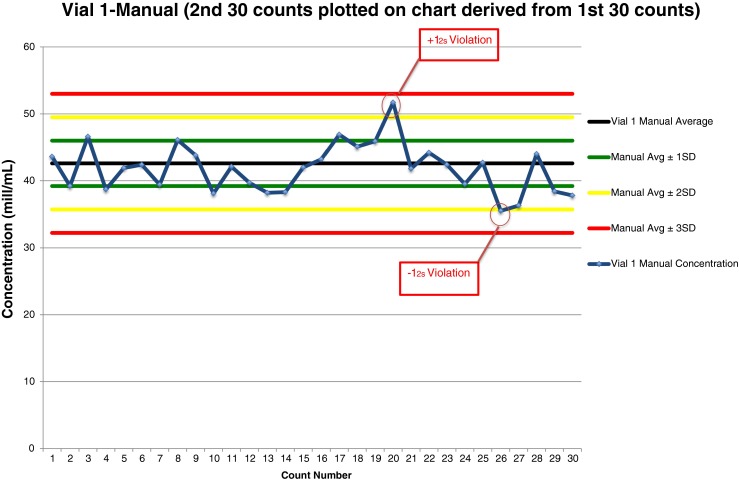
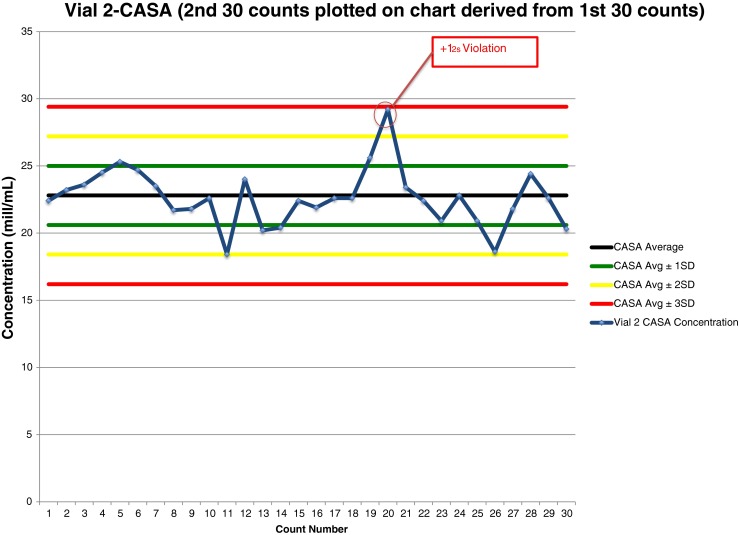
In Experiment 1, we used means, SDs, and SD ranges to construct Shewhart quality control charts for each Accu-Bead concentration and each analysis method (four charts). For the next 30 days, two concentrations (Vial 1–High and Vial 2–Low) of Accu-Beads were analyzed with the use of two methods (manual and CASA) and the averaged daily results were plotted on the appropriate control chart (see Figs. 2, 3, 4 and 5).
Fig. 2.
Shewhart quality control chart plotted with manual counts of Accu-Beads, Vial 1
Fig. 3.
Shewhart quality control chart plotted with CASA counts of Accu-Beads, Vial 1
Fig. 4.
Shewhart quality control chart plotted with manual counts of Accu-Beads, Vial 2
Fig. 5.
Shewhart quality control chart plotted with CASA counts of Accu-Beads, Vial 2
In Experiment 2, we used a similar approach to that of Experiment 1 except that we analyzed a different lot of the two concentrations of Accu-Beads. In addition, we used a different fixed counting chamber.
We used a t test to determine whether there was a significant difference (significance set at P < .05) between CASA and manual counts of high and low bead concentrations. We used a 95 % confidence interval to determine closeness of the relationship between our bead concentration values and those of the manufacturer. We used the “t test” command in Excel to calculate the t test and PEPI software version 4.0 was incorporated to calculate the 95 % confidence intervals. We produced the r2 values for the correlation between manual and CASA counts for Accu-Beads controls with the use of scatter-plot from SPSS Version 16.0. We did not make changes to the trial outcomes after the trial commenced nor did we conduct an interim analysis and thus we assessed these values at the end of the trial. No data were lost.
Results
Experiment 1
The means ± 1SD in M/mL for two vials of Accu-Beads analyzed by two different methods were as follows: Vial 1 CASA, 42.7 ± 3.48; Vial 1 Manual, 42.6 ± 3.45; Vial 2 CASA, 22.8 ± 2.21; and Vial 2 Manual, 22.9 ± 2.81 (Table 2). The CASA counts did not vary significantly from manual counts for Vial 1 (P = 0.876) or for Vial 2 (P = 0.592). The bead concentrations determined by the manufacturer for each vial (Vial 1, 35 ± 5 M/mL; Vial 2, 18 ± 2.5 M/mL) were below the 95 % confidence interval of the manual and CASA values we obtained (Table 2).
Experiment 2
When we used the MicroCell chambers, there was no difference between the manual and CASA methods when we evaluated Vial 1 (P = 0.67) or Vial 2 (P = 0.97) of the Accu-Beads (Table 3). A similar finding was observed when we used the Standard Count chambers to analyze the Accu-Beads (Vial 1, P = 0.44 and Vial 2, P = 0.32) When we compared the two counting chambers, there were significant differences between counts of Vial 2 Accu-Beads (P < 0.0001) for both manual and CASA counts. These same highly significant differences (P < 0.0001) appeared when we made similar comparisons using Vial 1 Accu-Beads.
Table 3.
From experiment 2–means and standard deviations (SD) of a second lot of Accu-Beads with the use of the MicroCell counting chamber and the Standard Count counting chamber
| Item | Method | N | Mean ± SD (M/mL) | P value |
|---|---|---|---|---|
| MicroCell | Manual | 30 | 21.1 ± 1.3 | 0.97 |
| CASA | 30 | 21.1 ± 1.3 | ||
| Manual | 30 | 41.5 ± 1.9 | 0.67 | |
| CASA | 30 | 41.7 ± 1.6 | ||
| Standard count | Manual | 30 | 17.9 ± 1.9 | 0.32 |
| CASA | 30 | 17.5 ± 1.2 | ||
| Manual | 30 | 37.4 ± 3.6 | 0.44 | |
| CASA | 30 | 36.9 ± 2.0 |
Samples counted manually and with a computer automated semen analyzer (CASA)
Furthermore, when we compared the manual method of counting the two different lots of Vial 2 Accu-Beads, the P value was 0.002. When we compared the CASA values for the same two lots of Vial 2 Accu-Beads, we found a P value of 0.0006. However, we did not find significant differences between the two lots of Vial 1 Accu-Beads when we counted them manually (P = 0.15) or with a CASA (P = 0.16).
Application of Westgard Rules to data plotted on QC charts
Experiment 1–lot 1 of Accu-Beads
Vial 1 manual data analysis of 30 Accu-Bead counts plotted on a QC chart (Fig. 2) revealed two rule violations. The 20th result and the 26th result violated the 12s rule; one result fell above the mean, the other fell below the mean.
Vial 1 CASA data analysis of 30 Accu-Bead counts plotted on a QC chart (Fig. 3) revealed three rule violations. The first 15 results all fell below the mean, a violation of the 10Mean rule. The 20th result and the 26th result violated the 12s rule; one result was above the mean, the other fell below the mean.
Vial 2 manual data analysis of 30 Accu-Bead counts plotted on a QC chart (Fig. 4) revealed one rule violation. The 20th result violated the 12s rule–the result was above the mean.
Vial 2 CASA data analysis of 30 Accu-Bead counts plotted on a QC chart (Fig. 5) revealed one rule violation. The 20th result violated the 12s rule–the result was above the mean.
For high and low Accu-Bead controls, the reported r2 correlation coefficients were .693 for the high bead concentration (Vial 1) and .749 for the low bead concentration (Vial 2). These correlation coefficients provide a modest degree of association between Accu-Beads controls counted by computer and manual methods.
Experiment 2–lot 2 of Accu-Beads
When we applied Westgard Rules to data obtained from the use of the MicroCell chambers, the only rule violation that occurred was the 12s “warning” rule. This occurred once for the Vial 1 manual method, twice for the Vial 1 CASA method, and twice for the Vial 2 manual method. There were no rule violations for the Vial 2 CASA method.
When we applied Westgard Rules to data obtained from the use of the Standard Count chambers, the only rule violation was the 12s rule. This occurred once for the Vial 1 manual method, once for the Vial 1 CASA method, twice for the Vial 2 manual method and once for the Vial 2 CASA method.
Discussion
In Experiment 1, we examined two known concentrations of Accu-Beads to determine their accuracy and precision as a quality control product and used Westgard Rules as criteria for acceptability. When we applied Westgard Rules to 30-days’ worth of Accu-Bead data graphed on QC charts, only one rule violation occurred that indicated the presence of systematic error in our QC method. This was the 10Mean rule violation that occurred when we analyzed Vial 1 of the Accu-Beads on the CASA. The cause of the systematic error could be slight day-to-day differences in the way the investigator handled and analyzed the Accu-Beads. For example, inadequate mixing of the beads pre-sampling or slight differences in the way the MicroCell chambers were loaded. Whatever the reason, the problem self-corrected and the Accu-Beads performed well during the rest of our investigation.
The only other rule violated was the 12s rule. This is the “warning” rule that signals the need for further inspection of QC data. In all instances, further data inspection revealed no other rule violations and, therefore, we would have accepted an analytical run. This indicates that, with the exception noted above, the Accu-Beads performed with acceptable precision and accuracy.
Four factors help determine the reliability of the analytical method chosen for semen analysis. They are 1) instrumentation, 2) counting chamber, 3) investigator variability, and 4) stability of control materials.
In our laboratory, CASA has proven to be a very stable instrument. On a daily basis, stored digital images are analyzed with the use of a constant set of analysis parameters. The CASA is so repeatable that results are virtually identical to the first digit to the right of the decimal point each day. In fact, semen analyses via CASA systems have proven to produce more reproducible results than the standard manual analyses [12].
We have previously demonstrated that the MicroCell chamber is the superior counting chamber for the determination of sperm concentration and motility used either with manual or CASA analysis [2]. In this study and as we previously reported [1], there was a high degree of correlation between manually and CASA-analyzed MicroCell chambers.
Variations in analysis technique among investigators can introduce large errors into an analysis process [3, 13, 14]. For a semen analysis, these errors may include mixing errors, dilution errors, chamber-filling errors, and other subtle differences that may contribute to method error. Studies in our laboratory [2] and previous performance testing of our laboratory personnel have demonstrated no differences among investigators. Laboratory personnel also participate in semi-annual proficiency testing where their performance in analyzing semen is compared not only to other andrologists within their own laboratory, but to andrologists in numerous other laboratories. Therefore, we feel this part of the analysis procedure is also stable.
Ideally, a semen-based control product should be used for QC of semen analyses. However, we previously investigated and reported on the unsuitability of one semen-based product, Semen CMC [7]. Although Semen CMC met many of the requirements of a good control material, in our hands, it proved too unstable for daily QC use. Also, Semen CMC needs to be stored in liquid nitrogen; this is an additional disadvantage for those laboratories that cannot meet this requirement.
Accu-Beads are an aqueous solution of latex beads that are similar in size to sperm heads. They are available in two known concentrations, are stored at room temperature and carry a long out-date. To ensure repeatability of results, andrologists must take care to mix vials of beads sufficiently before removing an aliquot for analysis. They must also securely re-cap vials to prevent evaporation of aqueous substrate, which would falsely elevate bead concentrations. The main disadvantage of Accu-Beads is that they do not allow for evaluation of motility.
We did discover differences between counting chambers and different lots of Accu-Beads. There appears to be a difference in fixed counting chambers that needs to be investigated. This is true regardless of the Accu-Bead concentrations. There also appears to be a difference in different lots of low concentration Accu-Beads, but not in the high concentration beads, which also should be studied further.
In Experiments 1 and 2, our average counts of both levels of Accu-Beads were consistently outside upper concentration ranges supplied by the manufacturer. This does not necessarily mean that the beads are an inferior QC material or that our methods of analysis are poor. What it does stress is how important it is for andrologists in each laboratory to develop acceptable QC ranges on the basis of performance of the QC material in their particular laboratory. Different methods of semen analysis are employed by individual laboratories and different algorithms are employed in different CASA systems, thus the data cannot be easily compared among laboratories [15, 16]. Furthermore, laboratory personnel should recalculate QC ranges periodically as additional QC data are collected.
The variation in technique among laboratory personnel can contribute to error in a routine semen analysis [3]. However, ensuring laboratory personnel are consistent and up-to-date with current semen analytical techniques provides, at least, some level of assurance that andrologists are performing measurements of sperm concentration correctly and in a similar manner [10, 17]. Accuracy and precision among andrologists with the use of Accubeads in a QC program adds another layer of assurance that andrology procedures are being performed correctly. Unfortunately, Accu-Beads only simulate concentration and provide no means of analyzing other properties of sperm. On the other hand, if manual and CASA analyses of beads are comparable, this provides assurance that either method is providing quality results [12, 16].
We use the manual method of measuring sperm concentration if the concentration is lower than 10 × 106/mL; however, for sperm concentrations greater than 10 × 106/mL in semen specimens without marked cellular debris, we use the CASA method of semen evaluation. Therefore, it is logical that a laboratory that employs a CASA should be prepared to perform semen evaluation with both methods and thus both methods of analyzing AccuBeads for semen analysis QC should be performed on a daily basis.
In conclusion, Accu-Beads meet enough of the requirements of a good control material to be acceptable for daily QC use in our laboratory. Used in conjunction with digital images stored on CASA to evaluate sperm motility, Accu-Beads are a valuable tool to ensure that our methods for measuring sperm concentration operate properly. Other andrologists should evaluate this product to insure that Accu-Beads can be used successfully in their laboratory environments.
Acknowledgments
Conflicts of interest
None of the authors has a conflict of interest.
Footnotes
Capsule
Accu-Beads can be used as a quality control material for manual and automated measurements of sperm concentration.
All funds for this research came from within the Medical Experience Academy and the Department of Obstetrics and Gynecology.
References
- 1.Johnson JE, Boone WR, Blackhurst DW. Manual versus computer-automated semen analyses. Part II. Determination of the working range of a computer-automated semen analyzer. Fertil Steril. 1996;65:156–159. doi: 10.1016/s0015-0282(16)58044-3. [DOI] [PubMed] [Google Scholar]
- 2.Johnson JE, Boone WR, Blackhurst DW. Manual versus computer-automated semen analyses. Part I. Comparison of counting chambers. Fertil Steril. 1996;65:150–155. doi: 10.1016/s0015-0282(16)58043-1. [DOI] [PubMed] [Google Scholar]
- 3.Álvarez C, Castilla JA, Ramírez JP, Vergara F, Yoldi A, Fernández A, et al. External quality control program for semen analysis: Spanish experience. J Assist Reprod Genet. 2005;22:379–387. doi: 10.1007/s10815-005-7461-2. [DOI] [PMC free article] [PubMed] [Google Scholar]
- 4.Mallidis C, Cooper TG, Hellenkemper B, Labians M, Uckert F, Nieschlag E. Ten years’ experience with an external quality control program for semen analysis. Fertil Steril. 2012;98:611.e4–616.e4. doi: 10.1016/j.fertnstert.2012.05.006. [DOI] [PubMed] [Google Scholar]
- 5.WHO laboratory manual for the examination and processing of human semen. 5th ed. Switzerland: World Health Organization; 2010.
- 6.Westgard JO, Barry PL, Hunt MR. A multi-rule Shewhart chart for quality control in clinical chemistry. Clin Chem. 1981;27:493–501. [PubMed] [Google Scholar]
- 7.Johnson JE, Blackhurst DW, Boone WR. Can Westgard quality control rules determine the suitability of frozen sperm pellets as a control material for computer automated semen analyzers? J Assist Reprod Genet. 2003;20:38–44. doi: 10.1023/A:1021262822705. [DOI] [PMC free article] [PubMed] [Google Scholar]
- 8.Baker HWG, Clarke GN. Sperm morphology: consistency of assessment of the same sperm by different observers. Clin Reprod Fertil. 1987;5:37–43. [PubMed] [Google Scholar]
- 9.Menkveld R, Stander FSH, Kotze TJVW, Kruger TF, van Zyl JA. The evaluation of morphological characteristics of human spermatozoa according to stricter criteria. Hum Reprod. 1990;5:586–592. doi: 10.1093/oxfordjournals.humrep.a137150. [DOI] [PubMed] [Google Scholar]
- 10.Ombelet W, Bosmans E, Janssen M, Cox A, Maes M, Punjabi U, et al. Multicenter study on reproducibility of sperm morphology assessments. Arch Androl. 1998;41:103–114. doi: 10.3109/01485019808987952. [DOI] [PubMed] [Google Scholar]
- 11.Davis RO, Katz DF. Standardization and comparability of CASA instruments. J Androl. 1992;13:81–86. [PubMed] [Google Scholar]
- 12.Krause W, Viethen G. Quality assessment of computer- assisted semen analysis (CASA) in the andrology laboratory. Andrologia. 1999;31:125–129. [PubMed] [Google Scholar]
- 13.Cooper T, Hellenkemper B, Nieschlag E. External quality control for semen analysis in Germany- Qualitakontrolle der Deutschen Gesellchaft fur Andrologie (QuaDeGA) the first 5 years. J Reprod Med Endocr. 2007;4:331–335. [Google Scholar]
- 14.Keel BA, Quinn P, Schmidt C, Jr, Serafy N, Jr, Seafry N, Sr, Schalue T. Results of the American Association of Bioanalysts national proficiency testing programme in andrology. Hum Reprod. 2000;15:680–686. doi: 10.1093/humrep/15.3.680. [DOI] [PubMed] [Google Scholar]
- 15.Mortimer S, Swan M. The development of smoothing-independent kinematic measures of capacitating human sperm movement. Hum Reprod. 1999;14:986–996. doi: 10.1093/humrep/14.4.986. [DOI] [PubMed] [Google Scholar]
- 16.Hu A, Lu JC, Shao Y, Huang YF, Lu NQ. Comparison of semen analysis results obtained from two branded computer-aided sperm analysis systems. Andrologia. 2012;1–4. [DOI] [PubMed]
- 17.Mortimer D, Shu MA, Tan R. Standardization and quality control of sperm concentration and sperm motility counts in semen analysis. Hum Reprod. 1986;1:299–303. doi: 10.1093/oxfordjournals.humrep.a136409. [DOI] [PubMed] [Google Scholar]


