Abstract
In 2012, the Quality-by-Design and Product Performance Focus Group of AAPS conducted a survey to assess the state of adoption and perception of Quality-by-Design (QbD). Responses from 149 anonymous individuals from industry—including consultants—(88%), academia (7%), and regulatory body (4%), were collected. A majority of respondents (54% to 76%) reported high frequency of utilization of several tools and most QbD elements outlined by International Conference on Harmonization Q8, with design of experiments, risk assessment, and the quality target product profile ranked as the top three. Over two thirds of respondents agreed that the benefits of QbD included both the positive impact it can have on the patient (78%), as well as on internal processes such as knowledge management (85%), decision making (79%), and lean manufacture (71%). However, more than 50% from industry were neutral about or disagreed with QbD leading to a better return on investment. This suggests that, despite the recognized scientific, manufacture, and patient-related benefits, there is not yet a clearly articulated business case for QbD available. There was a difference of opinion between industry and regulatory agency respondents as to whether a QbD-based submission resulted in increased efficiency of review. These contrasting views reinforce the idea that QbD implementation can benefit from further dialog between industry and regulatory authorities. A majority of respondents from academia indicated that QbD has influenced their research. In total, the results indicate the broad adoption of QbD but also suggest we are yet in a journey and that the process of gathering all experience and metrics required for connecting and demonstrating QbD benefits to all stakeholders is still in progress.
KEY WORDS: ICH, QbD, QbD business case, QbD implementation, QbD principles, quality by design, survey, clinically relevant specifications
INTRODUCTION
This report contains the results of the quality-by-design (QbD) survey conducted in 2012 by the QbD and Product Performance Focus Group of AAPS. The questions posed by this survey aimed to assess the current state of adoption and perception of QbD. There were three main questionnaire parts. The first part probed the frequency of utilization of various QbD tools and elements, such as the quality target product profile, risk assessments, control strategies, and other. The second part sought to rank the motivators of the application QbD, such as product/process understanding, regulatory flexibility, and others. Finally, the third part prompted the respondent to identify the benefits of the application of QbD, such as return on investment and knowledge management. This article includes some background on QbD, the survey questions, a statistical summary of the multiple-choice responses, a transcription of some open ended statements, and the authors’ interpretation of the results.
BACKGROUND
QbD is a regulatory-driven approach advocating systematic product development “that begins with predefined objectives and emphasizes product and process understanding and process control, based on sound science and quality risk management” (1). The International Conference on Harmonization (ICH), now called Harmonization for Better Health, has issued four guidelines (1–4) and related Questions and Answers and Implementation documents(5–7) that provide a general framework for the application of QbD to drug product and drug substance development and manufacture, ICH Q8(R2) (1), Q9 (2), Q10 (3), and Q11(4). In particular, ICH Q8(R2), issued in 2005 and revised in 2009, outlines and defines the main elements of the QbD framework.
Six main elements are: (1) quality target product profile (QTPP) which is a prospective summary of the quality characteristics of the drug product that ideally will be achieved to ensure the desired quality, taking into account safety and efficacy; (2) critical quality attributes (CQAs) which are the material characteristics (of drug substance, excipients, intermediates, and drug product) that must be within an appropriate limit, range or distribution to ensure product quality; (3) risk assessment (RA) which is used to identify and link material attributes and process parameters to the drug product CQAs: RA can be used to guide the design of the product, the development of the manufacturing process, the establishment of the Control Strategy (CS), and other aspects of lifecycle management; (4) design space (DS) is the combination of material attributes and process parameters that have been demonstrated to provide assurance of quality—as per the guidance, movement within the DS is not a change and would not require a post-approval change process: The possibility of moving within a pre-established design space without the need for additional submission offers the promise of greater regulatory flexibility relative to the traditional, non-QbD approach; (5) control strategy (CS) is a set of materials and process controls that maintain the product and process operating within the DS and thus provide assurance that the product meets its QTPP; (6) life cycle management to ensure continual improvement and continuous process verification from initial development through marketing until product discontinuation.
The Q8 guideline delineates the difference between “minimal” or traditional and “enhanced” or QbD approaches to pharmaceutical development. The latter, includes, for example, a mechanistic understanding of the relationship between material attributes, process parameters, and product CQAs (CMA-CPP-CQA) and the utilization of tools such as design of experiments (DOE)(8) and process analytical technologies (PAT) (8,9). Implicit in the enhanced approach is the concept of connecting the QTPP to the CS, here deemed QTPP-to-CS relationship, to ensure that target quality is met consistently in production. In addition to the elements and tools mentioned above, more recent concepts have emerged that aim to incorporate biopharmaceutical performance considerations, into quality criteria (10,11), referred to here as clinically meaningful/relevant specifications (Clin Rel Specs). Biopharmaceutical product performance matters because in many cases it is used as a surrogate of safety and efficacy. The development of clinically relevant specifications, in principle, requires in depth understanding of the mechanism of in vivo drug release/absorption or the elucidation of in vivo in vitro correlations (IVIVC) (10,12). These correlations between in vitro dissolution measurements and in vivo pharmacokinetic data could be used to map a space connecting critical quality attributes/process parameters with biopharmaceutical performance, here this space is called “biopharmaceutics design space”. The first part of this survey was designed to assess the frequency of utilization of various ICHQ8 elements as well as the tools and other concepts listed above, here abbreviated as QTPP, RA (Product RA, Process RA, CS RA, lifecycle RA), the CQA DS, the CS, QTPP to CS, CMA-CPP-CQA, DOE, PAT, IVIVC for biopharmaceutics DS, and Clin Rel Specs. The goal was to help understand the extent of adoption of QbD.
The application of QbD to product development, manufacture, and registration is not mandatory. As per the Food and Drug Administration’s Manual of Policies and Procedures 5016.1, “QbD approaches as described by ICH Q8(R2) are encouraged”(13). Despite the non-mandatory nature of QbD, this approach has shown signs of adoption, for example, in 2012 (post-survey), the US agency reported a total count of 70 “QbD” new drug applications since 2005 (14). The second part of this survey was designed to rank the relative importance of potential motivators of QbD, ranging from regulatory to patient drivers. The goal was to better understand why institutions apply QbD.
Furthermore, the implementation of QbD requires transformational changes within an institution affecting its internal culture and work processes (15). The business case for the implementation of these changes has been a topic of much recent discussion as exemplified in Kourti and Davis (16). The third part of this survey was designed to identify the main benefits of QbD, ranging from potentially tangible ones, such as return on investment and gained efficiencies, to less tangible ones, such as decision making and knowledge management. The goal was to help understand how QbD is perceived.
Two other prior QbD surveys were published in 2012. One of the surveys (16) was published by the International Society of Pharmaceutical Engineering (ISPE) and contains the views of 12 pharmaceutical companies including biotech companies whom were polled mainly via written or verbal interviews with representatives who spoke or wrote responses on behalf of their institutions between November 2011 and September 2012. The responses are presented as a listing of statements from companies’ representatives without statistics. The testimonials collected by ISPE indicate there are numerous recognized benefits of QbD including product and process understanding, improved internal processes, and leaner manufacturing, but they also indicate concern about the regulatory submission process, brought about by lack of harmonization of and clarity of expectations. ISPE also reports statements about QbD-driven cost savings, production yield increases, and “zero atypical,” but only one provides dollar figures. The other survey (17) was conducted by BioProcess International in August 2011 and contains the statistical analysis of responses of 193 professionals exclusively from biopharmaceutical manufacturing companies. This survey of biotech company professionals also shows recognition for the potential benefits of QbD, such as improved process understanding and connections to quality outcomes as per approximately 85% and 65% of respondents, respectively, but indicates their concern about roadblocks to implementation such as up-front cost of QbD and poor understanding of return on investment, both picked by nearly 50% of the participants.
The AAPS survey subject of this publication differs from ISPE’s and Bioprocess’ in that it collected the anonymous, individual views of professionals in three pharmaceutical sectors, industry, agency, and academia. Unlike the ISPE survey, the responses are analyzed quantitatively to provide statistical rankings and correlations. In addition, this AAPS survey probes newer concepts, not mentioned in the ICH documents, such as clinically relevant specifications and biopharmaceutical design space, to help assess the extent of integration of product performance criteria and QbD. Finally, this survey includes unique questions aimed to understand the perceived importance of less tangible, but desired, outcomes of QbD, such as improved patient benefit, better knowledge management, and more transparent decision making.
METHODS
Questions for the survey were developed through several rounds of discussion with members of the steering committee of the Quality-by-Design and Product Performance Focus Group of AAPS. No further formal testing was done prior to its subsequent use. The members involved in the discussions represented the target audience as there were representatives from industry, academia, regulatory agencies, and consultants to the pharmaceutical industry. The survey questionnaire contained three parts, corresponding to the three categories specified above in the “BACKGROUND,” which were presented with multiple choice answers. There was opportunity for the respondent to make open-ended statements. The survey questionnaire is presented in the Appendix. This survey participation request was sent with a web link to all members of the QbD and Product Performance Focus Group, as well as to all members of the Manufacturing Sciences and Engineering and the Regulatory Sciences Sections of AAPS. The survey link could be accessed by non-AAPS members, thus the results may include the views of respondents outside the mentioned focus group and sections (Figs. 1 and 2). The survey remained open for approximately 2 months starting on July 10th and ending on October 6th, 2012. The results of the survey were collected by VOVICI™.
Fig. 1.
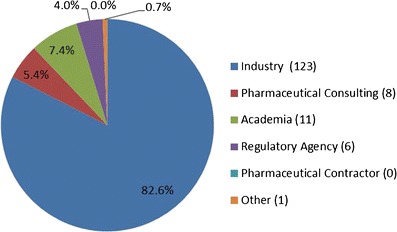
Affiliation demographics of the 2012 AAPS QbD survey participants
Fig. 2.
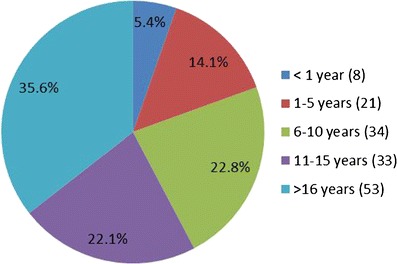
Experience demographics of the 2012 AAPS QbD survey participants
An analysis was done to investigate the correlation between the use of the different QbD elements and tools using Spearman's rank correlation coefficient using R© version 2.15.2 (2012 The R Foundation for Statistical Computing) shown in Fig. 3.
Fig. 3.
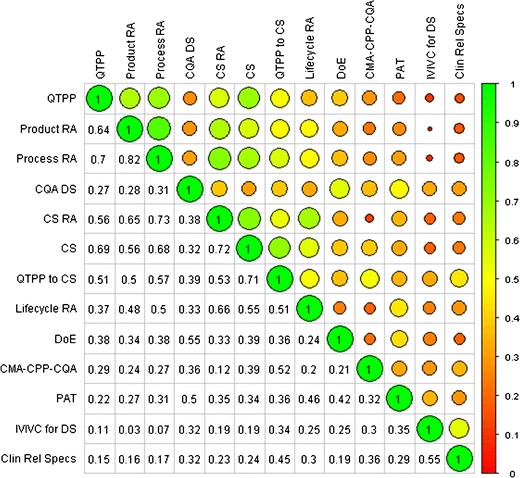
Correlation Matrix for use of QbD elements or tools. Numbers in cells or size (the larger the circle, the more highly correlated) and color of circles represent Spearman’s rank correlation coefficient for each row/column pair. QTPP = quality target product profile; RA = risk assessment; CQA = critical quality attribute; CQA DS = design space for CQAs; CS = control strategy; CSRA = risk assessment to guide CS; QTPP to CS = QTPP to CS relationship; Lifecycle RA = RA to guide lifecycle management; DoE = design of experiment; CMA-CPP-CQA = mechanistic understanding of critical material attributes-critical process parameters-CQA relationships; PAT = process analytical technology; IVIVC = in vitro/in vivo correlation; IVIVC for DS = IVIVC for better understanding of biopharmaceutics design space; Clin Rel Specs = clinically relevant specifications
SURVEY RESULTS AND DISCUSSION
There were a total of 149 individual anonymous respondents from across pharmaceutical private sector, regulatory agencies, and academia. As shown in Fig. 1, the respondents identified their primary work affiliation as follows: pharmaceutical industry—including consultants—134 (88%), with industry alone 123 (83%) and pharmaceutical consulting, 8 (5%); academia, 11 (7%); regulatory agencies, 6 (4%); pharmaceutical contractors, 0%; and other, 1 (1%). As per Fig. 2, the majority of the respondents, 58%, declared to be associated with their primary work affiliations for more than 10 years; 22% of the respondents stated to have been with their affiliation between 6 and 10 years while 14% and 5% had been affiliated between 1 and 5 years and less than 1 year, respectively. Review and computation of the raw data show that only 14 of the 123 industrial respondents have been employed less than 6 years. These demographics show that, although the survey was available to scientists of all levels and affiliations, the responses contain a highly predominant (70%) industrial perspective from experienced employees. While most respondents answered each of the multiple choice questions, there were only 31 comments entered in the open-ended comments. There appeared to be no consistent themes among these comments and most echoed the response to the questions.
The survey questions and results are presented below in three section parts corresponding to the three question categories (1): “Frequency of Application of QbD Tools” (2), “Motivators of the Application of QbD” (3), and “Benefits of the Application of QbD.” These sections also include data discussion and the authors’ interpretation of the results.
Frequency of Application of QbD Tools
Results for the frequency of application of QbD tools are in Table I. The number of respondents to this section of the survey ranged from 144 to 150. The overall results tabulated below are similar to the results obtained when considering only respondents from the pharmaceutical industry.
Table I.
Frequency (% by Category) of Use of Quality by Design in Response to the Question “How Often Do You Employ the Following QbD Elements/Tools?”
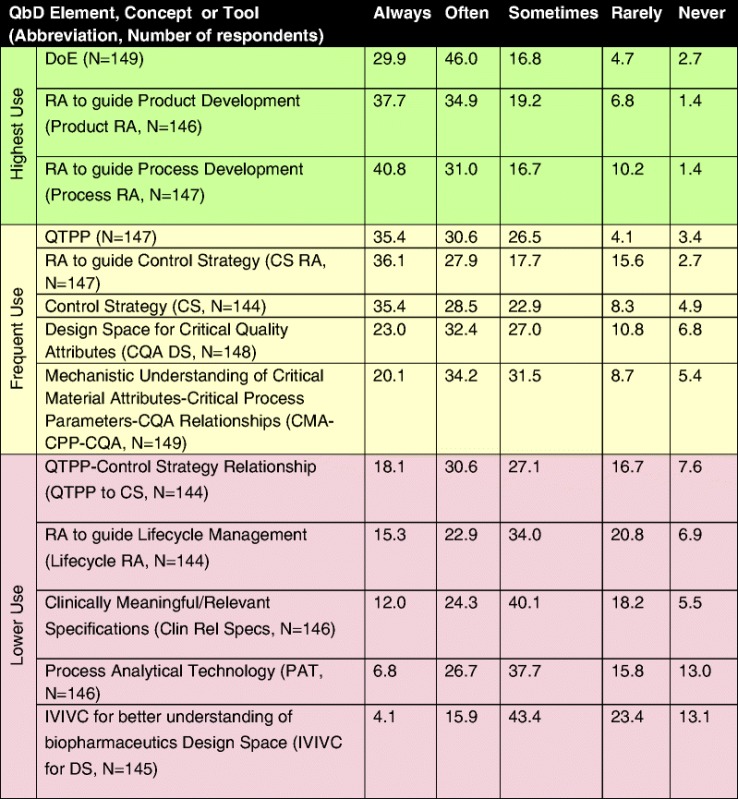
Table is color-coded with respect to frequency of use: highest use (green) where >70% of respondents indicated that the tool was either always or often used, frequent use (yellow) where 50% to 70% of respondents indicated that the tool was either always or often used, and occasionally use (purple) where <50% of respondents indicated that the tool was either always or often used
DoE design of experiment, RA risk assessment, QTPP quality target product profile, CS control strategy, CQA critical quality attribute, CMA critical material atributes; DS design space, CPP critical process parameters, PAT process analytical technology, IVIVC in vitro/in vivo correlation
The tools in the highest use group included DoE (76%), RA for product development (73%), and risk assessment for process development (72%), followed by QTPP (66%), CS (64%), and DS (55%). In general, risk assessment was one of the most frequently used elements regardless of the application as risk assessment for control strategy approached the highest use category (66%); however, its application with respect to lifecycle management still remains only occasionally used (38%). Those elements or tools with the lowest frequency of use (<50% of respondents use them always or often) tended to be ones that delineate a relationship between laboratory and clinical product performance (QTTP–control strategy relationship, clinically relevant specifications, and IVIVC for biopharmaceutical design space). In the authors’ opinion, this may reflect the difficulty in obtaining the information needed to create these relationships. In addition or alternatively, this may reflect the fact that they and their applications in the context of QbD are relatively new concepts. Surprisingly, PAT also falls in the occasional-use category (with 38% of the respondents reporting that they apply it only sometimes and 34% always or often). In sum, the top three QbD tools and elements are DoE, risk assessment to guide product, and process development (between 70% and 76%), followed by QTPP, risk assessment to guide control strategy, control strategy itself, CQA design space, and mechanistic understanding of critical material attributes/critical process parameters/CQA relationships (this group between 54% to 64% always or often used). Results of the analysis to investigate the correlation between the use of the different elements, concepts, and tools are presented in Fig. 3. QTPP, Product, Process, and Control Strategy Risk Assessments and Control Strategy tended to be both frequently used (>50% of respondents indicating at least frequent use) and the most highly correlated (correlation >50%). Thus, there is evidence of the integrated application of most of the QbD elements outlined by the ICH Q8 framework (1) namely, QTPP, risk assessments, and control strategy. Another main ICH Q8 element, DS, shows weaker correlation (<40%) with the other three elements, QTPP, RA, and CS, suggesting a QbD approach may utilize QTPP, RA, and CS but not necessarily DS. (Note that there was no question in the survey about the other ICH-element, lifecycle management strategy, per se). Not surprisingly, DS shows higher correlation (55%) with DoE, indicating that DOE is commonly used to define DS. DOE, in turn, while being the most frequently used tool, does not correlate as strongly with QTPP, RA, and CS, suggesting that not all QbD development resorts to DOEs or simply that some DOEs are executed independently from QTPPs, RA, and CS. Similarly, the weaker correlation (<50%) between PAT and other elements and tools indicate that holistic QbD does not always include the application of process analytics technology. The IVIVC and Clin Rel Specs pair show a stronger correlation (55%), indicating these are used together.
In sum, the data generally show the broad utilization of all the QbD elements, those explicitly mentioned in ICH Q8 and newer ones, as only one tenth to one third of the respondents stated that they never or rarely used a given element or tool. Furthermore, there is evidence that QTPP, RA, and CS are used in an integrated fashion, with DS integrated to a lesser extent. It is worth mentioning that some respondents noted that they worked in early development and could not use the full set of elements because of the lack of clinical data necessary to use some of the concepts or tools.
Motivators of the Application of QbD
Results for the motivators of the application of QbD tools portion of the survey are summarized in Table II. The number of respondents to this section of the survey ranged from 144 to 147. The overall results tabulated below are similar to the results obtained when considering only respondents from the pharmaceutical industry (analyses not included).
Table II.
Ranking (% by Category) of Motivators of the Application of Quality by Design in Response to “Rank the Importance of the Following as Motivators of the Application of QbD from your Standpoint?”
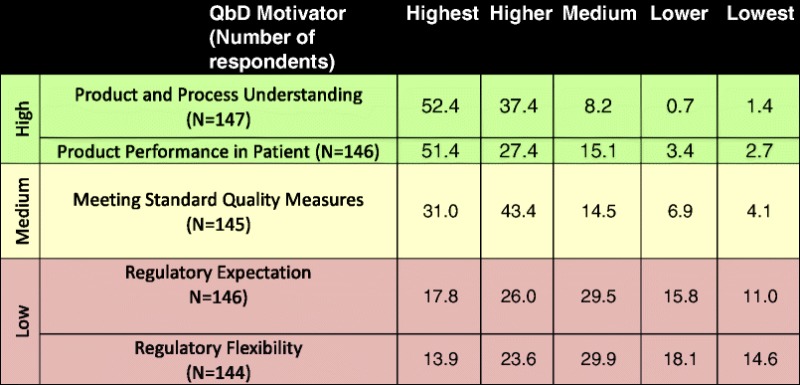
Table is color-coded with respect to the motivators of application of QbD,: high motivation (green) where >75% of respondents indicated that the motivator was either “higher” or “highest”; medium motivation (yellow) where 50% to 75% of respondents indicated that the motivator was either “higher” or “highest”; and low motivation (purple) where <50% of respondents indicated that the motivator was either “higher” or “highest”
The high motivators include product and process understanding and product performance in patients, where high motivators are those selected by >75% of respondents. Application of QbD to meet standard quality measures falls under the medium motivator category, where medium motivators are those selected by 50% to 75% of the respondents. Both regulatory expectation and regulatory flexibility are low motivators for application of QbD, where low motivation is assigned to those selected by <50% of the respondents. These results suggest that the main driver to apply QbD is not an expectation from the regulators or a benefit such as regulatory flexibility but rather the desire to improve product and process understanding and product performance in patients. Some of the specific comments in response to the open-ended question from this survey reinforce these conclusions, “…understanding the basis for product performance will help you design better products, which one hopes will work better in a broader range of patients”; “Increased process/product understanding through QbD may allow for development of lower cost product in low income populations, leading to increased access”; and “QbD enables a better understanding of the technology and its operations, this may allow for more flexible and personal medicine to become available to the public in the near future”.
Benefits of the Application of QbD
The number of respondents to this section of the survey ranged from 119 to 150 for the questions with application to the entire sample population. There were six regulatory and 46 industrial respondents for the regulatory-specific question and 11 respondents for the academia-specific question. Results from this portion of the survey are summarized in Table III.
Table III.
Perceived (% by Category) Benefits of the Application of Quality by Design in Response to “When Comparing to a Traditional Paradigm, Indicate How You Agree or Disagree with the Following Statements”
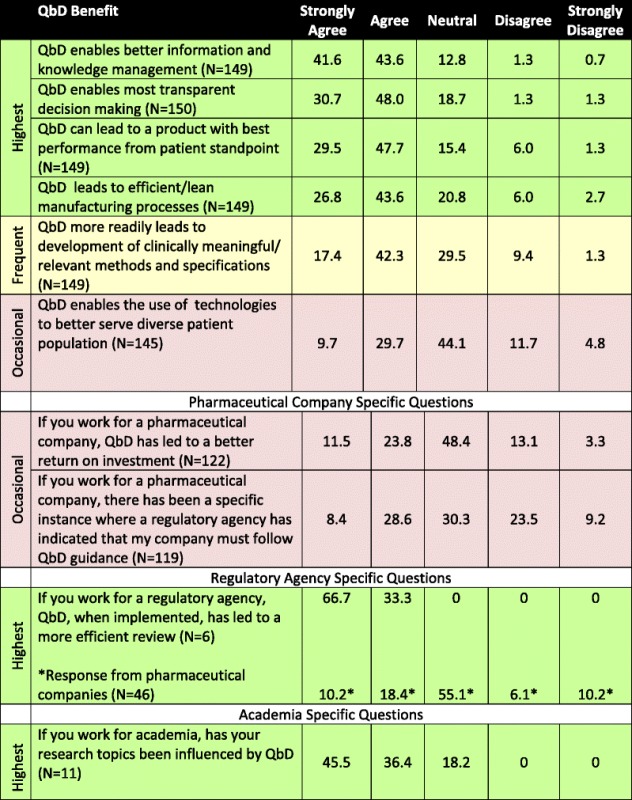
Table is color-coded with respect to degree of motivation: highest benefit where >70% of respondents indicated that they agreed or strongly agreed with the statement (green); frequent benefit where 50% to 60% of respondents indicated that they agreed or strongly agreed with the statement (yellow), and occasional benefit where <50% of respondents indicated that they agreed or strongly agreed with the statement (purple)
Over two thirds of respondents agreed or strongly agreed that the benefits of QbD include both the positive impact it can have on the patient (78%), as well as on internal processes such as knowledge management (85%), decision making (79%), and lean manufacturing practices (70%). These benefits were also reflected in the majority of the 22 responses to the open question “If you agree with QbD enables the use of technologies to better serve diverse patient populations, indicate how so“. An additional theme of some of the responses to the open-ended question was that a QbD culture can enable the innovation and development of new technologies that focus on better patient care and patient needs. When asked the question if QbD more readily leads to development of clinically meaningful or relevant methods and specifications, 60% agreed or strongly agreed and approximately 30% were neutral with only 10% disagreed or strongly disagreed. When asked if QbD enables the use of technologies to better serve diverse patient population, approximately 40% agreed or strongly agreed, 16% disagreed or strongly disagreed, and 44% were neutral. The authors speculate that the predominantly neutral responses might reflect the nascent nature of the concept of QbD as enabler of new technologies for diverse patient populations and/or the limited current practical association between the two. Similarly, when asked if QbD led to a better return on investment, a large number, 48%, responded neutral. In this latter case, the neutral responses might reflect the lack of available dollar figures to prove or disprove the statement on return on investment—to the authors’ knowledge, this type of data has not been published. From this, one may speculate that, despite its many recognized benefits, the business case for QbD is not clear or obvious to most, or there is insufficient data to definitively calculate it. This suggests that a clearly articulated case that connects and demonstrates the impact to all stakeholders is not yet available.
Those participants working for a regulatory agency agreed or strongly agreed unanimously that, when implemented, QbD has led to a more efficient review; however, 55% of the industry participants responded with a neutral score, with 29% agreeing or strongly agreeing and 16% disagreeing or strongly disagreeing. The difference of opinion between industrial and agency respondents is worth noting as it suggests that implementation of QbD could benefit from continued dialog between regulatory authorities and the industry. Furthermore, this is consistent with statements in the aforementioned ISPE survey which highlights that QbD advancement depends on building relationships between industry and regulators. When academicians were asked if their research topics were influenced by QbD, greater than 80% responded that it did.
In summary, it is clear that the industry, agency, and academia view QbD as beneficial, in terms of the positive impact it can have on the patient as well as on internal processes such as knowledge management, decision making, lean manufacturing in industry, review efficiency within regulatory agency, and choice of research topic in academia.
Despite the different questions and methods of collecting and reporting data and target participant audience, there are commonalities in the responses to this and the aforementioned recent surveys (16,17); the most important being that above all, QbD has been embraced mainly as a matter of principle and less so because of tangible regulatory and business returns.
CONCLUSIONS
A majority of respondents reported high frequency of utilization of several tools and most QbD elements outlined by ICH Q8. Over two thirds of respondents from industry agreed that the benefits of QbD included both the positive impact it can have on the patient, as well as on internal processes. However, those from industry did not agree that QbD leads to a better return on investment. This suggests that there is not yet a clearly articulated business case for QbD, despite the recognized scientific, manufacture, and patient benefits. There was a difference of opinion between industry and regulatory agency respondents as to whether a QbD-based submission resulted in increased efficiency of review with nearly 50% of respondents from industry giving a neutral response while all respondents from regulatory agencies either agreed or strongly agreed with the statement. These contrasting views reinforce the idea that QbD implementation can benefit from further dialog between industry and regulatory authorities. A majority of respondents from academia indicated that QbD has influenced their research. In total, the results indicate the broad adoption of QbD but also suggest we are yet in a journey and that the process of gathering all experience and metrics required for connecting and demonstrating QbD benefits to all stakeholders is still in progress.
ACKNOWLEDGMENTS
The authors wish to thank Paul Dickinson and Arzu Selen for their insightful contributions to the design of the survey questionnaire. We are also grateful to the members of the QbD and Product Performance Focus Group Steering Committee for review of this manuscript. Finally, we would like to thank AAPS staff, especially Maria Nadeau, and the leadership of the Manufacturing Science and Engineering (MSE) and Regulatory Sciences (RS) sections of AAPS for their support of this survey.
Appendix: QbD Survey Questions
1. Identify your primary work affiliation
Academia
Pharmaceutical Industry
Pharmaceutical Consulting
Regulatory Agency
Pharmaceutical Contractor
Other
2. How many years with your primary work affiliation?
<1
1–5
6–10
11–15
>16
3. How often do you employ the following QbD elements/tools?
Quality Target Product Profile (QTPP)
Risk Assessment to guide product development
Risk Assessment to guide process development
Risk Assessment to guide control strategy
Risk Assessment to guide lifecycle management strategy
Design Space for critical quality attibutes (CQAs)
Control strategy
Relationship of Control strategy to QTPP
Mechanistic understanding between critical material attributes, critical process parameters, and critical quality attributes
Design of Experiment (DoE)
Process Analytical Technology (PAT)
Clinically Meaningful/Relevant Specifications
In vitro/in vivo correlation for better understanding of biopharmaceutics design space
Respondents had the following choices for each of the above QbD elements/tools:
Never
Rarely
Sometimes
Often
Always
Respondents also had the opportunity to add open text to provide additional information on the above QbD elements/tools.
4. Rank the importance of the following as motivators of the application of QbD from your standpoint.
Product performance in the patient
Meeting standard quality measures
Product/process understanding
Regulatory flexibility
Regulatory expectation
Respondents ranked each of the above relative to each of the other list items (e.g., from highest to lowest).
5. Indicate how you agree or disagree with the following statements.
As compared with a traditional paradigm, QbD can lead to a product with best performance from patient standpoint
As compared with a traditional paradigm, QbD leads to efficient/lean manufacturing processes (i.e., shorter cycle times, fewer discards, lower inventories and cost)
QbD enables better information and knowledge management
QbD enables most transparent decision making
As compared with a traditional paradigm, QbD more readily leads to development of clinically meaningful/relevant methods and specifications
If you work for a pharmaceutical company: From your perspective, QbD has led to a better return on investment
If you work for a pharmaceutical company: There has been a specific instance where a regulatory agency has indicated that my company must follow QbD guidance
If you work for a regulatory agency: QbD, when implemented, has led to a more efficient review
If you work for academia, have your research topics been influenced by QbD needs for better in vitro and/or in silico and/or statitical and/or analytical tools for development and control
QbD enables the use of technologies to better serve diverse patient populations
Respondents could answer each of the above with one of the following:
Strongly agree
Agree
Neutral
Disagree
Strongly agree
Respondents could also enter open text regarding the following statement: If you agreed with the above statement “QbD enables the use of technologies to better serve diverse patient populations“, please indicate how so.
REFERENCES
- 1.Guidance for Industry Q8 (R2) Pharmaceutical development, November 2009(ICH Q8 (R2)) Available at: http://www.ich.org/fileadmin/Public_Web_Site/ICH_Products/Guidelines/Quality/Q8_R1/Step4/Q8_R2_Guideline.pdf Accessed June 6, 2013
- 2.Guidance for Industry Q9 Quality Risk Management, June 2006 (ICH Q9) Available at: http://www.fda.gov/downloads/Drugs/GuidanceComplianceRegulatoryInformation/Guidances/ucm073511.pdf Accessed September 23, 2013
- 3.Guidance for Industry Q10 Pharmaceutical Quality Systems, April 2009 (ICH Q10) Available at: http://www.fda.gov/downloads/Drugs/GuidanceComplianceRegulatoryInformation/Guidances/ucm073517.pdf Accessed September 23, 2013
- 4.Guidance for Industry Q11 Development and Manufacture of Drug Substances (ICH Q11) November 2012 (ICH Q11) Available at: http://www.fda.gov/downloads/drugs/guidancecomplianceregulatoryinformation/guidances/ucm261078.pdf Accessed September 23, 2013
- 5.Quality Implementation Working Group on Q8, Q9 and Q10 Questions & Answers (R4), November 11, 2010 http://www.ich.org/fileadmin/Public_Web_Site/ICH_Products/Guidelines/Quality/Q8_9_10_QAs/Q-IWG_QAs_Step4/Q8_Q9_Q10_Question_and_Answer_R4_step_4_November_2010.pdf Accessed September 9, 2013
- 6.ICH Quality Implementation Working Group Points to Consider (R2), ICH-Endorsed Guide for ICH Q8/Q9/Q10 Implementation, December 2011. Available at: http://www.ich.org/fileadmin/Public_Web_Site/ICH_Products/Guidelines/Quality/Q8_9_10_QAs/PtC/Quality_IWG_PtCR2_6dec2011.pdf Accessed September 9, 2013
- 7.Guidance for Industry Q8, Q9 & Q10 Questions and Answers-Points to Consider for Q8, Q9 and Q10, July2012. Available at: http://www.fda.gov/downloads/Drugs/GuidanceComplianceRegulatoryInformation/Guidances/UCM313094.pdf Accessed September 9, 2013
- 8.Guidance for Industry PAT-A Framework for Innovative Pharmaceutical Development, Manufacturing, and Quality Assurance, September 2004, http://www.fda.gov/downloads/drugs/guidancecomplianceregulatoryinformation/guidances/ucm070305.pdf Accessed September 23, 2013
- 9.Korakiantini E, Rekkas D. Statistical Thinking and Knowledge Management for Quality Driven Design and Manufacturing in Pharmaceuticals. Pharm Research. 2011;28:1465–1479. doi: 10.1007/s11095-010-0315-3. [DOI] [PubMed] [Google Scholar]
- 10.Dickinson P, Lee W, Stott P, et al. Clinical Relevance of Dissolution Testing in Quality by Design. AAPS J. 2008;10(2):280–290. doi: 10.1208/s12248-008-9034-7. [DOI] [PMC free article] [PubMed] [Google Scholar]
- 11.Selen A, Cruañes MT, Mullertz A, et al. Meeting Report: Applied Biopharmaceutics and Quality by Design for Dissolution/Release Specification Setting: Product Quality for Patient Benefit. AAPS J. 2010;12:465–472. doi: 10.1208/s12248-010-9206-0. [DOI] [PMC free article] [PubMed] [Google Scholar]
- 12.Guidance for Industry, Extended Release Oral Dosage Forms: Development, Evaluation , and Application of In Vitro/In Vivo Correlations, September 1997 http://www.fda.gov/downloads/drugs/guidancecomplianceregulatoryinformation/guidances/ucm070239.pdf Accessed September 23, 2013 [DOI] [PubMed]
- 13.Manual of Policies and Procedures, MAPP 5016.1, Applying ICH Q8(R2), Q9, and Q10 Principles of CMC Review, February 2011, http://www.fda.gov/downloads/aboutfda/centersoffices/officeofmedicalproductsandtobacco/cder/manualofpoliciesprocedures/ucm242665.pdf Accessed September 23, 2013
- 14.Miksinski SP. Regulatory Assessment of Applications Containing QbD Elements-Reviewer Experience, Oral Presentation at American Association of Pharmaceutical Scientists Annual Meeting, Chicago, Illinois, October 14th, 2012
- 15.Polli JE, Cook, JA, Davit, BM, et al. Summary Workshop Report: Facilitating Oral Product Development and Reducing Regulatory Burden Through Novel Approaches to Assess Bioavailability/Bioequivalence, AAPS J. 2012;14(3):629–630. doi: 10.1208/s12248-012-9376-z [DOI] [PMC free article] [PubMed]
- 16.Kourti T, Davis B. The Business Benefit of Quality by Design (QbD) Pharm Eng Off Magazine of ISPE. 2012;32(4):1–10. [Google Scholar]
- 17.Johnston R, Lambert J, Stump E. An Industry Perspective on Quality By Design. BioProcess Int. 2012;10(3):26–35. [Google Scholar]


