Abstract
The effect of moisture content on flowability of six pharmaceutical powders (microcrystalline cellulose (MCC), hydroxypropyl methylcellulose (HPMC), carboxymethyl cellulose (CMC), polyvinylpyrrolidone (PVP), corn starch, and potato starch) was investigated. Powder flowability was measured using established static techniques and emerging dynamic avalanche behavior measurements. Static techniques did not provide enough resolution to clearly identify changes in flowability due to increasing powder moisture content. Avalanche time and its standard deviation showed that flowability of MCC, CMC, PVP, and potato starch decreased after a critical moisture content, flowability of corn starch increased and flowability did not significantly change for HPMC. The moisture decreased flowability by forming stronger interparticle liquid bridges and increased flowability by acting as a lubricant. The dynamic density of the celluloses and PVP decreased linearly with increasing moisture content as the particles swelled with water. The starches also swelled and decreased in dynamic density, but only after a moisture content corresponding to monolayer coverage of water around the particles was reached. As flowability and dynamic density change with moisture content, to ensure consistent production of high-quality tablets, the moisture content of the powders must be measured and controlled.
KEY WORDS: adsorption isotherms, avalanche behavior, flowability, moisture content, pharmaceuticals
INTRODUCTION
Powder properties and behavior are critical to efficient and successful manufacturing of pharmaceutical tablets. The water or moisture content of a powder is a key property. The “hygroscopicity” is a measure of the ability of a powder to take up water vapor from the atmosphere. Callahan et al. (1) and Newman et al. (2) outlined a hygroscopicity classification scheme based on the rate and amount of water uptake from the atmosphere with changes in the air humidity. A nonhygroscopic powder shows almost no change in moisture content with exposure to air below 90% relative humidity while the moisture content of a very hygroscopic powder would increase even in air with a relative humidity as low as 40–50%.
Water in powders can be in different physical states (3): (1) adsorbed monolayer or multilayers on the surfaces of the particle, (2) condensed water on the particle surface, (3) physically absorbed water within the particle, or (4) chemisorbed water. The state and distribution of the water depends on the powder and the amount of water taken up through exposure to humid air and then affects many properties of the powder.
Moisture adsorption isotherms show the relationship at equilibrium between the water content of a material and the humidity of the contacting gas. Adsorption isotherms were originally divided into five categories. These model or ideal isotherms were originally described by Brunauer, Emmett, and Teller and are therefore known as the BET isotherms (4). Type I isotherm represents monolayer adsorption with strong forces between the absorbent and the absorbate. Type II isotherm has an s shape and represents monolayer adsorption followed by multilayer adsorption with strong forces between the absorbent and the absorbate. Type III is strictly multilayer adsorption with weak forces between the absorbent and the absorbate. Type IV is s-shaped similar to types II and V has a similar shape to type III; however, types IV and V exhibit hysteresis due to capillary condensation (5).
For all of the isotherms, there are two possible points of interest. Oksanen and Zografi (6) and Amidon and Houghton (7) suggested that the first inflection point on a type II adsorption isotherm corresponds to a critical moisture content; above this point, water begins to act as a plasticizer due to a reduction in the glass transition temperature (7). The second critical point occurs at higher moisture levels. Above the glass transition temperature, the visco-elastic properties of a solid are altered significantly and the physical properties change from an amorphous to rubbery state (8). Oksanen and Zografi (6) found that polyvinylpyrrilidone transitioned to a rubbery state at the moisture content when the isotherm began to significantly increase and this transition was due to the reduction of the glass transition temperature to the temperature of the isotherm.
Since the original categories were developed, newer models have emerged and the Guggenheim–Anderson–de Boer (GAB) model is currently considered to be the most versatile adsorption model (9). The GAB model considers a layer or layers of sorbed vapor having properties that are intermediate to those in the first layer and of those in the bulk water; the mechanism for water sorption is the sequential formation of a monolayer, an intermediate layer, and then the formation of bulk water (10). The GAB model does not predict different shapes for the moisture adsorption isotherms, but does provide a better fit of experimental data due to the extra parameter corresponding to the formation of an intermediate layer.
For normal pharmaceutical handling conditions, Newman et al. (2) indicated a possible range in relative humidity from 25 to 75% at a temperature of 25°C. Zografi et al. (10) reported a moisture content of 5–6% for microcrystalline cellulose (MCC) during routine handling under ambient conditions of 40–50% relative humidity. Shi et al. (11) proposed a typical moisture content of 3–5% for MCC under ambient conditions and showed that there were major property changes within this range. Sun (12) also found variations in MCC properties within the small 3–5% moisture range, but concluded that this range was still ideal as more significant property changes were observed at higher moisture levels. These literature results indicate that the moisture content of a powder can vary during pharmaceutical handling and manufacturing and that these variations could have an impact upon the process and final tablet quality.
MCC is widely studied as it is commonly used in the pharmaceutical industry. The effect of moisture content on the behavior of MCC has been investigated in a number of studies. Amidon and Houghton (7) found a critical moisture content of 5% and proposed that it was due to water acting as a plasticizer above this moisture content as a result of the reduction in the glass transition temperature. They also indicated that this critical moisture content occurs at the point of upward curvature on the isotherm (7,9). Sun (12) reported a critical moisture content in the range of 3.3–5% which related to a humidity of 20–50%: below 3.3%, there were almost no changes while above 5% the behavior of the powder began to change significantly. This behavior was attributed to increasing plasticity as a result of the reduction in the glass transition temperature and the critical range was related to the completion of the monolayer (12).
Powder flow is critical during tableting. The powder must flow easily and uniformly into the tablet dies to ensure tablet weight uniformity and production of tablets with consistent and reproducible properties (11,13,14). Powder flows from the hopper into the tablet dies when gravitational forces become higher than particle–particle interaction forces. Friction and cohesion are the major particle–particle interaction forces. Friction acts at contact points between particles to oppose the relative motion of the particles. Particle shape and surface morphology affect contact and therefore can increase friction if contact area is increased. Water on the particle surface can act as a lubricant decreasing friction. Cohesion refers to the attraction between particles and includes van der Waals forces, capillary force, electrical force, and electrostatic force. Water primarily affects cohesion by increasing capillary forces through strengthening liquid bridges between particles (11,15).
As shown in Table I, the effect of moisture content on flowability has been examined using microcrystalline cellulose, theophylline, methyl methacrylate starch copolymers, lactose, aspartame, and hydroxypropyl methylcellulose (HPMC). Lactose and HPMC both showed decreased flowability with increasing moisture content, attributed to increased cohesion from stronger liquid bridges formed from condensed water on the surfaces of the particles (16,17). In contrast, the flowability of aspartame was found to increase with moisture content as the particles formed agglomerates that were that were larger and more spherical than the small and needle-shaped individual particles (16). Both Sandler et al. (18) and Bravo-Osuna et al. (19) found that flowability of theophylline and methyl methacrylate starch copolymers, respectively, changed with the moisture content of the powder; at low moisture levels, the water acted as a lubricant between the particles and increased the flowability while at high moisture levels, the water increased cohesion through stronger liquid bridges thereby reducing flowability.
Table I.
Summary of Previous Studies
| Powder | Moisture content (%) | Effect on flowability | Measurement method | Reference |
|---|---|---|---|---|
| Microcrystalline cellulose | 0–12.2 | Decreased flowability | Shear cell | Amidon and Houghton (7) |
| 0–9 | Increased flowability | GDR | Faqih et al. (17) | |
| Theophylline | 19–82 | Flowability varied with moisture content | FloPro flow meter, static angle of repose, Hausner ratio | Sandler et al. (18) |
| Methyl methacrylate starch copolymers | 0–19.6 | Flowability varied with moisture content | Flowmeter based on flow rate through funnels | Bravo-Osuna et al. (19) |
| Fast-flo lactose | 0–0.5 | Decreased flowability | GDR | Faqih et al. (17) |
| Aspartame | 0–8 | Increased flowability | Hausner ratio, Carr index, static and dynamic angle of repose, and shear cell | Emery et al. (16) |
| Hydroxypropyl methylcellulose | 0–10 | Decreased flowability | Hausner ratio, Carr index, static and dynamic angle of repose, and shear cell | Emery et al. (16) |
Changes in moisture content can affect different stages during tablet manufacturing. Shi et al. (11) studied the high shear wet granulation of microcrystalline cellulose with different initial moisture contents ranging from 0.9 to 10.5 wt%. The granule size increased with increasing initial moisture content. This increase in granule size led to improved flowability, but tablets formed from these granules had significantly lower tensile strength. The tableting performance decreased even over a small change in initial moisture content from 2.6 to 4.9% which is within normal variation under manufacturing conditions.
Changes in moisture content can also affect final tablet properties. de Jong (20) concluded that the tablet crushing strength increased with increasing relative density and also decreased with increasing moisture content. Khan et al. (21) found that, past 3% moisture content, tablets of MCC decreased in tensile strength as the moisture disrupted the particle bonds. Similarly, Sun (12) found that, under a constant pressure, the tablet tensile strength is optimum at an intermediate water content of 3.3–5%; outside this range, the tensile strength decreased. These studies confirm that a change in the moisture content of a powder has an effect on important tablet properties; from a quality control perspective, it is critical that all parameters, including moisture content, during tableting remain the same to ensure a consistent and high-quality final product.
The objective of the current research was to examine the effect of moisture content on properties of pharmaceutical powders with an emphasis on flowability as measured dynamically through avalanching behavior. Flowability is critical to tableting. Therefore, measuring and controlling the powder moisture content are important for ensuring production of a final product with consistent and specified properties.
MATERIALS AND METHODS
Materials
Six powders that are commonly used excipients in the pharmaceutical industry were used for the trials: MCC (FMC Corporation, Avicel, PH-101), CMC (Alfa Asear), HPMC (Shin-Elsu Chemical Co., Ltd, Pharmacoat 603), polyvinylpyrrolidone (PVP; Alfa Aesar), corn starch (Alfa Aesar), and potato starch. Particle size distributions of the powders were measured using a Malvern Mastersizer 2000. Scanning electron microscope images of the powders were taken using a Hitachi S-4500 field emission scanning electron microscope. The powder samples were mounted on a plate and coated with gold before examination. The images allowed the shape and surface morphology of the powders to be examined.
Moisture Adsorption Isotherms
The moisture adsorption isotherms of the powders were determined over a wide range of air humidities. The powders were spread into thin layers on trays and placed in a humidity chamber shown schematically in Fig. 1. The humidity of the air passing over the powders was adjusted by varying the flow ratio of dry air and air humidified by bubbling through water in a column. The powders remained in the humidity chamber for 48 h as preliminary trials showed that the powders reached equilibrium with the humid air within this time. The temperature and the humidity of the air within the humidity chamber were measured using dry and wet bulb temperature sensors.
Fig. 1.
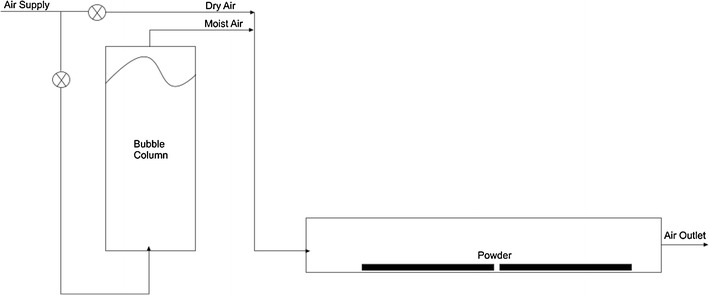
Schematic diagram of the humidity chamber
After 48 h within the humidity chamber, the moisture content of the powders was determined using a Mettler-Toledo HG63 halogen moisture analyzer based on weight loss-on drying at 105°C. Triplicate samples of approximately 5 g were analyzed.
Flowability Measurements
Flowability measurements were performed on the powders immediately after removal from the humidity chamber to minimize any changes in the powder moisture content during the measurements. Flowability measurements included bulk and tapped densities to obtain the Hausner ratio and the Carr index, static angle of repose, and various measurements from the Revolution Powder Analyzer (Mercury Scientific).
The bulk and tapped densities of the mixtures were measured in duplicate using 100 mL samples of the powders. For the bulk density measurements, the powder flowed down a vibrating chute into a 100 ml cylinder and the mass of the powder sample within the cylinder was then measured:
 |
1 |
The sample within the cylinder was then vibrated/tapped until the volume no longer changed and then the final volume was measured to determine the tapped density:
 |
2 |
The bulk and tapped density measurements then allowed the Hausner ratio and Carr index to be calculated:
 |
3 |
 |
4 |
The Hausner ratio indicates the cohesiveness of a powder. A Hausner ratio larger than 1.4 indicates a very cohesive powder that will not flow easily while a value lower than 1.25 indicates a less cohesive, more free-flowing powder. Powders with Hausner ratios between 1.25 and 1.4 belong to a transitional group with some cohesive properties (22). The Carr index also indicates flowability based on densities; values below 20–25% indicate good flowability (23).
Static angle of repose measurements were made using a Powder Research Ltd. Angle of Repose Device. Samples of about 60 mL flowed down a vibrating chute and through a funnel to form a pile below on a calibrated level platform allowing the static angle of repose to be measured. Samples were measured in triplicate.
Alternative indicators of flowability (avalanche time and avalanche time standard deviation) were measured using a Mercury Scientific Revolution Powder Analyzer. A sample size of 118 cm3 was loaded into a drum with a diameter of 11 cm and width of 3.5 cm. This drum was rotated at 0.3 rpm until 128 avalanches had occurred with an avalanche defined as a rearrangement of at least 0.65 vol% of the sample in the drum. Optical measurements with a resolution of 648 × 488 at 60 frames per second monitored the powder surface as the sample was rotated and software calculated the flowability indicators. Samples were measured in triplicate.
Dynamic Density
The Mercury Scientific Revolution Powder Analyzer also measured the dynamic density of powders through the known sample mass and the measured volume of the powder as it moved within the drum:
 |
5 |
The dynamic density was measured in triplicate.
RESULTS
Powder Size, Shape, and Morphology
Figure 2 shows the particle size distributions of the tested powders. CMC had the widest size distribution while PVP had the largest average size. Corn starch had the narrowest distribution and also the smallest average size of 15 μm.
Fig. 2.
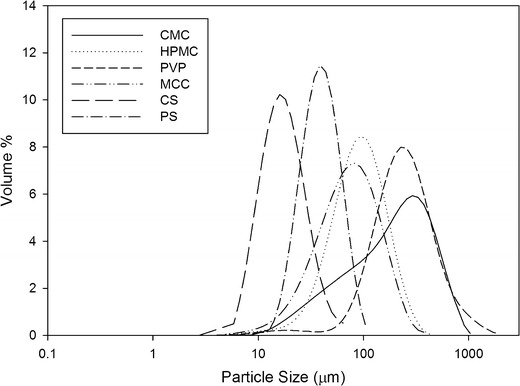
Particle size distributions of the powders
Figure 3 shows the scanning electron images of the powders at 250× magnification. The three cellulose based powders all had a fibrous type profile with a very irregular shape. The PVP was more spherical, but still showed a fibrous surface morphology. In contrast, the corn starch was almost spherical with a smooth surface and the potato starch was ovoid with a smooth surface.
Fig. 3.
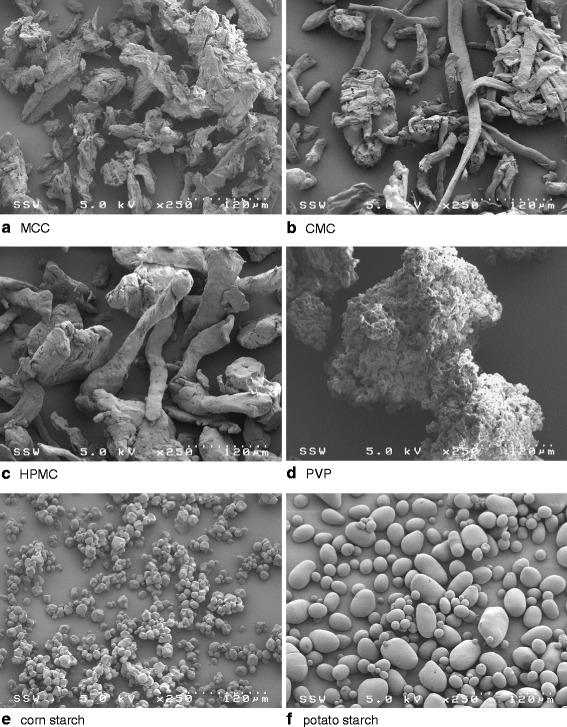
Scanning electron micrographs of the powders
Moisture Adsorption Isotherms
Figure 4 shows the moisture adsorption isotherms of the powders. The data were fitted using least squares regression to the GAB equation (10):
 |
where W is the mass of water taken up per gram of solid, Wm is the mass of water sorbed equivalent to monomolecular coverage, P/Po is the relative water vapor pressure, and K and CG are constant parameters of the GAB equation. The parameters obtained from the fitted GAB equation are summarized in Table II. A second transition, Wg, can be identified on isotherms at the point at which the isotherm curves rapidly upward. The values of Wg obtained from the experimental isotherms are also listed in Table II.
Fig. 4.
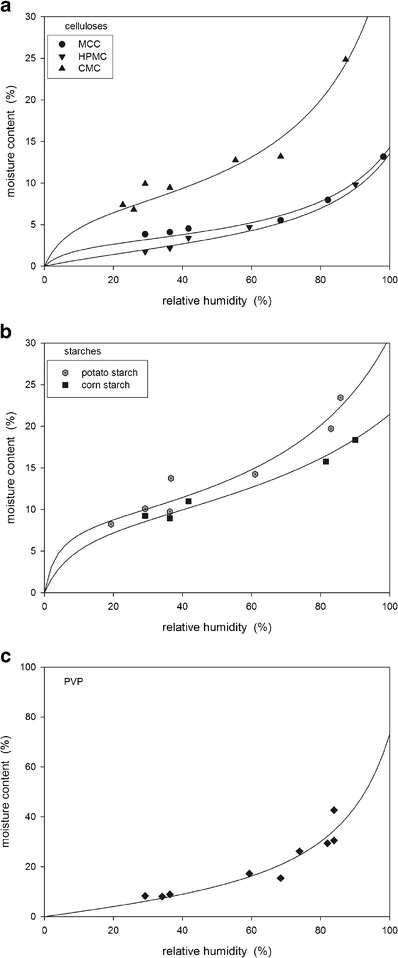
Moisture adsorption isotherms of the tested powders
Table II.
Summary of Parameters from the Fitted GAB Equation
| Powder | W m | CG | K | W g |
|---|---|---|---|---|
| MCC | 0.029 | 17 | 0.80 | 0.050 |
| CMC | 0.071 | 16 | 0.82 | 0.100 |
| HPMC | 0.029 | 3.6 | 0.80 | 0.035 |
| PVP | 0.120 | 1.9 | 0.85 | 0.300 |
| Corn starch | 0.089 | 18 | 0.60 | 0.110 |
| Potato starch | 0.087 | 37 | 0.72 | 0.170 |
MCC microcrystalline cellulose, CMC carboxymethyl cellulose, HPMC hydroxypropyl methylcellulose, PVP polyvinylpyrrolidone, W m mass of water sorbed equivalent to monomolecular coverage, K and CG are constant parameters of the GAB equation, W g point at which the isotherm curves rapidly upward
Flowability
Flowability was examined using the Hausner ratio, Carr index, static angle of repose, and avalanche behavior. General trends with increasing moisture content were obtained for the Hausner ratio, Carr index, and static angle of repose. Figure 5 shows the avalanche times and the standard deviations for the powders. The variation with increasing moisture content for corn starch was completely different than for the other tested powders.
Fig. 5.
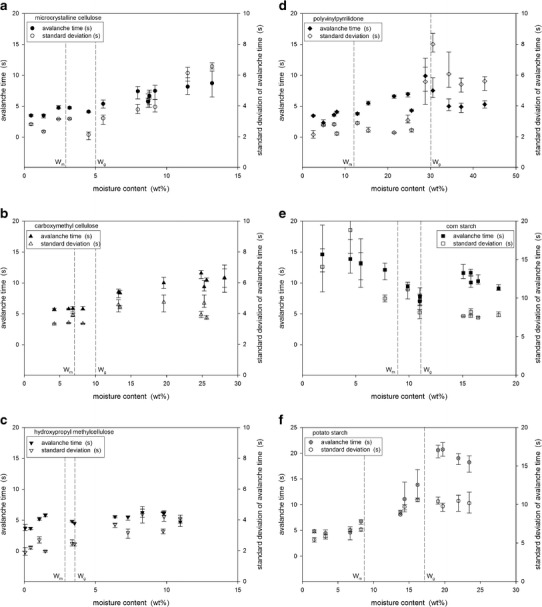
Avalanche times and standard deviations for a MCC, b CMC, c HPMC, d PVP, e corn starch, and f potato starch
Dynamic Density
The dynamic density of the powders was measured using the Revolution Analyzer. The dynamic density of the celluloses and the PVP decreased linearly with increasing moisture content (Fig. 6a) while the relationship for the starches was more complex as the dynamic density did not decrease until a critical moisture content was reached (Fig. 6b).
Fig. 6.
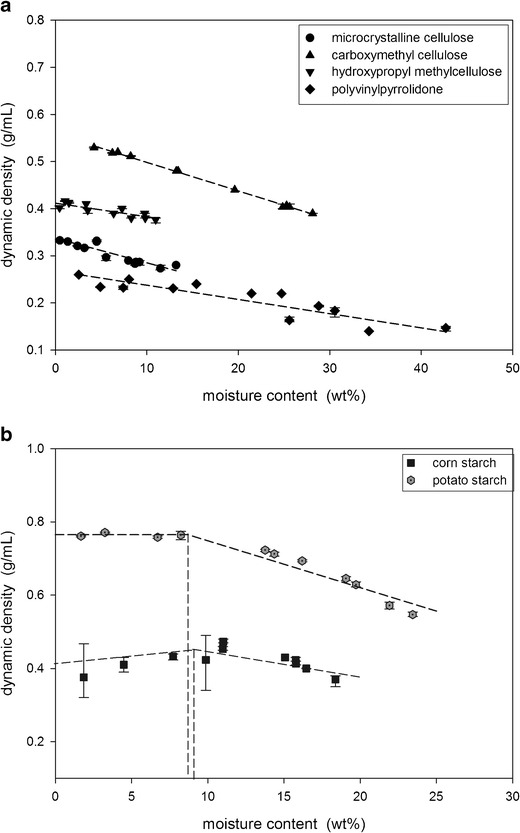
Dynamic density measurements of a the celluloses and PVP and b the starches
DISCUSSION
The moisture adsorption isotherms shown in Fig. 4 were fitted using least squares regression to the GAB equation. The parameters listed in Table II are similar to the ranges reported in the literature (3,6,7,10,12,24). With the exception of PVP, all of the powders showed s-shaped adsorption isotherms indicating type II isotherms. This type of isotherm has also been reported in the literature for these powders (8,9,14,25–27). PVP showed a type III isotherm with the moisture content increasing very rapidly at high air humidities; Oksanen and Zografi (6) also reported a type III isotherm for PVP. Accurate isotherm measurements at very low air humidity levels were limited as it was difficult to maintain constant low levels over the 48-h period required to ensure equilibrium conditions.
The parameter Wm of the GAB equation corresponds to the mass of water sorbed equivalent to monomolecular coverage and this transition point occurs near the first inflection point for type II isothems (Fig. 4). A second transition point, Wg, was also identified on the isotherms at the point at which the isotherm curves rapidly upward. The glass transition temperature decreases with increasing moisture content as the water acts as a plasticizer (24) and this Wg then corresponds to a transition from the glassy to the rubbery state. HPMC had the smallest critical moisture range from 2.9 to 3.5 wt% moisture while PVP had the largest range of 12–30 wt%. Amidon and Houghton (7) reported changes in the properties of MCC in the critical moisture range between Wm and Wg. It was therefore expected that HPMC would have much smaller changes in properties with moisture than the other powders, especially PVP.
Flowability was examined using the Hausner ratio, Carr index, static angle of repose, and avalanche behavior. Only general trends with increasing moisture content were obtained for the Hausner ratio, Carr index, and static angle of repose: with these techniques it is difficult to obtain consistent results and correlations to flowability have poor resolution. It was therefore not possible to draw clear conclusions about the effect of moisture content on powder flowability using these measurements.
The avalanche behavior of a powder can indicate flowability potential. The avalanche time is the time between avalanches. For cohesive and poorly flowing powders, the powder accumulates and builds a crest at the perimeter of the rotating drum over a longer period of time before collapsing as an avalanche. Therefore, there is an inverse relationship between avalanche time and flowability. To examine avalanche behavior, measurements were taken over 128 avalanches. The standard deviation of the avalanche time was also determined as this indicates flow uniformity; a high standard deviation indicates non-uniform or variable flow. Previous studies (28) have found that the avalanche behavior of powders can reliably detect small changes in flowability.
Figure 5 shows the avalanche times and the standard deviations with increasing powder moisture content. For MCC and CMC, the avalanche time and its standard deviation were initially constant and then increased (Fig. 5a, b). The change corresponded to the critical range between Wm and Wg. With a monomolecular coverage of water, cohesion between particles increased as stronger liquid bridges formed. Increased cohesion then combined with a transition to the rubbery state resulted in a decrease in flowability and flow uniformity. Although still a cellulose-based powder, the behavior of HPMC differed from that of MCC and CMC. As shown in Fig. 5c, there were only small changes in the avalanche time and its standard deviation with increasing moisture content with no clear transitions. HPMC had the smallest critical range from Wm of 2.9 wt% to Wg of 3.5 wt% and was also the least hygroscopic tested powder. Therefore, smaller changes in the avalanche time and its standard deviation were expected due to the reduced hygroscopicity of HPMC, as this means that the powder has less affinity for absorbing water and no clear transitions could be observed due to the narrow critical moisture range.
PVP was the most hygroscopic powder tested and reached a moisture content just above 40 wt% at an air humidity of about 80%. It also showed the largest critical moisture range between Wm and Wg values of 12 and 30 wt%. As shown in Fig. 5d, the avalanche time began to increase slightly at Wm indicating increased cohesion from stronger liquid bridges between particles. The change in flowability was not large enough to lead to clear changes in flow uniformity as the standard deviation of avalanche times did not show a transition at Wm. There was a clear break, however, in both the avalanche time and its standard deviation at the transition to the rubbery state, Wg, followed by a decrease in both these parameters as the moisture content was further increased. The rubbery behavior was observed in the avalanche drum: cohesive clumps of PVP “bounced” down the bulk powder slope making it difficult to detect distinct avalanches.
Two types of starches were tested: potato and corn starch. Differences were expected due to the different botanical origins. However, as shown in Fig. 5e, f, the differences in flowability due to increasing moisture content followed opposite trends. Potato starch showed behavior similar to PVP with transitions at Wm as the monolayer coverage of water increased cohesion through stronger liquid bridges and then again at Wg as the rubbery behavior made avalanches difficult to detect by the Revolution Analyzer. Corn starch was the only tested powder that showed an increase in flowability with increasing moisture content. As shown in Fig. 5e, both the avalanche time and its standard deviation decreased with moisture content until the critical region between Wm and Wg and then became approximately constant or increased only slightly with further increases in moisture content. At the lowest tested moisture levels, corn starch had the worst flowability potential with avalanche times near 20 s compared to the other particles that all had initial avalanche times near 5 s. Corn starch was the smallest tested particle with a mean diameter of about 15 μm. For particles this small, van der Waals forces become dominant and contribute to cohesion causing poor flowability. The coverage of water around the corn starch particles acted as a lubricant and increased the distance between the particles reducing the effect of the van der Waals forces. Once monolayer coverage was achieved at 8.9 wt%, additional water did not significantly contribute to the lubricating and spacing effect and therefore further changes in flowability were minimal.
The dynamic density of the powders was measured using the Revolution Powder Analyzer. As shown in Fig. 6a, the dynamic density of the celluloses and PVP decreased linearly with increasing moisture content. This decrease is attributed to the swelling of the particles with the sorbed water. The potato and corn starch, however, did not decrease in dynamic density until the moisture content reached the monolayer coverage point. For the starches, a critical amount of water was therefore required before significant swelling of the particles occurred to lead to density decreases.
A change in the density of powders can affect the final tablet through size, relative amounts of the powders, and strength. Powder flows into the tablet press die for a predetermined specified time. Changes in either flowability and/or density of a powder can therefore result in over or underfilling the tablet die. For example, over an air humidity range of just 40–50%, the moisture content of PVP would increase from about 7–11 wt% with a corresponding decrease in flowability and a decrease in dynamic density from 0.25 to 0.24 g/mL. The decrease in flowability would result in less powder flowing from the hopper into the die during the required filling period and the decreased density would result in less mass of powder filling the die volume. Combining the two effects, the resulting tablet would likely be undersized and need to be discarded. The literature (20,21,29) indicates that the combination of increasing moisture content and decreasing density would also yield a tablet with lower strength that may not meet product specifications.
CONCLUSIONS
For four of the tested excipients (MCC, CMC, PVP, and potato starch), flowability decreased with increasing moisture content, once a critical point of monolayer water coverage was reached, due to an increase in cohesion from stronger interparticle liquid bridges. The flowability of corn starch increased with moisture content until monolayer coverage was reached as the water provided increasing interparticle lubrication as well as increasing spacing between particles thereby minimizing the relative effect of van der Waals forces. Flowability changes were not significant for HPMC, the least hygroscopic tested powder. All of the powders showed a decrease in dynamic density with increasing moisture content. For the starches, however, the decrease in density did not occur until monolayer water coverage was reached. Changes in flowability and dynamic density of excipients can significantly impact tablet formation and therefore the moisture content of the excipients should be carefully monitored and controlled.
ACKNOWLEDGMENTS
The authors would like to acknowledge the financial support of the Natural Sciences and Engineering Council of Canada (NSERC) and support through Ontario Graduate Scholarships (OGS) for Allison Crouter. Kylie O’Donnell is also acknowledged for her work on the preliminary trials of this study.
REFERENCES
- 1.Callahan JC, Cleary GW, Elefant M, Kaplan G, Kensler T, Nash RA. Equilibrium moisture content of pharmaceutical powders. Drug Dev Ind Pharm. 1982;8:355–369. doi: 10.3109/03639048209022105. [DOI] [Google Scholar]
- 2.Newman AW, Reutzel-Edens SM, Zografi G. Characterization of the “hygroscopic” properties of active pharmaceutical ingredients. J Pharm Sci. 2008;97:1047–1059. doi: 10.1002/jps.21033. [DOI] [PubMed] [Google Scholar]
- 3.Malamataris S, Goidas P, Dimitriou A. Moisture sorption and tensile strength of some tableted direct compression excipients. Int J Pharm. 1991;68:51–60. doi: 10.1016/0378-5173(91)90126-9. [DOI] [Google Scholar]
- 4.Brunauer S, Deming LS, Edwards Deming W, Teller E. On a theory of the van der Waals adsorption of gases. J Am Chem Soc. 1940;62:1723–1732. doi: 10.1021/ja01864a025. [DOI] [Google Scholar]
- 5.Donohue MD, Aranovich GL. Classification of Gibbs adsorption isotherms. Adv Colloid Interf Sci. 1998;76–77:137–152. doi: 10.1016/S0001-8686(98)00044-X. [DOI] [Google Scholar]
- 6.Oksanen CA, Zografi G. The relationship between the glass transition temperature and water vapor absorption by poly(vinylpyrrolidone) Pharm Res. 1990;7:654–657. doi: 10.1023/A:1015834715152. [DOI] [PubMed] [Google Scholar]
- 7.Amidon AE, Houghton ME. The effect of moisture on the mechanical and powder flow properties of microcrystalline cellulose. Pharm Res. 1995;12:923–929. doi: 10.1023/A:1016233725612. [DOI] [PubMed] [Google Scholar]
- 8.Kontny MJ, Zografi G. Sorption of water by solids. In: Brittain HG, editor. Physical characterization of pharmaceutical solids. New York: Informa Healthcare; 1995. pp. 387–418. [Google Scholar]
- 9.Peng G, Chen X, Wu W, Jiang X. Modeling of water sorption isotherm for corn starch. J Food Eng. 2007;80:562–567. doi: 10.1016/j.jfoodeng.2006.04.063. [DOI] [Google Scholar]
- 10.Zografi G, Kontny MJ, Yang AYS, Brenner GS. Surface area and water vapor sorption of microcrystalline cellulose. Int J Pharm. 1984;18:99–116. doi: 10.1016/0378-5173(84)90111-X. [DOI] [Google Scholar]
- 11.Shi L, Feng Y, Sun CC. Initial moisture content in raw material can profoundly influence high shear wet granulation process. Int J Pharm. 2011;416:43–48. doi: 10.1016/j.ijpharm.2011.05.080. [DOI] [PubMed] [Google Scholar]
- 12.Sun CC. Mechanism of moisture induced variations in true density and compaction properties of microcrystalline cellulose. Int J Pharm. 2007;346:93–101. doi: 10.1016/j.ijpharm.2007.06.017. [DOI] [PubMed] [Google Scholar]
- 13.Fassihi AR, Kanfer I. Effect of compressibility and powder flow properties on tablet weight variation. Drug Dev Ind Pharm. 1986;12:1947–1966. doi: 10.3109/03639048609042619. [DOI] [Google Scholar]
- 14.Torres MD, Moreira R, Chenlo F, Vazquez MJ. Water adsorption isotherms of carboxymethyl cellulose, guar, locust bean, tragacanth and xanthan gums. Carbohydr Polym. 2012;89:592–598. doi: 10.1016/j.carbpol.2012.03.055. [DOI] [PubMed] [Google Scholar]
- 15.Dawoodbhai S, Rhodes CT. The effect of moisture on powder flow and on compaction and physical stability of tablets. Drug Dev Ind Pharm. 1989;15:1577–1600. doi: 10.3109/03639048909052504. [DOI] [Google Scholar]
- 16.Emery E, Oliver J, Pugsley T, Sharma J, Zhou J. Flowability of moist pharmaceutical powders. Powder Technol. 2009;189:409–415. doi: 10.1016/j.powtec.2008.06.017. [DOI] [Google Scholar]
- 17.Faqih AMN, Mehrotra A, Hammond SV, Muzzio FJ. Effect of moisture and magnesium stearate concentration on flow properties of cohesive granular materials. Int J Pharm. 2007;336:338–345. doi: 10.1016/j.ijpharm.2006.12.024. [DOI] [PubMed] [Google Scholar]
- 18.Sandler N, Reiche K, Heinamaki J, Yliruusi J. Effect of moisture on powder flow properties of theophylline. Pharmaceutics. 2010;2:275–290. doi: 10.3390/pharmaceutics2030275. [DOI] [PMC free article] [PubMed] [Google Scholar]
- 19.Bravo-Osuna I, Ferrero C, Jimenez-Castellanos MR. Influence of moisture content on the mechanical properties of methyl methacrylate-starch co-polymers. Eur J Pharm Biopharm. 2007;66:63–72. doi: 10.1016/j.ejpb.2006.08.003. [DOI] [PubMed] [Google Scholar]
- 20.de Jong JAH. Tablet properties as a function of the properties of granules made in a fluidized bed process. Powder Technol. 1991;65:293–303. doi: 10.1016/0032-5910(91)80193-M. [DOI] [Google Scholar]
- 21.Khan F, Pilpel N, Ingram S. The effect of moisture on the density, compaction and tensile strength of microcrystalline cellulose. Powder Technol. 1988;54:161–164. doi: 10.1016/0032-5910(88)80074-3. [DOI] [Google Scholar]
- 22.Abdullah EC, Geldart D. The use of bulk density measurements as flowability indicators. Powder Technol. 1999;102:151–165. doi: 10.1016/S0032-5910(98)00208-3. [DOI] [Google Scholar]
- 23.Carr R. Evaluating flow properties of solids. Chem Eng. 1965;72:163–168. [Google Scholar]
- 24.Perfetti G, Alphazan T, Wildeboer WJ, Meesters GMH. Thermo-physical characterization of Pharmacoat® 603, Pharmacoat® 615 and Mowiol® 4-98. J Therm Anal Calorim. 2012;109:203–215. doi: 10.1007/s10973-011-1664-9. [DOI] [Google Scholar]
- 25.Nokhodchi A, Ford JL, Rubinstein MH. Studies on the interaction between water and (hydroxypropyl)methylcellulose. J Pharm Sci. 1997;86:608–615. doi: 10.1021/js960279a. [DOI] [PubMed] [Google Scholar]
- 26.Al-Muhtaseb AH, McMinn WAM, Magee TRA. Water sorption isotherms of starch powders. Part 1: mathematical description of experimental data. J Food Eng. 2004;61:297–307. doi: 10.1016/S0260-8774(03)00133-X. [DOI] [Google Scholar]
- 27.Czepirski L, Komorowska-Czepirska E, Szymonska J. Adsorptive properties of biobased adsorbents. Adsorption. 2005;11:757–761. doi: 10.1007/s10450-005-6019-z. [DOI] [Google Scholar]
- 28.Briens L, Logan R. The effect of the chopper on granules formed using a PMA-1 high shear granulator. AAPS Pharm Sci Technol. 2012;12:1358–1365. doi: 10.1208/s12249-011-9703-1. [DOI] [PMC free article] [PubMed] [Google Scholar]
- 29.Tan SB, Newton JM. Powder flowability as an indication of capsule filling performance. Int J Pharm. 1990;61:145–155. doi: 10.1016/0378-5173(90)90053-7. [DOI] [Google Scholar]


