

Abstract
Aims
We have investigated the role of muscle mass, natriuretic peptides and adipokines in explaining the obesity paradox.
Background
The obesity paradox relates to the association between obesity and increased survival in patients with coronary heart disease (CHD) or heart failure (HF).
Methods
Prospective study of 4046 men aged 60–79 years followed up for a mean period of 11 years, during which 1340 deaths occurred. The men were divided according to the presence of doctor diagnosed CHD and HF: (i) no CHD or HF ii), with CHD (no HF) and (iii) with HF.
Results
Overweight (BMI 25–9.9 kg/m2) and obesity (BMI ≥ 30 kg/m2) were associated with lower mortality risk compared to men with normal weight (BMI 18.5–24.9 kg/m2) in those with CHD [hazards ratio (HR) 0.71 (0.56,0.91) and 0.77 (0.57,1.04); p = 0.04 for trend] and in those with HF [HR 0.57 (0.28,1.16) and 0.41 (0.16,1.09; p = 0.04 for trend). Adjustment for muscle mass and NT-proBNP attenuated the inverse association in those with CHD (no HF) [HR 0.78 (0.61,1.01) and 0.96 (0.68,1.36) p = 0.60 for trend) but made minor differences to those with HF [p = 0.05]. Leptin related positively to mortality in men without HF but inversely to mortality in those with HF; adjustment for leptin abolished the BMI mortality association in men with HF [HR 0.82 (0.31,2.20) and 0.99 (0.27,3.71); p = 0.98 for trend].
Conclusion
The lower mortality risk associated with excess weight in men with CHD without HF may be due to higher muscle mass. In men with HF, leptin (possibly reflecting cachexia) explain the inverse association.
Abbreviations: NT-proBNP, N-terminal pro-brain natriuretic peptide; HF, Heart failure; MI, Myocardial infarction; CHD, Coronary heart disease; CRP, C-reactive protein; WC, Waist circumference; BMI, Body mass index; MAMC, Mid arm muscle circumference
Keywords: Obesity, Mortality, Cardiovascular disease, Leptin, Heart failure
1. Introduction
Despite the well-established adverse association between obesity and risk of developing cardiovascular disease and heart failure (HF), a large body of evidence indicates that overweight and obesity are associated with increased survival in patients with HF [1], [2], [3] an unexpected finding commonly termed the ‘obesity paradox’. Numerous investigators and meta-analysis of studies in cohorts with coronary heart disease (CHD) have also demonstrated this paradoxical relationship in patients with CHD [4], [5], [6], [7], [8] although this has not been seen in all studies after adjustment for confounders [9], [10]. The aetiology of this paradoxical association remains largely unexplained but a number of explanations have been proposed [4], [11], [12]. BMI is a poor marker of body fat and does not distinguish between fat and lean body mass which has been associated with increased mortality [13]. Abdominal obesity has been suggested as a better marker of obesity risk. Indeed, meta-analysis of cohorts in CHD has shown positive associations between WC and mortality [14]. In HF, the obesity paradox may be driven by the deleterious effects of cachexia (i.e. weight loss) reflecting the combined loss of muscle and adipose tissues [15]. It has also been postulated that several physiologic mechanisms may explain the protective effect of a higher BMI on mortality [12]. NT-proBNP levels are lower in overweight and obese patients; lower NT-proBNP predicts lower mortality [12], [16]. Another possible explanation for the obesity paradox directly involves the functions of adipose tissue [12], [15]. Adipose tissue produces leptin which experimental studies suggest may have protective effects in HF [17] and adiponectin is decreased in obesity; lower concentrations of adiponectin have been associated with lower mortality in patients with CHD or HF [18], [19], [20]. However few population studies to date have examined the possible role of lean muscle mass, adipokines (leptin, adiponectin) and NT-proBNP in explaining the obesity paradox, although previous studies suggest that NT-proBNP and adiponectin may explain the obesity paradox in HF [18], [21]. In a previous report, we observed a positive association between BMI and mortality in older adults without HF once muscle mass had been taken into account [13]. However, the association of BMI and mortality in men with CHD or HF has not been specifically examined. We have examined the association between BMI and all-cause mortality separately in men with diagnosed CHD without HF and in men with HF (with or without CHD) and examined the role of muscle mass, adipocytes and NT-proBNP in explaining the obesity mortality paradox in these two groups. To see whether the obesity paradox is specific to those with established CHD or HF the association between BMI and mortality is also presented in those without CHD or HF.
2. Subjects and methods
The British Regional Heart Study is a prospective study of cardiovascular disease involving 7735 men aged 40–59 years selected from the age–sex registers of one general practice in each of 24 British towns, who were screened between 1978 and 1980 [22]. In 1998–2000, all surviving men, now aged 60–79 years, were invited for a 20th year follow-up examination. Ethical approval was provided by all relevant local research ethics committees. All men provided informed written consent to the investigation, which was carried out in accordance with the Declaration of Helsinki. All men completed a mailed questionnaire providing information on their lifestyle and medical history, had a physical examination and provided a fasting blood sample. The samples were frozen and stored at − 20 °C on the day of collection and transferred in batches for storage at − 70 °C until analysis, carried out after no more than one freeze–thaw cycle. 4252 men (77% of survivors) attended for examination. 12 lead electrocardiograms were recorded using a Siemens Sicard 460 instrument and were analyzed and coded in accordance with Minnesota Coding definitions at the University of Glasgow ECG core laboratory based at Glasgow Royal Infirmary [23].
2.1. Anthropometric measurements
Measurements at re-examination (1998–2000) included height, weight, waist circumference, triceps skinfold thickness and mid-upper arm circumference (MUAC). The waist measurement was taken from the midpoint between the iliac crest and the lower ribs measured at the sides. Body mass index (BMI; weight/height2 in kg/m2) was calculated for each man. Mid arm muscle circumference (MAMC) was calculated as MUAC − 0.3142*(triceps skinfold thickness) [24]. MAMC were considered an indicator of muscle mass. MAMC has been shown to correlate strongly with more accurate dual-energy X-ray absorptiometry (DXA) measures of lean body mass [25]. Men with BMI < 18.5 and those with missing data on MAMC were excluded (n = 32).
2.2. Cardiovascular risk factors and mobility limitation
Details of measurement and classification methods for smoking status, physical activity, social class, alcohol intake, blood pressure, blood lipids and lung function (forced expiratory volume in one second [FEV1] in this cohort have been described [13], [26]. Predicted glomerular filtration rate (eGFR) (renal function) was estimated from serum creatinine using the Modification of Diet in Renal Disease equation; eGFR = 186 × creatinine − 1.154 × age − 0.203. C-reactive protein (CRP) was assayed by ultrasensitive nephelometry (Dade Behring, Milton Keynes, UK). Prevalent diabetes included men with diagnosed diabetes or men with fasting blood glucose ≥ 7 mmol/l. The men were asked whether they currently had difficulty carrying out any of the four following activities on their own as a result of a long term health problem: (i) going up or down stairs, (ii) bending down or straightening up, (iv) keeping one's balance and (iv) walking for a quarter of a mile on the level. Mobility limitation was defined as men reporting difficulty in any one of the above [27].
2.3. Adiponectin, leptin and NT-proBNP
Plasma adiponectin concentrations were determined using ELISA (R&D systems, UK). The intra-assay and the inter-assay coefficients of variability were each 7.5%. We have previously shown this method to correlate well with a radioimmunoassay method for adiponectin measurement [20]. Plasma leptin was measured by an ‘in house’ radioimmunoassay carefully validated against the commercially available Linco assay, as previously described [28]. The intra- and inter- assay coefficients of variation were < 7% and < 10%, respectively, over the sample concentration range. The detection limit of the assay was 0.5 ng/ml which is superior to commercial assays. NT-proBNP was determined using the Elecsys 2010 electrochemiluminescence method (Roche Diagnostics, Burgess Hill, UK). Samples were snap-thawed at 37 °C and assayed on the analyzer, which was calibrated using the manufacturer's reagents. Manufacturer's controls were used to monitor assay drift, using both a high and low control, with limits of acceptability defined by the manufacturer. Low control CV was 6.7% and high control CV was 4.9% [29].
2.4. Follow-up
All men have been followed up from initial examination (1978–1980) for cardiovascular morbidity and mortality [30] and follow-up has been achieved for 99% of the cohort. In the present analyses, all-cause mortality is based on follow-up from re-screening in 1998–2000 at mean age 60–79 years to June 2010, a mean follow-up period of 11 years (range 10–12 years). Information on death was collected through the established “tagging” procedures provided by the National Health Service registers. A non-fatal myocardial infarction (MI) was diagnosed according to World Health Organisation criteria. Evidence of non-fatal MI and HF was obtained by ad hoc reports from general practitioners supplemented by biennial reviews of the patients' practice records (including hospital and clinic correspondence) and from repeated personal questionnaires to surviving subjects after initial examination through to the end of the study period. Incident non-fatal HF was based on a doctor diagnosis of HF from primary care records and confirmed by a clinical record review by the Research Team.
2.5. Men with CHD and HF
The men were asked whether a doctor had ever told them that they had angina or MI, HF, stroke, diabetes and a number of other CVD conditions. Patient recall of a doctor diagnosis of CHD has been shown to be a valid measure of recording diseases in this study population [31], [32]. The kappa statistics comparing record review with patient's recall of CHD was 0.82 [31]. On the basis of recall of doctor diagnosis of CHD (MI, angina, coronary revascularisation) and ECG evidence of definite MI in 1998–2000 and regular surveillance of general practitioner's records of major non-fatal MI, or HF occurring before that point, the men were divided into three groups based on their CHD and HF status:
-
(i)
Men without CHD or HF (n = 3174) as defined in (ii) and (iii) below.
-
(ii)
Those with prevalent diagnosed CHD or ECG evidence of definite MI but no diagnosed HF (N = 860).
-
(iii)
Those with doctor diagnosed HF (with or without CHD) confirmed in the primary care records and confirmed by a review of the clinical features of diagnosed HF cases (symptoms, signs, treatment response) by the Research team to ensure they are consistent with European Society of Cardiology recommendations on diagnosis [33] (n = 86).
2.6. Statistical methods
The distributions of leptin, adiponectin and NT-proBNP were skewed and log transformation was used. Cox's proportional hazards model was used to assess the multivariate-adjusted hazards ratio. Overweight (25–29.9 kg/m2) and obesity (≥ 30 kg/m2) were defined on the basis of WHO definitions. Similarly we considered WC as a categorical variable using three categories < 94 cm, 94–101 cm and ≥ 102 cm. In multivariate analyses, smoking,social class, physical activity, alcohol intake, diabetes and stroke were fitted as categorical variables; leptin, adiponectin, NT-proBNP and muscle mass were fitted as continuous variables.
3. Results
During the mean follow-up period of 11 years there were 1340 deaths in all men. Fig. 1 shows the Kaplan-Meier survival estimates by BMI groups in the three groups of men. In men without CHD or HF, obesity and normal weight men showed similar survival rates with the lowest rates in overweight men (log rank test p = 0.0008). In both men with CHD without HF and in men with HF overweight and obesity were associated with higher survival rates than men with normal weight [log rank test p = 0.02 and p = 0.07 respectively].
Fig. 1.
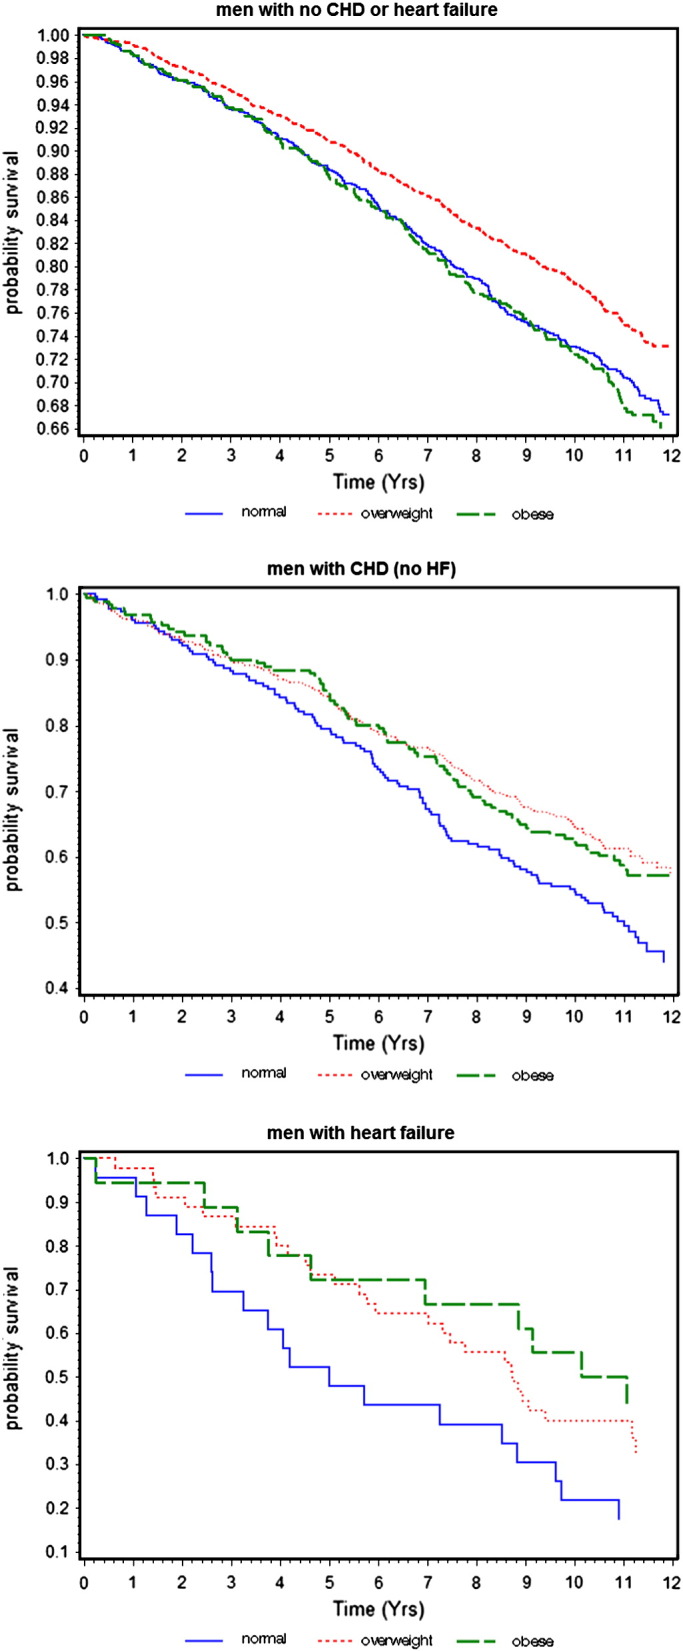
Kaplan–Meier curves of survival by BMI in men without CHD or HF, men with CHD (no HF) and men with HF.
3.1. BMI, body composition, adipokines and NT-proBNP
Table 1 shows the association between BMI and body composition, adipokines and NT-proBNP in the three groups. In all groups, normal weight (BMI 18.5–24.9 kg/m2) was strongly associated with low muscle mass. In men without CHD or HF over half of the men with normal weight had low muscle mass compared to just 7% in the obese group. The prevalence of low muscle mass in normal weight groups increased to 66% in those with CHD and to over 70% in those with HF. Central adiposity (WC) and leptin increased significantly with increasing BMI in all groups; adiponectin decreased significantly with increasing BMI. Normal weight was associated with increased NT-proBNP levels in those with CHD and especially in those with HF. No association was seen between BMI and NT-proBNP in those without CHD or HF.
Table 1.
BMI and body composition and adipokines according to CHD and heart failure status.
| 18.5–25 | 25–29.9 | 30 + | p-trend | |
|---|---|---|---|---|
| Men with no CHD or heart failure (N = 3174) | ||||
| WC (cms) | 87.6 (6.54) | 98.3 (6.06) | 110.9 (8.22) | < 0.0001 |
| MAMC (cms) | 24.95 (1.88) | 26.81 (1.98) | 28.49 (2.23) | < 0.0001 |
| % low muscle mass | 56.7 | 20.9 | 7.8 | < 0.0001 |
| Adiponectin (μg/ml)* | 7.77 (5.14–12.32) | 6.48 (4.2–10.33) | 5.87 (3.89–9.25) | < 0.0001 |
| Leptin (ng/ml)* | 5.70 (3.7–8.35) | 9.68 (6.6–13.7) | 17.63 (11.4–23.1) | < 0.0001 |
| NT-proBNP (pg/ml)* | 87.4 (45–153) | 77.5 (38–146) | 85.6 (42–167) | 0.31 |
| Men with CHD and no heart failure (N = 860) | ||||
| WC (cms) | 88.1 (6.50) | 98.6 (5.99) | 112.1 (8.19) | < 0.0001 |
| MAMC (cms) | 24.5 (2.03) | 26.5 (2.00) | 28.2 (2.24) | < 0.0001 |
| % low muscle mass | 66.4 | 26.4 | 7.3 | < 0.0001 |
| Adiponectin (μg/ml)** | 8.24 (5.44–13.44) | 6.49 (3.98–10.89) | 5.81 (3.60–8.92) | < 0.0001 |
| Leptin (ng/ml)* | 6.75 (4.3–10.2) | 10.70 (7.2–15.9) | 18.73 (13–27.2) | < 0.0001 |
| NT-proBNP (pg/ml)* |
237.5 (112–511) | 196.4 (88.5–439.5) | 162.3 (71–326) | 0.0006 |
| Men with heart failure (N = 86) | ||||
| WC (cms) | 88.4 (7.40) | 99.3 (9.23) | 113.0 (9.86) | < 0.0001 |
| MAMC (cms) | 24.3 (1.60) | 26.2 (2.04) | 26.6 (2.56) | < 0.0001 |
| % low muscle mass | 73.9 | 31.1 | 27.8 | < 0.0001 |
| Adiponectin (μg/ml)* | 15.49 (12.35–19.69) | 6.69 (4.18–10.83) | 8.50 (5.78–16.53) | 0.01 |
| Leptin (ng/ml)* | 5.81 | 12.30 | 25.23 | < 0.0001 |
| NT-proBNP (pg/ml)* |
1236.5 (861–2753) | 278.7 (86.5–801) | 492.7 (332–1018) | 0.05 |
Mean (standard deviation) unless stated; * geometric mean and interquartile range.
Low muscle mass = lowest tertile MAMC.
3.2. Baseline characteristic by BMI status
Table 2 shows the baseline characteristics by BMI in the three groups. Obese men were significantly the youngest group irrespective of CHD/HF status and had the lowest rates of smoking. Prevalence of mobility limitation increased with increasing BMI and was highest in obese men in all CHD/HF status group. HF patients showed by far the highest rates of mobility limitation within all BMI groups. CRP and haemoglobin levels increased significantly with increasing BMI in both groups of men without HF but showed small and non-significant increase with BMI in those with HF.
Table 2.
Baseline characteristics by BMI groups according to CHD and heart failure status.
| BMI (kg/m2) |
||||
|---|---|---|---|---|
| 18.5–25 | 25–29.9 | 30 + | p-trend | |
| Men with no CHD or heart failure | ||||
| Age (years) | 68.9 (5.62) | 68.1 (5.36) | 67.8 (5.32) | < 0.0001 |
| % diabetes | 6.5 | 10.6 | 18.9 | < 0.0001 |
| % diagnosed stroke | 3.4 | 4.5 | 6.6 | 0.02 |
| % renal dysfunction | 10.7 | 14.4 | 16.5 | 0.001 |
| % reported weight loss | 14.3 | 11.8 | 13.6 | 0.38 |
| % statins | 2.0 | 2.5 | 2.9 | 0.28 |
| % smokers | 16.5 | 11.6 | 9.9 | < 0.0001 |
| % inactive | 7.4 | 6.8 | 16.7 | < 0.0001 |
| %mobility limitation | 18.6 | 21.5 | 34.4 | < 0.0001 |
| FEV1 (L) | 2.61 (0.71) | 2.68 (0.62) | 2.55 (0.64) | 0.55 |
| SBP (mmHg) | 147.7 (25.02) | 151.1 (23.48) | 152.6 (22.99) | < 0.0001 |
| Cholesterol (mmol/l) | 6.06 (1.06) | 6.09 (1.05) | 6.06 (1.10) | 0.90 |
| CRP (mg/L)* | 1.26 (0.56–2.50) | 1.72 (0.85–3.26) | 2.48 (1.30–4.70) | < 0.0001 |
| Haemoglobin (g/dL) | 14.42 (1.20) | 14.69 (1.14) | 14.77 (1.07) | < 0.0001 |
| Men with CHD and no heart failure HF | ||||
| Age (yrs) | 70.9 | 70.0 | 68.7 | < 0.0001 |
| % diabetes | 9.6 | 12.7 | 19.9 | 0.003 |
| % diagnosed stroke | 13.1 | 10.5 | 14.7 | 0.70 |
| % diagnosed MI | 56.8 | 51.4 | 52.4 | 0.34 |
| % silent MI | 12.2 | 12.5 | 11.5 | 0.84 |
| % renal dysfunction | 19.7 | 24.7 | 21.1 | 0.67 |
| % reported weight loss | 26.6 | 15.5 | 17.3 | 0.009 |
| % statins | 22.3 | 28.4 | 27.2 | 0.22 |
| % smokers | 17.5 | 10.2 | 7.4 | 0.001 |
| % inactive | 14.5 | 18.3 | 22.1 | 0.06 |
| % mobility limitation | 28.0 | 36.8 | 44.0 | 0.006 |
| FEV1 (L) | 2.38 (0.67) | 2.48 (0.62) | 2.47 (0.53) | 0.24 |
| SBP (mmHg) | 143.0 (24.66) | 145.3 (24.47) | 149.6 (24.51) | 0.002 |
| Cholesterol (mmol/l) | 5.61 (0.98) | 5.85 (1.13) | 5.82 (1.16) | 0.03 |
| CRP (mg/L)* | 1.79 (0.72–4.40) | 1.95 (1.00–3.86) | 2.64 (1.27–5.15) | 0.0003 |
| Haemoglobin (g/dl) | 14.19 (1.18) | 14.50 (1.33) | 14.59 (1.21) | 0.005 |
| Men with heart failure | ||||
| Age (yrs) | 71.9 | 72.3 | 69.5 | < 0.0001 |
| % diabetes | 13.0 | 15.6 | 16.7 | 0.74 |
| % diagnosed stroke | 17.4 | 8.9 | 0 | 0.06 |
| % diagnosed MI | 30.4 | 24.4 | 55.6 | 0.12 |
| % silent MI | 8.7 | 8.9 | 5.6 | 0.74 |
| % renal dysfunction | 36.4 | 33.3 | 23.5 | 0.42 |
| % reported weight loss | 30.4 | 24.4 | 33.3 | 0.89 |
| % statins | 8.7 | 6.7 | 22.2 | 0.20 |
| % smokers | 17.5 | 10.2 | 7.4 | 0.05 |
| % inactive | 30.4 | 15.6 | 29.4 | 0.74 |
| % mobility limitation | 43.4 | 35.6 | 72.2 | 0.09 |
| FEV1 (L) | 2.15 (0.79) | 2.21 (0.66) | 2.25 (0.53) | 0.66 |
| SBP (mmHg) | 138.3 (26.80) | 147.2 (24.63) | 136.8 (30.78) | 0.98 |
| Cholesterol (mmol/l) | 5.98 (0.89) | 5.78 (1.07) | 5.98 (1.09) | 0.78 |
| CRP (mg/L)* | 2.20 (0.68–11.20) | 2.45 (1.00–4.07) | 2.53 (1.49–3.83) | 0.83 |
| Haemoglobin (g/dl) | 14.40 (1.28) | 14.80 (1.17) | 14.46 (0.76) | 0.90 |
SBP systolic blood pressure; *Geometric mean and interquartile range;
Renal dysfunction = eGFR < 60 ml/min per 1.73 m2.
3.3. BMI, body composition, adipocytes, NT-proBNP and mortality
Table 3 shows the association between BMI, body composition, adipocytes, NT-proBNP and mortality separately in the three groups adjusted for age. Obesity was associated with the highest risk, albeit non-significant in those without CHD after age-adjustment. By contrast, among men with CHD normal weight was associated with the highest mortality with the lowest mortality risk in the overweight group. In men with HF an inverse association was seen between BMI and mortality. WC was positively associated with mortality in those without CHD or HF but no significant association was seen in those with CHD. In men with HF an inverse association was also seen for WC (albeit non-significant). Muscle mass was inversely associated with mortality in those without HF but less apparent in those with HF. Leptin was positively association with mortality in men with or without CHD but was significantly inversely associated with mortality in those with HF. A formal test for interaction confirmed a significant difference in the relationship between leptin and mortality in men with and without HF (p < 0.001). Adiponectin showed positive associations with mortality in all three groups although the trend was weak in those with CHD (no HF). NT-proBNP was strongly and positively associated with mortality in all groups, lending external validity to our findings.
Table 3.
Adiposity measures, muscle mass, adipokines, NT-proBNP and age-adjusted hazards ratio (95%CI) total mortality in men with no CHD or HF, men with CHD (no HF) and in men with HF.
| Men with no CHD or HF (n = 3174) | Men with CHD and no HF (n = 860) | Men with HF (n = 86) | |||||||
|---|---|---|---|---|---|---|---|---|---|
| Mortality rate/1000 per-yrs | 28.7 | 49.3 | 90.1 | ||||||
| BMI (kg/m2) | N | No of cases | Age-adjusted | N | No of cases | Age-adjusted | N | No of cases | Age-adjusted |
| < 25 | 990 | 304 | 1.00 | 229 | 119 | 1.00 | 23 | 19 | 1.00 |
| 25–29.9 | 1698 | 446 | 0.88 (0.76,1.02) | 440 | 178 | 0.74 (0.58,0.93) | 45 | 29 | 0.52 (0.29,0.94) |
| 30 + | 486 | 154 | 1.17 (0.97,1.42) | 191 | 81 | 0.88 (0.67,1.75) | 18 | 10 | 0.47 (0.22,1.01) |
| p-trend | P = 0.43 | P = 0.25 | P = 0.04 | ||||||
| WC | |||||||||
| < 94 | 1246 | 346 | 1.00 | 288 | 141 | 1.00 | 27 | 20 | 1.00 |
| 94–102 | 1057 | 280 | 0.99 (0.85,1.16) | 287 | 114 | 0.81 (0.63,1.04) | 28 | 17 | 0.51 (0.26,0.99) |
| > 102 | 871 | 278 | 1.23 (1.05,1.44) | 285 | 123 | 1.00 (0.78,1.28) | 31 | 21 | 0.63 (0.34,1.18) |
| p-trend | P = 0.02 | P = 0.67 | P = 0.23 | ||||||
|
Muscle Mass (MAMC) | |||||||||
| 1 (low) | 1057 | 398 | 1.00 | 287 | 158 | 1.00 | 30 | 21 | 1.00 |
| 2 | 1060 | 273 | 0.76 (0.65,0.88) | 286 | 113 | 0.74 (0.54, 0.94) | 27 | 17 | 1.16 (0.60, 2.26) |
| 3 (high) | 1057 | 233 | 0.71 (0.60,0.83) | 287 | 107 | 0.76 (0.59, 0.98) | 29 | 20 | 0.88 (0.48, 1.64) |
| p-Trend | P < 0.0001 | P = 0.03 | P = 0.68 | ||||||
| Leptin | |||||||||
| 1 (low) | 980 | 358 | 1.00 | 258 | 110 | 1.00 | 27 | 22 | 1.00 |
| 2 | 961 | 298 | 0.99 (0.84, 1.18) | 252 | 108 | 1.11 (0.85,1.45) | 26 | 15 | 0.49 (0.26,0.95) |
| 3 (high) | 966 | 165 | 1.21 (1.03,1.43) | 254 | 122 | 1.40 (1.08,1.81) | 27 | 16 | 0.35 (0.18,0.68) |
| p-Trend | P = 0.02 | P = 0.01 | P = 0.002 | ||||||
| Adiponectin | |||||||||
| 1 (low) | 1010 | 234 | 1.00 | 269 | 106 | 1.00 | 28 | 14 | 1.00 |
| 2 | 1011 | 276 | 1.13 (0.95,1.34) | 268 | 112 | 0.98 (0.75,1.29) | 27 | 19 | 1.60 (0.80,3.22) |
| 3 (high) | 1012 | 352 | 1.27 (1.07, 1.51) | 269 | 139 | 1.19 (0.92,1.54) | 27 | 21 | 2.30 (1.17,4. 50) |
| p-trend | P = 0.005 | P = 0.18 | P = 0.02 | ||||||
| NT-proBNP | |||||||||
| 1 (low) | 951 | 170 | 1.00 | 252 | 73 | 1.00 | 25 | 12 | 1.00 |
| 2 | 942 | 224 | 1.09 (0.89,1.34) | 251 | 98 | 1.26 (0.93,1.71) | 26 | 18 | 1.24 (0.58,2.65) |
| 3 (high) | 951 | 408 | 1.82 (1.50,2.20) | 253 | 165 | 2.38 (1.78,3.18) | 25 | 20 | 2.75 (1.32,5.72) |
| p-trend | P < 0.0001 | P < 0.0001 | P = 0.001 | ||||||
p-trend — test for trend across groups.
3.4. BMI and mortality
Table 4 shows the relative risk of mortality by BMI groups adjusted sequentially for confounders and possible mechanisms. In men without CHD/HF a significant positive association was seen between obesity and mortality after adjustment for muscle mass. In men with CHD (no HF), overweight and obesity were associated with significantly lower risk of mortality after adjustment for potential confounders and pre-existing disease (model 1) which was attenuated after adjustment for muscle mass (model 2). Further adjustment for NT-proBNP and adiponectin reduced the difference further, but only modestly. In a sensitivity analysis confined to men with MI only, a similar pattern was seen. In men with HF a significant inverse association was seen even after adjustment for lifestyle characteristics pre-existing disease muscle mass and NT-proBNP (model 3). The inverse association was strengthened after adjustment for mobility limitation (p = 0.006). Adjustment for adiponectin (model 4) attenuated the inverse association and adjustment for leptin abolished the inverse association between BMI and mortality in those with HF (model 5).
Table 4.
BMI and adjusted hazards ratio (95%CI) total mortality in men by CHD and heart failure status.
| BMI (kg/m2) |
P for |
Low vs high (< 25 vs ≥ 25) |
|||
|---|---|---|---|---|---|
| 18.5–24.9 | 25–29.9 | 30 + | trend | ||
| No CHD and no HF | |||||
| Model 1 | 1.00 | 0.88 (0.76,1.02) | 1.01 (0.83,1.24) | P = 0.67 | 0.91 (0.79,1.05) |
| Model 2 | 1.00 | 0.99 (0.84,1.16) | 1.25 (1.00,1.59) | P = 0.13 | 1.01 (0.87,1.18) |
| Model 3 | 1.00 | 0.97 (0.82,1.13) | 1.19 (0.95,1.50) | P = 0.27 | 0.99 (0.85,1.16) |
| Model 4 | 1.00 | 1.00 (0.84,1.19) | 1.24 (0.85,1.43) | P = 0.13 | 1.04 (0.88,1.21) |
| CHD and no HF | |||||
| Model 1 | 1.00 | 0.71 (0.56,0.91) | 0.77 (0.57,1.04) | P = 0.04 | 0.72 (0.57,0.90) |
| Model 2 | 1.00 | 0.80 (0.62,1.03) | 0.96 (0.68,1.35) | P = 0.60 | 0.81 (0.63,1.04) |
| Model 3 | 1.00 | 0.78 (0.61,1.01) | 0.96 (0.68,1.36) | P = 0.48 | 0.81 (0.63,1.04) |
| Model 4 | 1.00 | 0.78 (0.60,1.02) | 0.95 (0.68,1.35) | P = 0.59 | 0.81 (0.62,1.05) |
| HF | |||||
| Model 1 | 1.00 | 0.57 (0.28,1.16) | 0.41 (0.16,1.09) | P = 0.04 | 0.44 (0.21,0.90) |
| Model 2 | 1.00 | 0.66 (0.29,1.52) | 0.47 (0.17,1.35) | P = 0.09 | 0.49 (0.21,1.13) |
| Model 3 | 1.00 | 0.63 (0.26,1.52) | 0.35 (0.12,1.02) | P = 0.05 | 0.54 (0.23,1.24) |
| Model 4 | 1.00 | 0.78 (0.30,2.06) | 0.44 (0.14,1.39) | P = 0.15 | 0.66 (0.26,1.69) |
| Model 5 | 1.00 | 0.82 (0.31,2.20) | 0.99 (0.27,3.71) | P = 0.98 | 0.84 (0.31,2.24) |
Model 1 = adjusted for age, smoking, alcohol intake, social class, physical activity, prevalent diabetes and stroke.
Model 2 = Model 1 + muscle mass.
Model 3 = Model 1 + muscle mass + NT-proBNP.
Model 4 = Model 1 + muscle mass + adiponectin.
Model 5 = Model 1 + muscle mass + leptin.
4. Discussion
In this study of older men in the general population we were able to examine the BMI-mortality relationship separately in those with and without CHD or HF within the same older population and the findings suggest that the obesity paradox is largely seen in those with CHD and particularly in those with HF. Obesity was associated with lower risk of mortality compared to normal weight in men with CHD or HF although the lowest mortality in those without CHD or HF was seen in the overweight group. Our findings are consistent with the vast majority of studies that have demonstrated the obesity paradox in populations with CHD or HF based on BMI [1], [2], [3], [4], [5], [6], [7], [8] and extends previous reports by examining the role of several possible factors which have been proposed to help explain this paradox including muscle mass, NT-proBNP and adipokines which have not been widely examined.
4.1. Muscle mass and NT-proBNP
Part of the explanation for the obesity paradox may be due to the use of BMI to define obesity, which does not take into account lean muscle mass. We have shown that the vast majority of men with normal body weight had low muscle mass and the prevalence of low muscle mass increased appreciably in the presence of CHD and HF. Low muscle mass was associated with increased mortality in those without HF irrespective of CHD status. The lower risk associated with overweight and obesity in those with CHD was attenuated after adjustment for muscle mass. In men with HF however the inverse association between BMI and mortality persisted. Few studies have examined the role of muscle mass although one study showed the obesity paradox to persist in those with CHD even after taking into account muscle mass [8]. However patients with CHD in that study included those with HF. Thus the persistence of lower risk associated with obesity may have been due to the high prevalence of patients with HF in this group. BMI related inversely to NT-proBNP only in those with CHD or HF but not in men without CHD/HF. It is well recognised that obesity is associated with lower NT-proBNP. The mechanisms are still unclear but it has been proposed that adipose tissue contains an abundance of natriuretic peptide binding sites, leading to increased clearance of NT-proBNP in obese patients who have larger stores of adipose tissue [34]. However, further adjustment for NT-proBNP made minor differences in those with CHD once muscle mass was taken into account. Men with HF and low BMI had by far the highest levels of NTproBNP. This is consistent with the speculation that natriuretic peptides with their lipolytic actions may be responsible for the loss of adipose tissue observed in cachetic HF patients [35]. The inverse association between BMI and mortality in those with HF, however, was not explained by lean muscle mass or NT-proBNP. We measured lean muscle mass by means of MAMC and although a correlation between DXA and MAMC has been described [25], in patients with HF the muscle component related to lower limbs may play a far more important role than that of the arms. Patients with HF often exhibit some degree of muscle wasting restricted to the lower limbs so MUAC may not be a good indicator of skeletal muscle wasting in HF patients except when HF is more advanced in the cachectic status [35]. In agreement with this, mobility limitation, which is strongly associated with loss of lower limb muscle strength [36] was indeed shown to be strongly associated with HF. We observed greater difference in prevalence of mobility limitation than prevalence of low muscle mass between HF patients and non HF patients but adjustment for mobility limitation did not explain the inverse association between BMI and mortality in HF patients since obese patients had the highest prevalence.
4.2. Adipokines
We also investigated the role of adipokines (adiponectin and leptin) in explaining the paradoxical link in HF. HF patients with low BMI showed by far the highest levels of adiponectin which may reflect low skeletal muscle strength [37]. The inverse association between BMI and mortality was only partially attenuated after adjustment for adiponectin. Leptin however, appeared to explain the obesity paradox in men with HF. Leptin was positively associated with mortality in men without CHD or HF and in men with CHD (no HF) which is consistent with a previous report in those with established atherosclerosis [38]. However, in those with HF a significant inverse association was seen with mortality, and there was clear statistical heterogeneity. This unexpected association is consistent with clinical studies suggesting that leptin may have protective effects in those with HF through neutralising the deleterious effects of the proinflammatory cytokine tumour necrosis factor α on the myocardium in HF patients leading to better survival [18], [39]. Alternatively high leptin levels in those with HF are likely to be secondary to increased fat. Leptin has an important role in energy metabolism and in lean and fat mass and appetite regulation [40]. Cardiac cachexia (wasting) observed in end stage HF is associated with a decrease of fat mass in addition to a reduced lean muscle mass [41]. Loss of weight and fat leads to a decrease in leptin and leptin levels have been shown to be lower in cachetic HF patients compared to noncachetic HF patients [42]. Thus low leptin in those with HF may reflect loss of adipose tissue due to cachexia which is associated with reduced survival [42]. Of interest, low leptin levels have been associated with worsening immune function too [43], so that individuals with low leptin may be less able to buffer against infections or inflammatory insults.
4.3. Waist circumference
The association between WC and mortality in CHD patients in contrast to BMI have found to be positive [14] or null [9]. We showed no significant association between WC and mortality in those with CHD which is consistent with a previous study in patients with MI [9]. The lack of association between central adiposity and mortality in those with CHD in the present study is in keeping with the findings that the inverse association seen for BMI in those with CHD may reflect muscle mass. Data on WC and mortality in HF patients are limited. Although one study reported a positive association [44] an inverse association between WC and mortality has also been previously reported [45] as was observed in our study which may reflect loss of fat mass due to cachexia.
4.4. Strengths and limitations
The strengths of this study include its representative sampling of older men aged 60–79 years with high follow-up rate, good characterization of CVD status and the availability of a wide range of adiposity measures, CV risk factors and biological markers including adipokines and NT-proBNP. Muscle mass was estimated from MAMC and we did not have a direct measure of muscle mass such as computerised tomography scanning or magnetic resonance imaging (MRI). However MAMC has been shown to correlate strongly with more accurate measures of lean mass, measured by DXA [25]. Our HF cases are based on general practitioners’ reporting however their validity is supported by the close agreement of the incidence and determinants of HF in this study population with those of other sources [28], [29]. Although we did not have data available on many factors related to mortality in HF patients such as left ejection fraction and the New York Heart Association (NYHA) functional class, previous studies have shown the inverse association between BMI and total mortality to be independent of left ventricular ejection fraction and the NYHA functional class [3]. Moreover obese (not lean) patients in our study showed the highest rates of mobility limitation an indicator of functional limitation which is consistent with the findings in the CHARM Study that obese subjects had the highest prevalence of NYHA class III and IV [3]. We did not have information on obstructive sleep apnoea (OSA) which is highly prevalent in patients with HF and is associated with worsening prognosis [46]. However, obesity is considered a risk factor for OSA and a recent study of sleep apnoea in HF patients has shown obesity (rather than leanness) to be associated with OSA [46]. Thus OSA is unlikely to explain the high mortality rates in those with low BMI. Our study was carried out in a predominantly white Caucasian male population and we cannot generalise our findings to older women or other ethnic groups. The number of men with confirmed HF in our study was small and further large studies in HF are needed to confirm the findings of leptin and mortality in HF. Moreover our study cannot assess the nature of the relationship between leptin and mortality in those with HF.
5. Conclusion
In this older population, the obesity paradox (increased survival in those with higher BMI) is commonly seen in those with CHD or HF. The lower risk of mortality associated with excess body weight in men with CHD without HF appears largely associated with higher muscle mass. In men with HF, an additional loss of fat mass as exemplified by low leptin appears to explain the inverse association. Whether lower leptin directly or indirectly (by virtue of its association with fat mass) explains higher mortality in HF remains to be elucidated.
Footnotes
This is an open-access article distributed under the terms of the Creative Commons Attribution-NonCommercial-No Derivative Works License, which permits non-commercial use, distribution, and reproduction in any medium, provided the original author and source are credited.
Funding sources: The British Regional Heart Study is a British Heart Foundation (BHF) research group and receives support from the BHF Programme grant (RG/08/013/25942).
Disclosure: None.
References
- 1.Lavie C.J., Milani R.V., Ventura H.O. Obesity and cardiovascular disease: risk factor, paradox and impact of weight loss. J Am Coll Cardiol. 2009;53:1925–1932. doi: 10.1016/j.jacc.2008.12.068. [DOI] [PubMed] [Google Scholar]
- 2.Oreopoulos A., Padwal R., Kalantar-Zadeh K., Fonarow G.C., Norris C.M., McAlister F.A. Body mass index and mortality in heart failure: a meta-analysis. Am Heart J. 2008;156:13–22. doi: 10.1016/j.ahj.2008.02.014. [DOI] [PubMed] [Google Scholar]
- 3.Kenchaiah S., Pocock S.J., Wang D. Body mass index and prognosis in patients with chronic heart failure: insights from the Candesartan in Heart failure: assessment of Reduction in Mortality and morbidity (CHARM) program. Circulation. 2007;116:627–636. doi: 10.1161/CIRCULATIONAHA.106.679779. [DOI] [PubMed] [Google Scholar]
- 4.Romero-Corral A., Montori V.M., Somers V.K. Association of bodyweight with total mortality and with cardiovascular events in coronary artery disease: a systematic review of cohort studies. Lancet. 2006;368:666–678. doi: 10.1016/S0140-6736(06)69251-9. [DOI] [PubMed] [Google Scholar]
- 5.Angerås O., Albertsson P., Karason K. Evidence for obesity paradox in patients with acute coronary syndromes: a report from the Swedish Coronary Angiography and Angioplasty Registry. Eur Heart J. 2013;34:345–353. doi: 10.1093/eurheartj/ehs217. [DOI] [PubMed] [Google Scholar]
- 6.Oreopoulos A., McAlister F.A., Kalantar-Zadeh K. The relationship between body mass index, treatment and mortality in patients with established coronary artery disease:a report from APPROACH. Eur Heart J. 2009;30:2584–2592. doi: 10.1093/eurheartj/ehp288. [DOI] [PMC free article] [PubMed] [Google Scholar]
- 7.Iozzo P., Rossi G., Michelassi C., Landi P., Carpeggiani C. Interpretation of the “obesity paradox”: A 30-year study in patients with cardiovascular disease. Int J Cardiol. 2013;168:112–116. doi: 10.1016/j.ijcard.2012.09.061. [DOI] [PubMed] [Google Scholar]
- 8.Lavie C.J., de Schutter A., Patel D.A., Romero-Corral A., Artham S.M., Milani R.V. Body composition and survival in stable coronary heart disease. J Am Coll Cardiol. 2012;60:1374–1380. doi: 10.1016/j.jacc.2012.05.037. [DOI] [PubMed] [Google Scholar]
- 9.Zeller M., Steg P.G., Ravisy J. Relation between body mass index, waist circumference and death after acute myocardial infarction. Circulation. 2008;118:482–490. doi: 10.1161/CIRCULATIONAHA.107.753483. [DOI] [PubMed] [Google Scholar]
- 10.Kanhai D.A., Kapelle L.J., van der Graaf Y., Uiterwaal C.S.P.M., Visseren FLJ for the SMART Study Group The risk of general and abdominal adiposity in the occurrence of new vascular events and mortality in patients with various manifestations of vascular disease. Int J Obes. 2012;36:695–702. doi: 10.1038/ijo.2011.115. [DOI] [PubMed] [Google Scholar]
- 11.Lavie C.J., Milani R.V., Ventura H.O. Impact of obesity on outcomes in myocardial infarction: combating the “obesity paradox”. J Am Coll Cardiol. 2011;58:2651–2653. doi: 10.1016/j.jacc.2011.09.032. [DOI] [PubMed] [Google Scholar]
- 12.Dorner T.E., Rieder A. Obesity paradox in elderly patients with cardiovascular diseases. Int J Cardiol. 2012;155:56–65. doi: 10.1016/j.ijcard.2011.01.076. [DOI] [PubMed] [Google Scholar]
- 13.Wannamethee S.G., Shaper A.G., Lennon L., Whincup P.H. Decreased muscle mass and increased central adiposity are independently related to mortality in older men. Am J Clin Nutr. 2007;86:1339–1346. doi: 10.1093/ajcn/86.5.1339. [DOI] [PubMed] [Google Scholar]
- 14.Coutinho T., Goel K., Corrêa de Sá D. Central Obesity and survival in subjects with coronary artery disease: a systematic review of the literature and collaborative analysis with individual subject data. J Am Coll Cardiol. 2011;57:1877–1886. doi: 10.1016/j.jacc.2010.11.058. [DOI] [PubMed] [Google Scholar]
- 15.Marques M.B., Langouche L. Endocrine, metabolic and morphologic alterations of adipose tissue during critical illness. Crit Care Med. 2013;41:317–325. doi: 10.1097/CCM.0b013e318265f21c. [DOI] [PubMed] [Google Scholar]
- 16.Clerico A., Giannoni A., Vittorini S., Emdin M. The paradox of low BNP levels in obesity. Heart Fail Rev. 2012;17:81–96. doi: 10.1007/s10741-011-9249-z. [DOI] [PubMed] [Google Scholar]
- 17.McGaffin K.R., Moravec C.S., Mctiernan C.F. Leptin signalling in the failing and mechanically unloaded human heart. Circ Heart Fail. 2009;2:676–683. doi: 10.1161/CIRCHEARTFAILURE.109.869909. [DOI] [PMC free article] [PubMed] [Google Scholar]
- 18.Kistorp C., Faber J., Galatius S. Plasma adiponectin, body mass index and mortality in patients with chronic heart failure. Circulation. 2005;112:1756–1762. doi: 10.1161/CIRCULATIONAHA.104.530972. [DOI] [PubMed] [Google Scholar]
- 19.Hascoet S., Elbaz M., Bongard V. Adiponectin and long term mortality in coronary artery disease participants and controls. Arterioscler Thromb Vasc Biol. 2013;33:e19–e29. doi: 10.1161/ATVBAHA.112.300079. [DOI] [PubMed] [Google Scholar]
- 20.Wannamethee S.G., Whincup P.H., Lennon L., Sattar N. Circulating adiponectin levels and mortality in elderly men with and without cardiovascular disease and heart failure. Arch Intern Med. 2007;167:1510–1517. doi: 10.1001/archinte.167.14.1510. [DOI] [PubMed] [Google Scholar]
- 21.Frankenstein L., Zugck C., Nelles M., Schellberg D., Katus H.A., Remppis A. The obesity paradox in stable chronic heart failure does not persist after matching for indicators of disease severity and confounders. Eur J Heart Fail. 2009;11:1189–1194. doi: 10.1093/eurjhf/hfp150. [DOI] [PubMed] [Google Scholar]
- 22.Shaper A.G., Pocock S.J., Walker M., Cohen N.M., Wale C.J., Thomson A.G. British Regional Heart Study: cardiovascular risk factors in middle-aged men in 24 towns. BMJ. 1981;282:179–186. doi: 10.1136/bmj.283.6285.179. [DOI] [PMC free article] [PubMed] [Google Scholar]
- 23.Macfarlane P.W., Devine B., Latif S., McLaughlin S., Shoat D.B., Watts M.P. Methodology of ECG interpretation in the Glasgow program. Methods Inf Med. 1990;29:354–361. [PubMed] [Google Scholar]
- 24.Heymsfield S.B., McManus C., Smith J., Stevens V., Nixon D.W. Anthropometric measurement of muscle mass: revised equations for calculating bone-free arm muscle area. Am J Clin Nutr. 1982;36:680–690. doi: 10.1093/ajcn/36.4.680. [DOI] [PubMed] [Google Scholar]
- 25.Noori N., Kopple J.D., Kovesdy C.P. Mid-Arm muscle circumference and quality of life and survival in maintenance hemodialysis patients. Clin J Am Soc Nephrol. 2010;5:2258–2268. doi: 10.2215/CJN.02080310. [DOI] [PMC free article] [PubMed] [Google Scholar]
- 26.Wannamethee S.G., Lowe G.D.O., Whincup P.H. Physical activity and hemostatic and inflammatory variables in elderly men. Circulation. 2002;105:1785–1790. doi: 10.1161/hc1502.107117. [DOI] [PubMed] [Google Scholar]
- 27.Wannamethee S.G., Ebrahim S., Papacosta O., Shaper A.G. From a postal questionnaire of older men, healthy lifestyle factors reduced the onset of and may have increased recovery from mobility limitation. J Clin Epidemiol. 2005;58:831–840. doi: 10.1016/j.jclinepi.2005.01.007. [DOI] [PubMed] [Google Scholar]
- 28.Wannamethee S.G., Shaper A.G., Whincup P.H., Lennon L., Sattar N. Obesity and risk of incident heart failure in older men with and without pre-existing coronary heart disease: does leptin have a role? J Am Coll Cardiol. 2011;58:1870–1877. doi: 10.1016/j.jacc.2011.06.057. [DOI] [PubMed] [Google Scholar]
- 29.Wannamethee S.G., Welsh P., Whincup P., Lennon L., Papacosta Sattar N. N-terminal pro brain natriuretic peptide but not copeptin improves prediction of heart failure over other routine clinical risk parameters in older men with and without cardiovascular disease: population-based study. Eur J Heart Fail. Jul 30 2013 doi: 10.1093/eurjhf/hft124. [Epub ahead of print] [DOI] [PubMed] [Google Scholar]
- 30.Walker M., Shaper A.G., Lennon L., Whincup P.H. Twenty year follow-up of a cohort based in general practices in 24 British towns. J Public Health Med. 2000;22:479–485. doi: 10.1093/pubmed/22.4.479. [DOI] [PubMed] [Google Scholar]
- 31.Lampe F.C., Walker M., Lennon L.T. Validity of a self- reported history of doctor-diagnosed angina. J Clin Epidemiol. 1999;52:73–81. doi: 10.1016/s0895-4356(98)00146-2. [DOI] [PubMed] [Google Scholar]
- 32.Walker M., Whincup P.H., Shaper A.G. Validation of patient recall of doctor diagnosed heart attack and stroke: a postal questionnaire and record review comparison. Am J Epidemiol. 1998;148:355–361. doi: 10.1093/oxfordjournals.aje.a009653. [DOI] [PubMed] [Google Scholar]
- 33.McMurray J.J., Adamopoulos S., Anker S.D. ESC Guidelines for the diagnosis and treatment of acute and chronic heart failure 2012: The Task Force for the Diagnosis and Treatment of Acute and Chronic Heart Failure 2012 of the European Society of Cardiology. Developed in collaboration with the Heart Failure Association (HFA) of the ESC. Eur Heart J. 2012;33:1787–1847. doi: 10.1093/eurheartj/ehs104. [DOI] [PubMed] [Google Scholar]
- 34.Taylor J.A., Christensen R.H., Rao K., Jorge M., Gottlieb S. B-type natriuretic peptide and N-terminal pro B-type natriuretic peptide are depressed in obesity despite higher left ventricular and diastolic pressures. Am Heart J. 2006;152:1071–1076. doi: 10.1016/j.ahj.2006.07.010. [DOI] [PubMed] [Google Scholar]
- 35.Loncar G., Fulster S., von Haehling Popovic. Metabolism and the heart: an overview of muscle, fat, and bone metabolism in heart failure. Int J Cardiol. 2013;162:77–85. doi: 10.1016/j.ijcard.2011.09.079. [DOI] [PubMed] [Google Scholar]
- 36.Puthoff M.L. Nielsen DH relationships among impairments in lower-extremity strength and power, functional limitations, and disability in older adults. Phys Ther. 2007;87:1334–1347. doi: 10.2522/ptj.20060176. [DOI] [PubMed] [Google Scholar]
- 37.Huang C., Niu K., Momma H., Kobayashi Y., Guan L., Nagatomi R. Inverse association between circulating adiponectin levels and skeletal muscle strength in Japanese men and women. Nutr Metab Cardiovasc Dis. Jun 17 2013 doi: 10.1016/j.numecd.2013.03.006. [DOI] [PubMed] [Google Scholar]
- 38.Wolk R., Berger P., Lennon R.J., Brilakis E.S., Johnson B.D., Somers V.K. Plasma leptin and prognosis in patients with established coronary atherosclerosis. J Am Coll Cardiol. 2004;44:1819–1824. doi: 10.1016/j.jacc.2004.07.050. [DOI] [PubMed] [Google Scholar]
- 39.Feldman A.M., Combes A., Wagner D. The role of tumour necrosis factor in the pathophysiology of heart failure. J Am Coll Cardiol. 2000;35:537–544. doi: 10.1016/s0735-1097(99)00600-2. [DOI] [PubMed] [Google Scholar]
- 40.Auwerx J., Staels B. Leptin. Lancet. 1998;351:737–741. doi: 10.1016/S0140-6736(97)06348-4. [DOI] [PubMed] [Google Scholar]
- 41.Anker S.D., Rauchhaus M. Insights into the pathogenesis of chronic heart failure:immune activation and cachexia. Curr Opin Cardiol. 1999;14:211–216. doi: 10.1097/00001573-199905000-00004. [DOI] [PubMed] [Google Scholar]
- 42.Filippatos G.S., Tsilias K., Venetsanou K. Leptin serum levels in cachectic heart failure patients. Relationship with tumor necrosis factor-alpha system. Int J Cardiol. 2000;76:117–122. doi: 10.1016/s0167-5273(00)00397-1. [DOI] [PubMed] [Google Scholar]
- 43.Procaccini C., Jirillo E., Matarese G. Leptin as an immunomodulator. Mol Aspects Med. 2012;33:35–45. doi: 10.1016/j.mam.2011.10.012. [DOI] [PubMed] [Google Scholar]
- 44.Testa G., Cacciatore F., Galizia G. Waist circumference but not body mass index predicts long term mortality in elderly subjects with chronic heart failure. J Am Geratr Soc. 2010:1433–1440. doi: 10.1111/j.1532-5415.2010.02979.x. [DOI] [PubMed] [Google Scholar]
- 45.Clark A.L., Fonarow G.C., Horwich T.B. Waist circumference, body mass index and survival in systolic heart failure: the obesity paradox revisited. J Cardiac Fail. 2011;17:374–380. doi: 10.1016/j.cardfail.2011.01.009. [DOI] [PubMed] [Google Scholar]
- 46.Bitter T., Westerheide N., Hossain S.M., Prinz C., Horskotte D., Oldenburg O. Symptoms of sleep apnoea in chronic heart failure — results from a prospective cohort study in 1500 patients. Sleep Breath. 2012;16:781–791. doi: 10.1007/s11325-011-0575-0. [DOI] [PubMed] [Google Scholar]