Abstract
We reconstruct the physiological parameters that control an avian vocal organ during birdsong production using recorded song. The procedure involves fitting the time dependent parameters of an avian vocal organ model. Computationally, the model is implemented as a dynamical system ruling the behavior of the oscillating labia that modulate the air flow during sound production, together with the equations describing the dynamics of pressure fluctuations in the vocal tract. We tested our procedure for Zebra finch song with, simultaneously recorded physiological parameters: air sac pressure and the electromyographic activity of the left and right ventral syringeal muscles. A comparison of the reconstructed instructions with measured physiological parameters during song shows a high degree of correlation. Integrating the model with reconstructed parameters leads to the synthesis of highly realistic songs.
I. INTRODUCTION
Songbirds, like humans, use learned signals to communicate. These songs are acquired from tutors during a specific time window through a process of vocal imitation. Song starts as a series of highly variable vocalizations and gradually develops into a stereotyped and individualized version of the species’ song [1]. These parallels to human speech learning have made birdsong a suitable animal model for the study of learned vocal behavior. In this model system a major focus of study has been the neural control of song learning and motor production. Yet, behavior emerges from the interaction between the nervous system, morphological structures, and the environment [2], and a thorough understanding therefore must include the interplay between central mechanisms of motor control and the peripheral systems. These interactions are particularly important in birdsong, where neural instructions drive a highly nonlinear physical system.
An interesting example is the song of the Zebra finch (Taeniopygia guttata), probably the most widely studied songbird species. The typical vocalizations of Zebra finches include spectrally rich sounds of low fundamental frequency, high frequency spectrally poor notes, as well as noisy components. Whereas details of central neural control mechanisms have been explored, [3,4] we still lack a fully operational model that allows us to advance from neural architecture to song. Seen at the level of the peripheral effector organs, the neural instructions ultimately drive the vocal organ into a regime where the labia oscillate, modulating the airflow so that sound is produced. It has been proposed that many of the acoustic features of the vocalizations found in this species are determined by the bifurcations that lead from quiet to oscillatory labial dynamics as physiological parameters are changed [5,6].
In previous work it has been shown that canaries can produce a large repertoire of sounds by controlling air sac pressure and the activity of ventral muscles in the syrinx, which is the avian phonating device [7]. The model explored in [7] was designed to produce mostly tonal sounds, and was adequate for synthesizing canary song. In fact, juvenile canaries imitated tutor syllables synthesized with this model [8]. Further tests of these simplified vocal models were presented in [9]. Time dependent parameters proportional to muscle activities and air sac pressure recordings were used to drive the models in order to synthesize recognizable songs of another species with tonal sound characteristics, the northern cardinal (Cardinalis cardinalis). Other studies suggest that a hierarchy of description of vocal control is plausible, where a few physiological instructions are enough to code several acoustic features. In [10], for instance, a model of the Zebra finch vocal organ is presented, in which parameters determining acoustic features of vocalizations are related to physiological motor gestures.
Here we present a physical model designed to synthesize Zebra finch song, with its broad range of spectral characteristics of song syllables. It includes a model for the sound source dynamics (labial oscillations), as well as a model of the upper vocal tract. It assumes simplifications that allow reduction of the number of physiologically inspired parameters needed to synthesize song. The systematic study of the dynamics presented by the model allows us to reconstruct, from a song, the time dependent parameters that are expected to drive the vocal organ during song. We test the underlying hypothesis of our model with measured physiological parameters from a singing bird.
II. MODEL
Many descriptions of voiced sound production are based on seminal work by Titze [11]. Originally proposed as a model to account for the motion of the vocal folds in humans, the description of flow induced oscillations in opposite labia is also adequate for birdsong production. Goller and Larsen [12] showed that phonation is initiated in the songbird syrinx when two soft tissue masses, the medial and lateral labia, are pushed into the bronchial lumen. Direct observation showed that sound production is always accompanied by vibratory motions of both labia, indicating that these vibrations may be the sound source.
The model assumes that for sufficiently high values of airflow, the labia start to oscillate with a wavelike motion. In order to describe this wave, it is assumed that two basic modes are active: a lateral displacement of the tissues, and a flappinglike motion resulting in an out-of-phase oscillation of the top and bottom portion of the tissue. If x is the medial position of a labium, its dynamics will be ruled by [5]
| (1) |
where the first term in the second equation is the restitution force in the labium, proposed to be nonlinear [k(x) = k + knl x2], the second term accounts for the dissipation, and the last term for the interlabial pressure (with pav standing for the average pressure between the labia). In order to express this force in terms of the dynamical variables, a kinematic description of these modes is necessary.
The half separation between the lower and upper edges of the labia (a1 and a2) are written as
| (2) |
where a01, a02 are the half separations at the resting state, and τ stands for the time it takes the wave propagating along the labium to go through half the labial vertical size. Now the average pressure between the labia pav can be written as
| (3) |
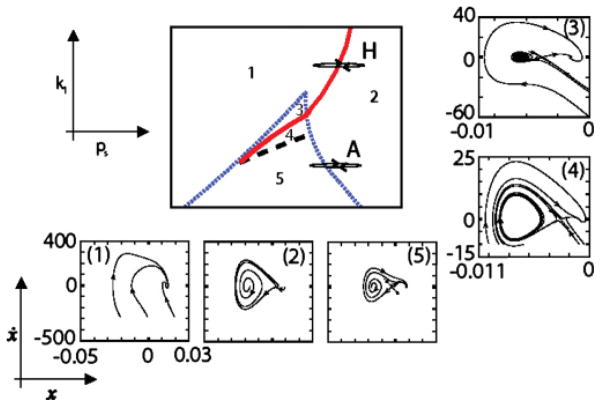
These equations allow computation of the labial dynamics as a function of time. The parameter ps stands for the subsyringeal pressure, and the strength of the linear part of the restitution force k is assumed to be proportional to the activity of the ventral syringeal muscles [10]. Different dynamical regimes are found for different regions in parameter space, as illustrated in Fig. 1.
FIG. 1.
(Color online). Bifurcation diagram and phase portraits of the physical model. The parameters are the subsyringeal pressure ps and the linear restitution coefficient k, assumed to be proportional to the activity of the syringeal muscles vS. If the parameters’ values are in region 1, only one attracting fixed point exists. In region 2 the system displays oscillations while in regions 3, 4, and 5 the system presents three fixed points, coexisting with a limit cycle for region 4. Between regions 5 and 2, a saddle node in a limit cycle bifurcation takes place, giving rise to oscillations born with infinite period (arrow A in the diagram). The dashed black line indicates a homoclinic bifurcation, the dotted blue line a saddle-node bifurcation, and the full red line a Hopf bifurcation. Figure adapted from [5].
Sound is generated as the airflow is modulated by the labial oscillations. The pressure fluctuations are filtered by the trachea and the oropharyngeal-esophageal cavity (OEC) [13]. Previous work represented the passive tract as a series of tubes [7,14]. Recently [13] a more realistic model was presented which included the oropharyngeal cavity, and it was shown that this cavity was dynamically adjusted in order to emphasize the time dependent fundamental frequency [15,16].
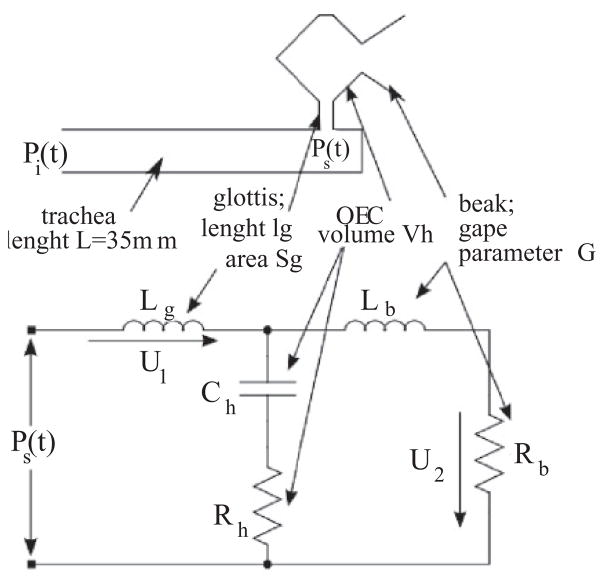
We treat the filter as a dynamical system. We approximate the tract by a tube, followed by a Helmholtz resonator representing the OEC, and a beak (see Fig. 2). The pressure at the input of the tract Pi is written as
FIG. 2.
The model includes a valve, whose dynamics is described in Fig. 1, and the passive tract illustrated in this figure, which filters the sound generated at the valve. The model of the vocal tract consists of a tube representing the trachea, a cavity which stands for the oropharyngeal cavity (approximated in this work by a Helmholtz resonator), the glottis, and a beak. The circuit illustrated at the bottom of the figure is the electric analog of the filter, describing the dynamics of a Helmholtz resonator in parallel with those that represent the aperture to the atmosphere (beak).
| (4) |
where α is proportional to the mean velocity of the flow, T is the time for the sound wave to reach the end of the tube and return, while r stands for the reflection coefficient. The transmitted pressure fluctuation, Pt (t) = (1 − r)Pi (t − 0.5T), forces the air at the glottis, which is approximated by the neck of the Helmholtz resonator representing the OEC. Assuming that the air in the glottis can be treated as a mass element mg, whose motion is quantified by a displacement variable z, we can write
| (5) |
where s stands for the stiffness of the system, R represents the dissipation coefficient of the resonator, and S stands for the glottal surface. If L′ is the effective length of the neck of the Helmholtz resonator, the fluid in it has a total mass mg = ρ0SL′. The stiffness of the resonator can be computed as follows. Consider the resonator’s neck to be fitted by a piston. Pushing this piston a distance z, the volume in the cavity is changed ΔV = −Sz, leading to a condensation Δρ/ρ = −ΔV/V = Sz/V. In this way, the pressure increase is
| (6) |
Computing the force of the piston as f = pS, we get the stiffness s = ρ0c2S2/V. In acoustics it is customary to inspect the dynamics of an equivalent electrical circuit. A resonator connected through a narrow neck is modeled as an impedance Lg in series with a capacitor Ch and a resistance Rh representing the losses in the cavity. The analog of the driving pressure Pt is a voltage, and the equivalent of the flow is the current (i) through the impedance. If the Helmholtz resonator is opened to the atmosphere (through the beak), the analog circuit is represented by an additional impedance (Lb) in series with a resistance (Rb), both elements in parallel to the capacitance [13]. This represents the driving of a mass element in the beak by the pressure of the resonator, with an impedance accounting for the inertia of this mass, and a resistance for the radiation losses. The equivalent circuit is illustrated in Fig. 2, and the equations ruling the dynamics of its variables read
| (7) |
where the relationships between the components of the electric analog and the acoustic elements are displayed in Table I [17], with Ω1 defined as the time derivative of i1, where ρ0 is the air density and c is the sound velocity. The length and area of the element a are la and Sa, respectively, which in our model stand for the beak (b) or the glottis (g). The volume of the cavity h is Vh, which stands for the volume of the Helmholtz resonator representing the OEC. The gape parameter is G. It accounts for the constriction made by the beak and the tongue combined, in such a way that the inertive term for the beak is [13]. Using the equivalence given in Table I and the physiological values estimated in [13] we derived plausible values for the parameters used in our numerical simulations (see captions of Fig. 3).
TABLE I.
Acoustic and electrical analogs.
| Impedance | Inertance | |
| L |
|
|
| Resistance | Resistance | |
| R |
|
|
| Capacitance | Compliance | |
| C |
|
FIG. 3.
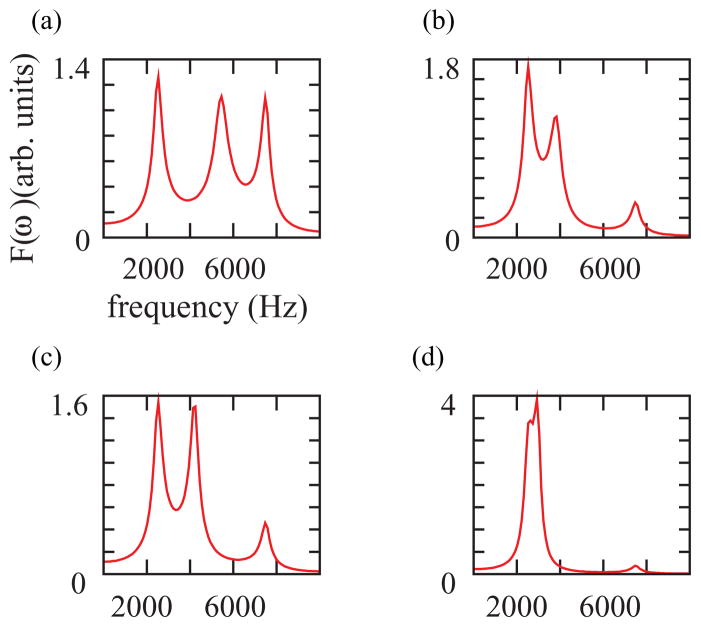
(Color online). In our model, the tract consists of a tube of 3.5 cm (closed at one end, opened at the other), followed by a Helmholtz resonator. In a 10-kHz range, the tube displays two resonances at f1 = 2.5 kHz and f2 = 7.5 kHz. The third frequency in each panel corresponds to the fundamental frequency of the Helmholtz resonator, dependent on the cavity parameters. For panel (a) and ; for panel (b) and ; for panel (c) and ; for panel (d) and . Physically, increasing the cavity decreases the resonating frequency. Other parameters were fixed in the four panels: . The parameters have units of their acoustic equivalent element.
Approximating the trachea by a closed-open tube, we can explain the ubiquitous presence of frequencies at about f1 = 2.5 kHz and f2 = 7.5 kHz in Zebra finch vocalizations. Remarkably, in the final output, the first resonance of the OEC is the dominant frequency. The value of this frequency strongly depends on the volume of the OEC and the glottal area. In Fig. 3 we display four panels with the spectra characterizing the filters, corresponding to different combinations of the parameters. The frequency between f1 and f2 in each panel of the figure corresponds to the fundamental frequency of the Helmholtz resonator. Notice that for a given value of the OEC size, increasing the glottal impedance (i.e., decreasing the glottal aperture) decreases its characteristic frequency [Figs. 3(a) and 3(b)]. On the other hand, for a given value of glottal impedance, increasing the OEC volume decreases its associated frequency. Also, the value of Rh controls the amplitude of the Helmholtz resonator’s fundamental frequency.
III. NORMAL FORMS
The song of the Zebra finch presents a wide range of spectral properties, from tonal to spectrally rich and even noisy sounds. It was reported that these spectral features are not independent of the fundamental frequency of the generated sound: low frequency sounds were systematically found to be spectrally richer than high frequency ones [6,10]. In these references, the spectral content of a segment of song was quantified via the Spectral Content Index (SCI), defined to reflect how spectral energy is distributed related to the energy content of the fundamental frequency, being its absolute minimum (SCI = 1) for pure tones. Numerical simulations of synthetic sounds generated by the model described in the previous section indicated that the fundamental frequency and spectral content of a synthesized sound were correlated. Moreover, the correlation was characteristic of the bifurcation leading to the oscillatory onset of the labia [5,10]. The need to minimize the number of parameters involved in our description suggests the reduction of the model to a normal form [18,19]: a minimal mathematical description of the dynamics capable of presenting the same bifurcation diagram as the original model [6,10,20].
We derived a standard equation which presents the bifurcation diagram of the physical model. It is a two dimensional dynamical system presenting a cusp and a Hopf bifurcation, obtained as a third order expansion around a Takens Bogdanov linear singularity [18], which reads
| (8) |
Comparing the bifurcation diagram of the model defined by Eqs. (1) (see Fig. 1) with that of the normal form defined by Eqs. (8) (see Fig. 4), we find that a proper mapping of air sac pressure and tension into the unfolding parameters allows us to recover the qualitative dynamics. In [6] the relationship was explicitly computed; the basic operations involved are (1) a translation of the values of (ps,k) where a Takens Bogdanov bifurcation takes place in the physical model to (α,β) = (0,0), (2) a multiplicative scaling, and (3) a rotation of π.
FIG. 4.
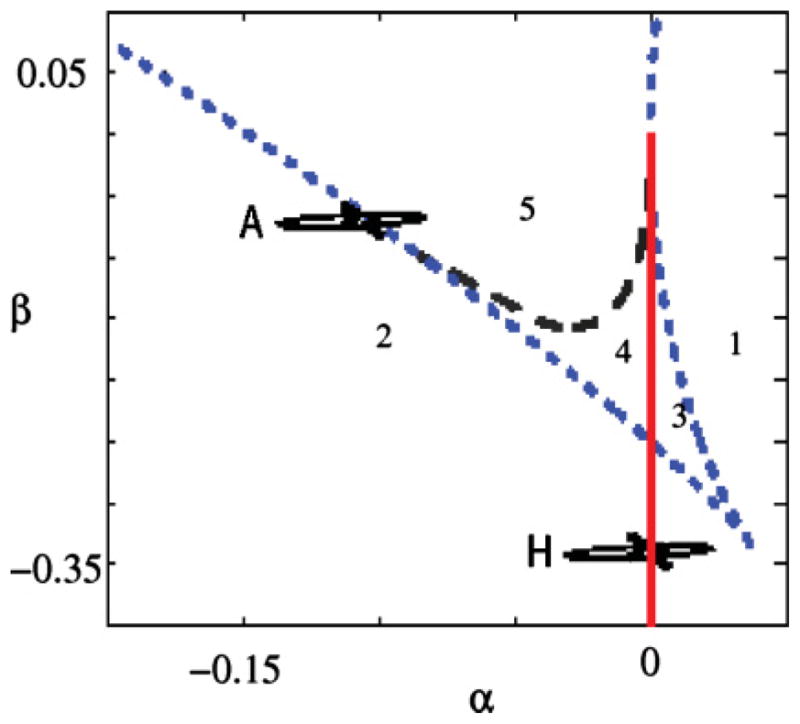
(Color online). Bifurcation diagram of the standard system described by Eqs. (8). The dynamical regimes that are necessary in our description are present in these equations. The numbers in the diagram represent the different dynamical regimes and are equivalent to the ones described in Fig. 1. The dashed black line indicates a homoclinic bifurcation, the dotted blue line a saddle-node bifurcation, and the full red line a Hopf bifurcation. The parameters in this problem are α and β, the unfolding parameters of a cubic Takens Bogdanov bifurcation. Increasing ps (k) in the diagram of Fig. 1 corresponds to decreasing α (β) in this figure.
In Fig. 1 we find, in region 1 of the parameter space, only one fixed point, which is an attractor. In region 2 we find that the fixed point is unstable against a limit cycle. Regions 3, 4, and 5, which are bounded by the saddle node curves that converge to the cusp bifurcation point, have three fixed points. From region 5 to region 2, a saddle node in a limit cycle bifurcation (SNILC) takes place, giving rise to oscillations that are born with zero frequency. From region 1 to region 2, the fixed point undergoes a Hopf bifurcation at which an oscillation is born with well defined frequency and zero amplitude. This is the dynamical scenario that we find both in Eqs. (1) and in Eqs. (8). Figures 4 and 1 display equivalent dynamics in regions labeled with equal numbers.
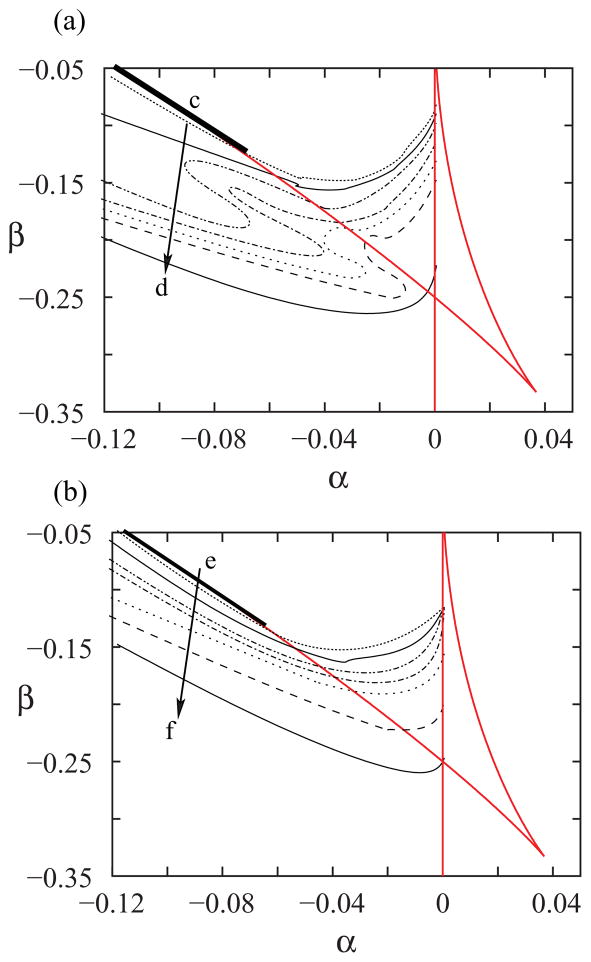
Two acoustically important features that we seek to fit with our models are the spectral richness and the fundamental frequency of the vocalizations. In Fig. 5 we display two panels, where the basic bifurcations of the normal form (saddle node curves and Hopf bifurcation curve) are displayed together with isolevel lines of the spectral content index (SCI), at the top panel, and the fundamental frequency (bottom). The isolevel curves were numerically computed, for a given value of γ. In the top panel, the isolevel curves decrease from c to d (notice that close to the saddle node in the limit cycle bifurcation line, the SCI is large). The same argument explains why the fundamental frequencies increase from e to f; at the saddle node in limit cycle bifurcation, oscillations are born with zero frequency.
FIG. 5.
(Color online). The level curves for SCI (a) and fundamental frequency (b) for the dynamical system defined by Eqs. (8). For each pair of values of α and β, numerical integrations of the dynamical model were computed, and the SCI and fundamental frequency of the solutions were found. In (a) we display a discrete set of curves. Along each one, the SCI is constant. The same is shown in (b), but the computed acoustic feature extracted from the numerical simulation is its fundamental frequency. The arrows from c to d in (a), and from e to f in (b) denote the directions along which the numerical values increase. In (a), the SCI goes from SCI = 3.5 to SCI = 1.1 for the curves displayed. In (b), the fundamental frequencies of the isofundamental frequency curves take values from 750 to 1900 Hz. The full lines in (a) and (b) represent the bifurcation diagram of the normal form. The thicker full lines stand for the lines where the SNILC bifurcations take place.
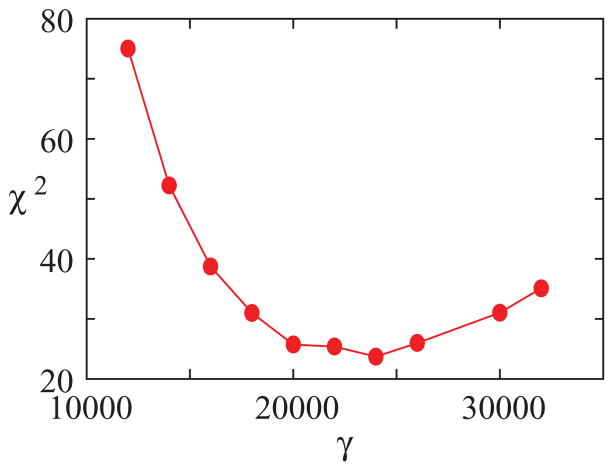
Parameter γ in the normal form stands for a time scale factor. In order to choose its value, we selected 28 segments of songs, from 28 different syllables from three different birds, which covered a wide range of frequencies. For each sound segment, we computed the fundamental frequency and the SCI. Then, for different values of γ we synthesized sounds for a large grid in the (α,β) space (100 times 100), spanning the ranges of fundamental frequencies and SCI found in the experimental data. Then, for each of the 28 experimental sound segments, we found the simulation segment of the closest fundamental frequency and computed the difference between the values of the SCI.
Adding the accumulated squared difference between experimental and synthetic SCI values over the 28 segments, we computed a number quantifying the goodness of the best fit for the given value of γ. [χ2(γ) = Σ (ISCI,exp − ISCI,syn)2, where ISCI,exp, ISCI,syn are the values of the SCI for the experimental and synthetic data segments, respectively. The sum extends over the 28 synthesized segments.]
In Fig. 6 we display these numbers for different values of γ. For γ = 24 000 we found a minimum of χ2(γ). The same calculation was performed with the sound segments of each bird separately, and for the four birds the same value of optimal γ was obtained. This optimal γ value is used in the simulations carried out in the rest of this work. The signal generated by the normal form was filtered before carrying out the computations described above. The filter consisted of a tube of 3.5 cm, followed by a Helmholtz resonator with a fundamental frequency of 4 kHz, which was the average value of the intermediate frequency between the first resonances of the tube for the 28 experimental sound segments.
FIG. 6.
(Color online). Adjusting the parameter γ in Eqs. (8). Twenty-eight sound segments, taken from the songs of four birds, were selected. The SCI and the fundamental frequency of each one were computed. Then, for a given value of γ, we searched for the best approximation of the original set of sounds, minimizing the distance between the SCI indexes and fundamental frequencies of synthetic and original sounds. For each γ, the smallest distance (measured as a χ2) is plotted. In our simulations, we fixed the time constant as γ = 24 000 since it is for this value that Zebra finch song acoustic features are best approximated by those of the synthetic sounds of our model. For each γ, and each sound segment, a matrix of 100 × 100 parameter values of α and β were explored.
IV. RECONSTRUCTION OF THE PARAMETERS FROM DATA
Once a time constant is chosen for the normal form, it is possible to reconstruct the α and β parameters that are needed in order to synthesize sound segments of given acoustic features (fundamental frequency and spectral content SCI). Carrying out this procedure for sequential sound segments, we are able to estimate the time dependent values of the physiological parameters used during the production of the song. If then we are able to measure the physiological parameters, we can compare the estimations with the measurements and use it as a test for our model.
Just as it was done in order to select the best value of γ, a song (sampled at 44.1 kHz) was decomposed into a sequence of sound segments. These segments were approximately 20 ms long, which was sufficiently short to avoid large variation in the physiological instructions but long enough to compute the observable quantities used in our description. For each segment, two acoustic features were computed: the SCI and fundamental frequency. A search in the parameter space (α,β) was performed until values were found which allow us to synthesize sounds with the most similar acoustic features plausible for the available parameter range. To do so, the fundamental frequency was computed for a grid in the (α,β) space and the set of pairs (α,β) producing synthetic sounds that match the fundamental frequency of the experimental sound was chosen (i.e., the set corresponding to the isofundamental frequency curve matching the experimental value). Within that set, the value of (α,β) that minimizes the distance in the SCI value was chosen.
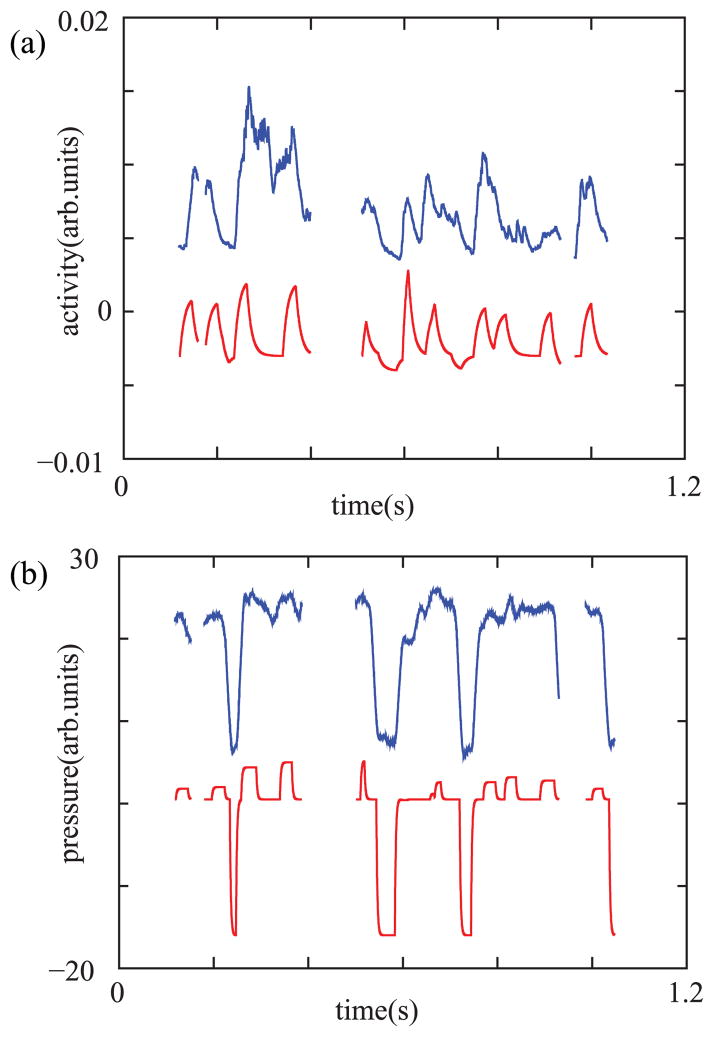
The reconstructed values of α and β were used to estimate the values of air sac pressure and activity of the ventral syringeal muscle (vS), through a change of sign [6] and multiplication by a scaling factor. The reconstructed α and β are displayed in the top and bottom parts of Fig. 7. Each of the displayed disjoint fragments consists of a continuous time trace. In order to generate each of them, first we reconstructed a discrete set of points, one each 20 ms, following the procedure described in the previous paragraph. Since physiological parameters are expected to change smoothly in time, we generated a continuous time trace from the discrete set of reconstructed points for each of the disjoint fragments. In order to obtain the continuous time trace displayed in the figure, we performed an integration of the system,
FIG. 7.
(Color online). Reconstruction of the parameters from the recorded song and comparison with measured data. In (a) we display the measured activity of the ventral muscle (top) and the reconstructed values of the parameter |β| (bottom). In (b) we show the measured air sac pressure (top) and the reconstructed values of |α| (bottom).
| (9) |
where f (t) stands either for α or β, taking a constant value in each 20 ms time interval used for the reconstruction. The chosen time scale was τ = 150 ms. The absent gestures between the reconstructed fragments correspond to either silences that occur during an expiration, or to isolated sound segments lasting less than 20 ms.
In Fig. 7 we also display the direct measurements of muscle activity and air sac pressure. In order to record the activity of the ventral syringeal muscle (vS), wire electrodes were implanted. The electrodes were prepared from insulated stainless-steel wire and secured to the tissue with a microdrop of tissue adhesive. Before closing the air sac, the wires were led out and routed to the back [21]. Simultaneously, the air sac pressure was measured by inserting a cannula into a thoracic air sac, with the other end connected to a pressure transducer [22]. The recorded values are displayed in Fig. 7, right above their respective reconstructed estimations. Although the activity of the left and right vS was recorded, we only display the activity of the right side since it is more highly correlated with the reconstructed activity.
In order to quantify the agreement between the reconstructed time series and the recorded physiological parameters we computed the correlation C(exp,syn) between the experimental and synthetic signals, which gave C = 0.72 for the muscle activity and C = 0.91 for the air sac pressure. Notice that only the activity of the right vS is illustrated. Although the activities in both right and left muscles are correlated, our reconstructed β presented a higher correlation with the activity displayed in Fig. 7[C(β,vSrigth) = 0.72 > C(β,vSleft) = 0.56, where vSrigth and vSleft are the activities of the right and left vS muscles]. In this work we aim at reconstructing the parameters that would control one sound source to produce utterances of given spectral features. The high correlation between β and the activity of the right vS is likely to be due to the fact that the right side is involved both during the production of high frequency sounds (for which only the right side is used), as well as during the production of low frequency sounds (where both sides can be active). It is worth noting that the left side is never active alone [23].
We went beyond the reconstruction of the parameters. We repeated the procedure described above and used the reconstructed parameters to drive the model of the syrinx in order to generate a synthetic song. Both the original, recorded song and the synthesis carried out are displayed in Fig. 8, and the sound files are available as Supplemental Material [24].
FIG. 8.
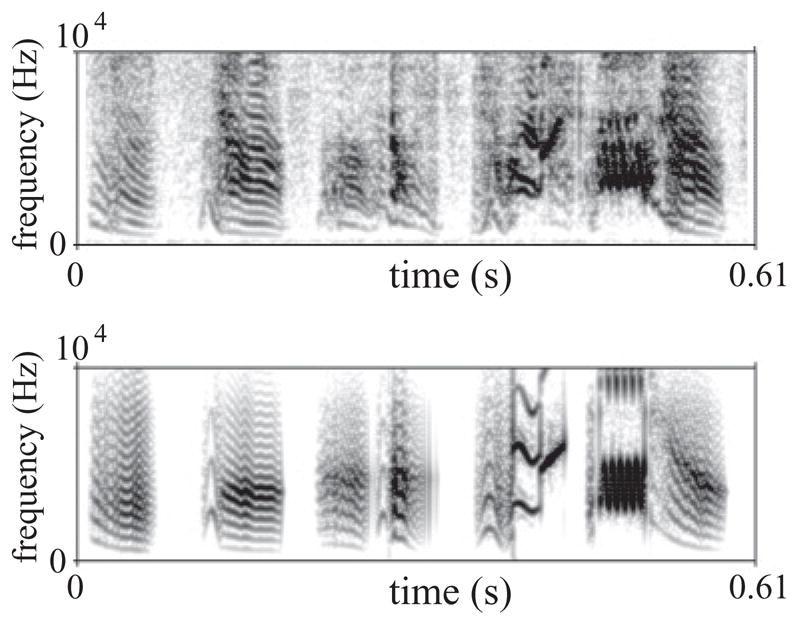
Recorded and synthetic song. After reconstructing the parameters as indicated in the text, those were used to drive the model in order to synthesize a song. The panels display a sonogram of the recorded sound (top) and synthetic sound (bottom). See Supplemental Material for the audio files [24].
These simulations were performed with white noise added to the parameter representing the activity of the ventral muscle. This improved the timbric quality of the synthesized song. The rationale behind this inclusion can be traced to Fig. 7. In order to obtain a measure of muscle activity from EMG data, the envelope of the rectified signal is reconstructed. This is usually performed by solving Eq. (9), with f (t) the rectified time trace [25,26]. Choosing τ as the larger real such that the envelope and the frequency are positively correlated for all the syllables (in this case, τ = 150 ms), we end up with an envelope that still has some small amplitude, rapid fluctuations. These are modeled as noise in the parameter β of our model.
V. DISCUSSION
It is not obvious that a complex behavior like birdsong can be reconstructed using a reductionist approach typical in physics. We model the physical song production system by means of a normal form representing the dynamics of the sound source, a tube, and a box. This simple model allows realistic synthesis of a complex song as it is found in Zebra finches. Moreover, the successful reconstruction of the parameters and the realistic synthesized song generated with reconstructed parameters suggests that for this species’ song, the chosen number of parameters is sensible [14,22].
It is interesting that the reconstruction of the parameters in our model lead to a nontrivial time dependence of the parameter corresponding to the air sac pressure, with fluctuations that can be clearly identified in the recorded data. This suggests that air sac pressure does play a role beyond turning the oscillations on. According to the model, the pressure is an important parameter associated to frequency control, particularly for low frequency sounds. Dynamically, this is the result of operating close to a saddle node bifurcation in a limit cycle. Our results are consistent with this interpretation, although no direct evidence has yet been provided for this mechanism in oscine birds. On the other hand, in suboscine birds, an example of frequency modulation due to the air sac pressure has been reported [27].
The best correlation between the reconstructed parameter representing syringeal tension and the experimental data was obtained with the activity of the right vS. The correlation coefficient for vS were generally lower than the values obtained for the air sac pressure. Perhaps this is not surprising, because the details of all acoustic features are most likely controlled by the synergistic action of syringeal muscles and not only the vS. Yet, the high value of the correlation indicates that even with this simplification, the vS is largely responsible for controlling the tension of the oscillating labia, as has been hypothesized in the construction of our model [23]. Other phenomena, such as source-source interaction [28], or the interaction between the sound source and the upper vocal tract [20,29,30], were not included in our model. This simplification proved not to be an obstacle for successful reconstruction of parameters. This indicates that these effects might not play a major role in determining the main acoustic features of Zebra finch song. Because we fit sounds using the dynamics of just one source, it is reasonable that we obtained the best fit with the muscle instruction of the side which is active during most of the song (the right side in this species) [23].
Beyond time dependent physiological parameters, we included some important anatomical features in our description, allowing us to improve the timbric quality of the synthesized sound. We included a tract and a Helmholtz resonator representing the trachea and the OEC, respectively. This allowed us to account for the ubiquitous dominant frequencies at 2.5 and 7.5 kHz found in Zebra finch song, as well as an additional spectral peak frequency between these two, often at around 4 kHz.
In summary, we found that it is possible to build a simple model that can reproduce the large variation in spectral features of Zebra finch song. The model, which is capable of synthesizing realistic song, contains both parameters that were assumed to be fixed for the species and computed from the data of many birds, as well as others which were assumed to change depending on the syntax used by the individual. These were successfully compared with physiological measurements, building confidence in the general applicability of the model and its underlying hypotheses.
Supplementary Material
Acknowledgments
This project was funded by NIH (Grant No. RO1-DC-006876), CONICET, HFSP (LT000735/2009), and UBA. We thank T. Riede for useful comments.
References
- 1.Zeigler P, Marler P. Neuroscience of Birdsong. Cambridge University Press; Cambridge, MA: 2008. [Google Scholar]
- 2.Chiel H, Beer R. Trends Neurosci. 1997;20:553. doi: 10.1016/s0166-2236(97)01149-1. [DOI] [PubMed] [Google Scholar]
- 3.Chi Z, Margoliash D. Neuron. 2001;32:899. doi: 10.1016/s0896-6273(01)00524-4. [DOI] [PubMed] [Google Scholar]
- 4.Leonardo A, Fee M. J Neurosci. 2005;25:652. doi: 10.1523/JNEUROSCI.3036-04.2005. [DOI] [PMC free article] [PubMed] [Google Scholar]
- 5.Amador A, Mindlin GB. Chaos. 2008;18:043123. doi: 10.1063/1.3041023. [DOI] [PubMed] [Google Scholar]
- 6.Sitt JD, Arneodo EM, Goller F, Mindlin GB. Phys Rev E. 2010;81:031927. doi: 10.1103/PhysRevE.81.031927. [DOI] [PubMed] [Google Scholar]
- 7.Gardner T, Cecchi G, Magnasco M, Laje R, Mindlin GB. Phys Rev Lett. 2001;87:208101. doi: 10.1103/PhysRevLett.87.208101. [DOI] [PubMed] [Google Scholar]
- 8.Gardner T, Naef F, Nottebohm F. Science. 2005;308:1046. doi: 10.1126/science.1108214. [DOI] [PubMed] [Google Scholar]
- 9.Mindlin GB, Gardner TJ, Goller F, Suthers R. Phys Rev E. 2003;68:041908. doi: 10.1103/PhysRevE.68.041908. [DOI] [PubMed] [Google Scholar]
- 10.Sitt JD, Amador A, Goller F, Mindlin GB. Phys Rev E. 2008;78:011905. doi: 10.1103/PhysRevE.78.011905. [DOI] [PubMed] [Google Scholar]
- 11.Titze IR. J Acoust Soc Am. 1988;83:1536. doi: 10.1121/1.395910. [DOI] [PubMed] [Google Scholar]
- 12.Goller F, Larsen ON. Proc Natl Acad Sci USA. 1997;94:14787. doi: 10.1073/pnas.94.26.14787. [DOI] [PMC free article] [PubMed] [Google Scholar]
- 13.Fletcher NH, Riede T, Suthers RA. J Acoust Soc Am. 2006;119:1005. doi: 10.1121/1.2159434. [DOI] [PubMed] [Google Scholar]
- 14.Laje R, Gardner TJ, Mindlin GB. Phys Rev E. 2002;65:051921. doi: 10.1103/PhysRevE.65.051921. [DOI] [PubMed] [Google Scholar]
- 15.Riede T, Suthers R. J Comp Physiol A. 2009;195:183. doi: 10.1007/s00359-008-0397-0. [DOI] [PMC free article] [PubMed] [Google Scholar]
- 16.Ohms V, Snelderwaard P, ten Cate C, Beckers G. PloS One. 2010;5:e11923. doi: 10.1371/journal.pone.0011923. [DOI] [PMC free article] [PubMed] [Google Scholar]
- 17.Kinsler L, Frey A, Coppens A, Sanders J. Fundamentals of Acoustics. Wiley; New York: 1982. [Google Scholar]
- 18.Guckenheimer J, Holmes P. Nonlinear Oscillations, Dynamical Systems, and Bifurcations of Vector Fields. Vol. 42 Springer-Verlag; New York: 1990. [Google Scholar]
- 19.Strogatz SH. Nonlinear Dynamics and Chaos. Perseus; Cambridge, MA: 2000. [Google Scholar]
- 20.Lucero J, Ruty N, Pelorson X. 17th International Congress on Sound & Vibration. 2010 [Google Scholar]
- 21.Goller F, Suthers RA. J Neurophysiol. 1996;76:287. doi: 10.1152/jn.1996.76.1.287. [DOI] [PubMed] [Google Scholar]
- 22.Suthers RA, Margoliash D. Curr Opin Neurobiol. 2002;12:684. doi: 10.1016/s0959-4388(02)00386-0. [DOI] [PubMed] [Google Scholar]
- 23.Goller F, Cooper BG. Ann NY Acad Sci. 2004;1016:130. doi: 10.1196/annals.1298.009. [DOI] [PubMed] [Google Scholar]
- 24.See Supplemental Material at http://link.aps.org/supplemental/10.1103/PhysRevE.84.051909 for the audio files of the recorded and synthetic song of a Zebra finch.
- 25.Mindlin GB, Gardner TJ, Goller F, Suthers R. Phys Rev E. 2003;68:041908. doi: 10.1103/PhysRevE.68.041908. [DOI] [PubMed] [Google Scholar]
- 26.Keynes R, Aidley D. Nerve and Muscle. Cambridge University Press; New York: 2001. [Google Scholar]
- 27.Amador A, Goller F, Mindlin G. J Neurophysiol. 2008;99:2383. doi: 10.1152/jn.01002.2007. [DOI] [PubMed] [Google Scholar]
- 28.Laje R, Mindlin GB. Phys Rev E. 2005;72:036218. doi: 10.1103/PhysRevE.72.036218. [DOI] [PubMed] [Google Scholar]
- 29.Arneodo E, Perl YS, Mindlin G. Phys Rev E. 2011;83:041920. doi: 10.1103/PhysRevE.83.041920. [DOI] [PMC free article] [PubMed] [Google Scholar]
- 30.Arneodo EM, Mindlin GB. Phys Rev E. 2009;79:61921. doi: 10.1103/PhysRevE.79.061921. [DOI] [PubMed] [Google Scholar]
Associated Data
This section collects any data citations, data availability statements, or supplementary materials included in this article.


