Abstract
Differential expression of long non-coding RNAs (lncRNAs) plays critical roles in hepatocarcinogenesis. Considerable attention has focused on the antitumor effect of histone deacetylase inhibitor (Trichostatin A, TSA) as well as the coding gene expression-induced apoptosis of cancer cells. However, it is not known whether lncRNA has a role in TSA-induced apoptosis of human hepatocellular carcinoma (HCC) cells. The global expression of lncRNAs and coding genes was analyzed with the Human LncRNA Array V2.0 after 24 h treatment. Expression was verified in cell lines and tissues by quantitative real-time PCR. The data showed that 4.8% (959) of lncRNA and 6.1% (1849) of protein coding gene were significantly differentially expressed. The differential expressions of lncRNA and protein coding genes had distinguishable hierarchical clustering expression profiling pattern. Among these differentially expressed lncRNAs, the greatest change was noted for uc002mbe.2, which had more than 300 folds induction upon TSA treatment. TSA selectively induced uc002mbe.2 in four studied HCC cell lines. Compared with normal human hepatocytes and adjacent noncancerous tissues, uc002mbe.2 expression level was significantly lower in the HCC cell lines and liver cancer tissues. The TSA-induced uc002mbe.2 expression was positively correlated with the apoptotic effect of TSA in HCC cells. In addition, knockdown the expression of uc002mbe.2 significantly reduced TSA-induced apoptosis of Huh7cells. Therefore, TSA-induced apoptosis of HCC cells is uc002mbe.2 dependent and reduced expression of uc002mbe.2 may be associated with liver carcinogenesis.
Keywords: Long noncoding RNA, Histone deacetylase inhibitor, Hepatocellular carcinoma, Liver, Liver cancer
1. Introduction
Hepatocellular carcinoma (HCC) is a prevalent liver malignancy with poor prognosis. It is the third most common cause of cancer-related mortality in the world [1–3]. Extensive research has been done in the past several decades to understand the mechanism underlying the pathogenesis of liver cancer with a focus on protein coding genes. However, the precise mechanisms underlying liver carcinogenesis are still not well known and the therapeutic success of using pharmacological treatment is limited [1,3]. Therefore, there is an urgent need to identify novel therapeutic targets in order to develop new intervention.
Histone deacetylases (HDAC) play a fundamental role in regulating gene expression and chromatin assembly through catalyzing the removal of acetyl groups leading to chromatin condensation and transcriptional repression. De-regulated HDAC activity is associated with tumorigenesis and the progression of cancer [4,5]. HDAC are found overexpressed in HCC, and aberrant HDAC activity plays an important role in HCC pathogenesis [6–8]. Thus, targeting HDAC can be a therapeutic strategy to treat HCC. We and others have shown that histone deacetylase inhibitors (HDACi) such as Trichostatin A (TSA) and scriptaid have anti-tumor effect by inducing apoptosis of HCC in vitro and in vivo [9–11]. HDACi induces apoptosis, differentiation, and/or cell-cycle arrest in different cancer cells and the anticancer activity can be achieved by different mechanisms [12,13]. HDACi induced-transcriptional reprogramming was seen to contribute largely to their therapeutic benefits on cancer treatments. However, only a very low percentage of protein-coding genes are affected by the action of HDACi, and the molecular mechanisms by which the expressions are altered are not fully understood [12,14].
Recent studies revealed that protein-coding genes only account for less than 2% of the human genome, whereas a much greater proportion of the human genome is transcribed into non-coding RNAs (ncRNAs) [15–17]. Long non-coding RNAs (lncRNAs) are identified as a new class of functional RNAs. They are transcribed molecules greater than 200 nucleotides that lack protein-coding capacity [18,19], but have many molecular functions. LncRNAs can act as tumor oncogenes or tumor suppressors just like protein coding genes. Growing evidences demonstrated that lncRNAs play a crucial role in the modulations of tumor behavior through various complex mechanisms such as modulating gene transcription and epigenetic signaling [20–22]. Recent studies indicated that aberrant expression of lncRNAs was associated with cell cycle, apoptosis, and tumor growth in HCC, which made it possible to use these lncRNA as new molecular diagnostic and prognostic markers as well as therapy targets [23–26]. So far, it is not known whether lncRNA plays a role in HDACi-induced apoptosis of HCC cells.
The goals of current study are to examine the effect of HDACi TSA on lncRNA and coding gene expression profiles in HCC cells and to elucidate the role of lncRNAs in TSA-induced apoptosis. We showed that 4.8% (959) of lncRNA and 6.1% (1849) of protein coding gene were significantly differentially expressed upon TSA treatment of Huh7 cells. The differential expressions of lncRNA and protein coding genes had a hierarchical clustering expression profiling pattern. The data, for the first time, provided direct evidence that a novel lncRNA uc002mbe.2 has potential tumor suppressive effect and is involved in mediating the apoptotic effect of TSA in human liver cancer cells.
2. Materials and methods
2.1. Reagents
All reagents and chemicals used were from Sigma–Aldrich (St. Louis, MO) unless noted otherwise. TRIzol reagent and Lipofectamine2000 Transfection Reagent were purchased from Invitrogen (Carlsbad, CA). The Prime Script RT Reagent Kit and SYBR Premix Ex Taw were purchased from TaKaRa (Dalian, China). The MTT Cell Proliferation and Cytotoxicity Detection Kit was purchased from Calbiochem (San Diego, CA). In situ Cell Death Detection Kit were purchased from Roche Applied Science (Indianapolis, IN).
2.2. Cell cultures and treatment
Human liver cancer cell lines Huh7, Bel7402, Bel7721, and HepG2 were cultured in Dulbecco’s Modification of Eagle’s Medium (Mediatech, Herndon, VA). The medium was supplemented with 10% charcoal-stripped fetal bovine serum (FBS) (Atlanta Biologicals Lawrenceville, GA) and 1% penicillin/streptomycin (Invitrogen, Carlsbad, CA). Human hepatocytes were purchased from CellzDirect and cultured according to our previous publications [9,10]. The cells were cultured with DMSO or TSA (1 μM) in media for each studied time point. The final concentration of DMSO in the culture medium was 0.1% in all treatments.
2.3. RNA preparation and microarray analysis
Total RNA from four independent DMSO or TSA treated Huh7 cells were isolated using Trizol and treated with DNase I (Invitrogen, Carlsbad, CA). The RNA integrity was assessed by denatured agarose gel. Human LncRNA Microarray V2.0 (Arraystar, Rocville, MD) was used to study the global profiling of human lncRNAs and protein-coding transcripts in the Huh7 cells. The microarray contained 33,045 lncRNAs and 30,215 coding transcripts. Each sample was amplified and transcribed into fluorescent cRNA along with the entire length of the transcripts without 3′ bias utilizing a random priming method. The labeled cRNAs were hybridized onto the Human LncRNA Array V2.0 (Arraystar, Rocville, MD). After extensive washing, the arrays were scanned by the Agilent Scanner G2505B. The raw data were extracted as pair files using Agilent Feature Extraction software (version 10.7.3.1). The GeneSpringGXv11.5.1 software package (Agilent Technologies) offered quantile normalization and background correction. Heat Map and Unsupervised Hierarchical Clustering was performed based on their expression levels using Cluster_-Treeview software (Palo Alto, CA). GO analysis from Gene Ontology (http://www.geneontology.org) was used for analyzing the interactions between lncRNA and coding genes in TSA-induced apoptosis of Huh7cells [27].
2.4. The defined category of lncRNA
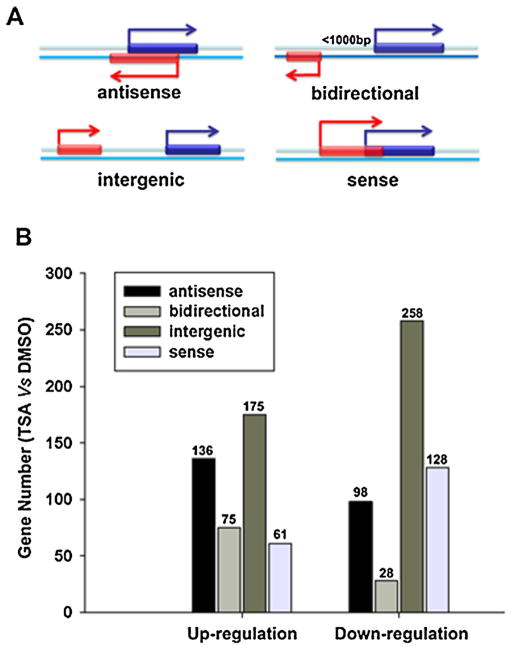
The category of lncRNA was determined by the genomic location relative to the coding gene [28–30]. The categories were defined as sense, intergenic, antisense, and bidirectional lncRNA. A sense lncRNA is defined when an lncRNA exon overlaps with a coding transcript exon on the same genomic strand. A bidirectional lncRNA is when an lncRNA is oriented head-to-tail to a coding transcript within 1000 bp. The lncRNA that is transcribed from the antisense strand and that is overlapped with a coding transcript is defined as antisense lncRNA. Intergenic lncRNA is when there is no overlapping or bidirectional coding transcripts near the lncRNA.
2.5. Human tissue samples
Thirty HCC samples and their corresponding adjacent noncancerous liver tissues were collected from the First Municipal’s People Hospital of Guangzhou, Guangzhou Medical University. Human tissues were immediately frozen in liquid nitrogen and stored at −80 °C freezer until usage. The human subject protocol was approved by the Clinical Research Ethics Committee of Guangzhou Medical University. Written consent was obtained from each patient.
2.6. RNA extraction and quantitative real-time PCR
Total RNA from liver specimens and cultured cells were isolated using Trizol and treated with DNase I (Invitrogen, Carlsbad, CA). Briefly, quantitative real-time PCR was carried out to study lncRNA expression using the Prime Script RT Reagent Kit (TaKaRa, Dalian, China) and SYBR Premix Ex Taq (TaKaRa, Dalian, China). Real-time PCR was conducted using the ABI Prism 7300 real-time PCR system (Applied Biosystems, Foster City, CA). The quantification analysis for target gene expression was performed using the relative quantification comparative CT method. Primers are listed in Table 1.
Table 1.
Oligonucleotide sequences of the quantitative real-time RT-PCR Primers.
| Primer name | Sequence (5′ → 3′) |
|---|---|
| GAPDH | F: 5-CTTTGGTATCGTGGAAGGACTC-3 R: 5-CAGTAGAGGCAGGGATGATGTT-3 |
| uc003klp.2 | F: 5-GCAAGGCAATGCTGAAGA-3 R: 5-TTCCGTGATGCAGTTTGAT-3 |
| AK056249 | F: 5-CAGGGATAAAGGAAAAGTCAA-3 R: 5-GCAAGCCATTCTTATGGATAG-3 |
| NR_024274 | F: 5-TCATCATTTTAACCGCATTTC-3 R: 5-TGTCAACATTTATTGAGCACCTAT-3 |
| ENST00000513467 | F: 5-CGGTGACTGTTTCCTTATTGG-3 R: 5-AGAGTTGAACGAAAGTGCTGG-3 |
| HIT000047782 | F: 5-TTCCGGGTTCAAGCGAGTC-3 R: 5-ATGGTGGCGGGCATCTGT-3 |
| BC041954 | F: 5-CGTGGCGCACTGAACTTG-3 R: 5-CCGGCCCACTGTTTGAAT-3 |
| uc002mbe.2 | F: 5-TTGTCTCCCTGTTACACTGTGA-3 R: 5-GGTTTATTCTTTGATGCCTTTAT-3 |
| HULC | F: 5-ACCTCCAGAACTGTGATCCAAAATG-3 R: 5-TCTTGCTTGATGCTTTGGTCTG-3 |
2.7. Plasmid constructs and transfection
ShRNA fragment targeting different uc002mbe.2 lncRNA site was designed according to the human uc002mbe.2lncRNA sequence (Chromosome 19; NC_000019.9: 4769117-4772568), synthesized, and inserted into the psuperpGPU6/Neo vector (GenePharma Co., Shanghai, China). The pGPU6/Neo-negative control vector that contains a shRNA sequence with no homology to any other human gene was used as a negative control. The shRNA plasmid was transformed into Escherichia coli for screening. The identity of the recombinant plasmids was confirmed by sequencing. Cell transfection was carried out with a Lipofectamine™ 2000 (Invitrogen, Carlsbad, CA) with indicated shRNA-expressing plasmids. Cells were harvested 48 h post-transfection to evaluate the efficiency of uc002mbe.2 lncRNA knockdown by quantitative real-time PCR.
2.8. Cell viability assays
After 48 h of shRNA plasmid transfection in 96-well culture plate, cells were incubated with or without TSA (1 μM) in medium for 24 h followed by detecting cell viability using the MTT Cell Proliferation and Cytotoxicity Detection Kit (Calbiochem, San Diego, CA). After treatment, 1 mg/ml of MTT was added to culture plates and incubated at 37 °C for an additional 4 h. Then, cells were lysed in DMSO (100 μl). The absorbance at 550 nm was measured on a plate reader. Each experiment was performed in triplicate and repeated three times.
2.9. Terminal deoxynucleotidyltransferased UTP nick end labeling (TUNEL) assay
After 48 h of shRNA plasmid transfection, cells were incubated with or without TSA (1 μM) in medium for 24 h followed by TUNEL staining using an in situ cell death detection kit (Roche Applied Science, Indianapolis, IN), which was described previously [31]. TUNEL positive cells were examined under a light microscope.
2.10. Statistical analysis
Differentially expressed lncRNAs and mRNAs with statistical significance were identified through Volcano Plot filtering. The fold change (≥2.0, p-value ≤ 0.05) was set for up- and down-regulated genes threshold. Data are presented as mean ± SD. Statistical analysis was performed using Student’s t-test for two-group comparison. Significance was defined by p < 0.05.
3. Results
3.1. Global profiling of lncRNAs and coding genes in TSA-treated Huh7 cells
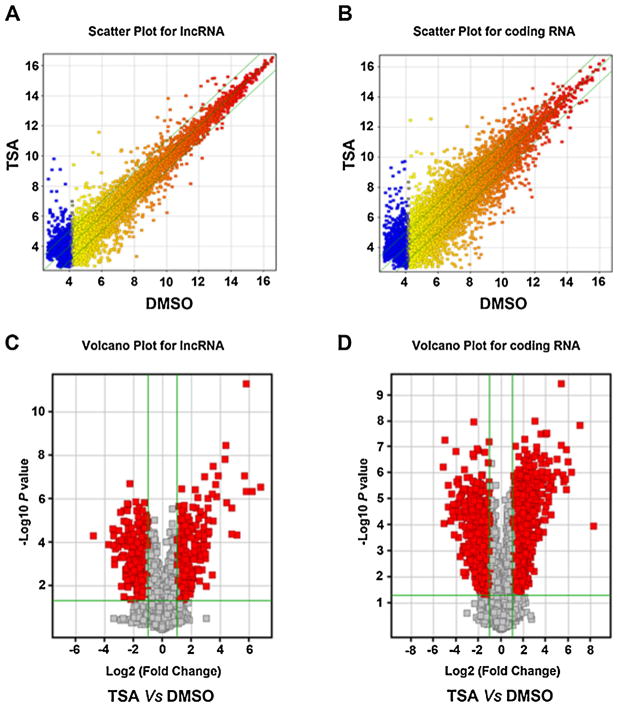
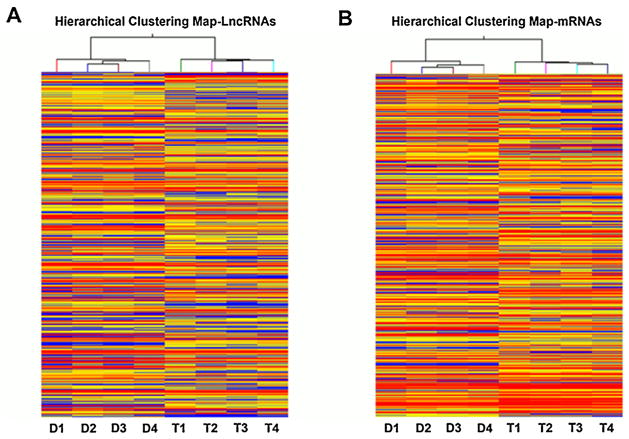
In our previous study, we determined that 1 μM TSA could reduce about 20% viability of Huh7 cell and increase histone acetylation in 24 h [9,10]. The same dose and treatment time were used in the current study to determine the role of lncRNA in TSA-induced apoptosis of HCC cells. To examine expression profiles of lncRNAs and coding genes, we used a custom microarray containing 33,045 lncRNAs and 30,215 coding genes (Arraystar Human LncRNAMicroarrayV2.0). Scatter plot and Volcano Plot analysis are shown in (Fig. 1). The scatter plot is a visualization method that is useful for assessing the reproducibility between chips. Data indicated that 60.5% of lncRNA and 59.4% of coding gene were expressed above the background level (Table 2). Volcano Plots are useful tools for visualizing differential expression between two different conditions. They are constructed using fold-change values and p-values, and thus allow visualization of the relationship between the magnitude of change and the statistical significance. To identify differentially expressed lncRNAs and coding genes, Volcano Plot analysis was done to study the difference between treatment and control groups. Data showed that 4.8% (959) of lncRNAs and 6.1% (1849) of coding genes were significantly expressed (Table 2). These significantly expressed lncRNAs and coding genes passed the stringent data filtration steps and Volcano Plot filtering. Cluster analysis group samples based on their expression levels suggested relationships among samples. To investigate the expression patterns of lncRNAs and coding genes, hierarchical clustering was performed to analyze gene expression in TSA-induced apoptosis of Huh7 cells. The data showed a distinguishable lncRNA and coding gene expression profiling pattern between TSA-treated and control groups (Fig. 2).
Fig. 1.
Profiling of TSA-regulated lncRNA and coding gene RNA. Total RNA from four independent DMSO or TSA treated Huh7 cells (24 h) was isolated to study gene expression by Human LncRNA Microarray V2.0. The Scatter-Plot is used for assessing lncRNA (A) and coding gene RNA (B) expression reproducibility. The values of x and y axis in the Scatter-Plot are the averaged normalized signal values of groups of samples (log 2 scaled). Volcano Plot analysis of the microarray Chip data on the differentially expressed lncRNA (C) and coding gene (D) between the TSA treated and control group. The vertical green lines correspond to a 2.0 fold up and down regulation while the horizontal green line represents a p-value of 0.05. The red dots to the left and to the right of the vertical green lines indicate more than a 2.0 fold change and represent the differentially expressed genes with statistical significance. Statistical significance was defined as fold change ≥2.0 and p-value ≤ 0.05 between TSA treated and control (DMSO) groups.
Table 2.
Summary of microarray data.
| Probe class | Total | Expressed above background | Differentially expressed |
|---|---|---|---|
| LncRNA | 33,045 | 19,985 (60.5%) | 959 (4.8%) |
| Coding | 30,215 | 17,961 (59.4%) | 1849 (6.1%) |
Differentially expressed LncRNAs and mRNA with statistical significance that passed Volcano Plot filtering (fold change ≥2.0, p-value ≤0.05).
Fig. 2.
Heat map presentation of the expression profile of lncRNA and coding gene. Hierarchical Clustering analyzed lncRNAs (A) and coding genes (B) in DMSO and TSA treated Huh7 cells. Each column represents a sample and each row represents a gene. High relative expression is indicated by red color and low relative expression is indicated by blue color. D1-4: four independent DMSO treatment, T1-4: four independent TSA treatment.
3.2. The differentially expressed lncRNAs and interacting coding genes in TSA-induced apoptosis of Huh7cells
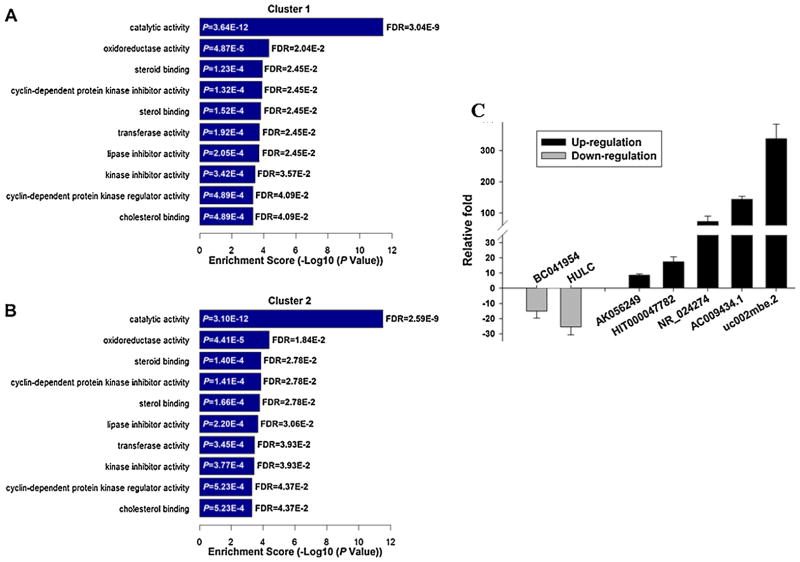
LncRNAs were grouped into sense, intergenic, antisense, and bidirectional lncRNA according to their genomic relationship with coding genes (Fig. 3A). The number of up-regulated lncRNAs was 447 including 30.4% (136 of 447) antisense, 16.8% (75 of 447) bidirectional, 39.1% (175 of 447) intergenic, and 13.6% (61 of 447) sense lncRNA. While, the number of down-regulated lncRNAs was 512, which included 19.1% (98 of 512) antisense, 5.5% (28 of 512) bidirectional, 50.4% (258 of 512) intergenic, and 25% (128 of 512) sense lncRNA (Fig. 3B). Based on the coding and lncRNA gene expression profiles, the co-expression relationship between coding-lncRNA pair was evaluated by Fisher’s asymptotic test adjusted with the Bonferroni multiple tests. Co-expression relationships with a p-value of 0.01 or less and within a given percentile were regarded as co-expressed. To further annotate the functional interaction in the co-expression of lncRNA and coding genes, two Gene Ontology (GO) analyses were performed. One analysis connected one coding gene to at least three lncRNAs (Fig. 4A), and the other connected one lncRNA to at least three coding genes (Fig. 4B). The bar graphs show the top ten enrichment score values of the significant enrichment molecular function terms. GO analysis of co-expressed lncRNA and coding genes showed preferential enrichment for genes that have catalytic activity, oxidoreductase activity, and cyclin-dependent protein kinase inhibitor activity. To further analyze gene expression changes induced by TSA, quantitative real-time RT-PCR was performed to confirm the microarray data. The lncRNA genes, which showed greater than 20-fold changes in their expression level, were selected from the GO analysis of coordinated expression between lncRNA and coding genes. The expression levels of AKO56249, HIT000047782, NR_024274, AC009434.1, uc003klp.2, and uc002mbe.2 were significantly increased while genes including BCO41954 and highly up-regulated in liver cancer (HULC) were significantly decreased (Fig. 4C). Differential expression of the selected genes was consistent with the microarray data. The functions of these lncRNA genes are mostly unknown. HULC is highly up-regulated in liver cancer, which is involved in HBx-related hepatocarcinogenesis and liver cancer progression [26,32]. Additional study is needed to understand the functions of HULC in TSA-induced Huh7 cells apoptosis. However, the greatest change was noted for uc002mbe.2, whose expression level increased by about 300-fold upon TSA treatment. Thus, we further studied the role of uc002mbe.2, which is an intergenic lncRNA.
Fig. 3.
The categorized lncRNA and distribution of the differentially expressed lncRNAs in DMSO and TSA treated Huh7 cells. (A) A diagram of the categorized lncRNA. LncRNA was categorized as sense, intergenic, antisense, and bidirectional transcript. (B) The number of lncRNAs regulated by TSA in Huh7 cells.
Fig. 4.
Gene Oncology analysis of lncRNAs-associated with coding genes.
(A) GO analysis of coding genes in which one coding gene is connected to at least three lncRNAs. (B) GO analysis of coding genes in which an lncRNA is connected to at least three mRNAs. The top ten significantly enriched molecular functions along with their scores are listed as the x-axis and the y-axis, respectively, in both (A) and (B). (C) The microarray data was further confirmed by real-time PCR. LncRNA expression level was normalized to the level of GAPDH mRNA. The data shown were relative fold induction (TSA vs. DMSO treatment) at 24 h treatment. Each column represents fold change between TSA and DMSO treated groups with standard error. This experiment was repeated three times.
3.3. Differential effects of TSA on uc002mbe.2 expression in HCC cell lines and normal human hepatocytes
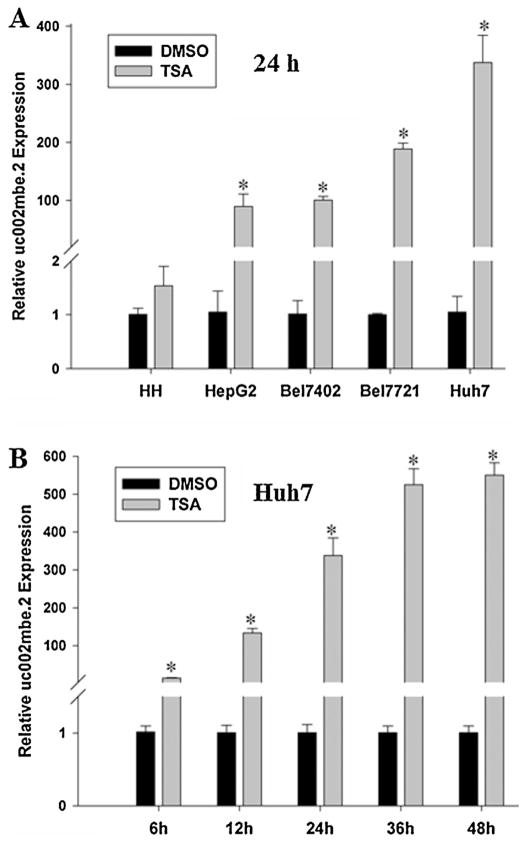
To assess the effect of TSA on uc002mbe.2 expression in HCC cell lines and human hepatocytes, uc002mbe.2 expression was quantitated by real-time PCR. The data demonstrated that TSA induced uc002mbe.2 in four studied human HCC cell lines (Huh7, Bel7402, Bel7721, and HepG2), but not in normal human hepatocytes (Fig. 5A). Among the four HCC cell lines, Huh7 cells had the highest induction of uc002mbe.2 lncRNA levels. In addition, the induction of uc002mbe.2 lncRNA in Huh7 cells was time dependent; it occurred within 6 h after TSA treatment. Moreover, the fold induction of uc002mbe.2 was not different in cells treated by TSA for 36 h and 48 h (Fig. 5B).
Fig. 5.
Differential effects of TSA on uc002mbe.2 expression in HCC cell lines and human hepatocytes. (A) TSA induced uc002mbe.2 level in HCC cells, but not in human hepatocytes. (B) The induction of uc002mbe.2 level in Huh7 cells is time dependent. HCC cells and human hepatocytes were treated with DMSO or TSA (1 μM) for indicated time periods. Real-time PCR was used to quantify uc002mbe.2 level, which was normalized to the level of GAPDH mRNA. The data shown were relative fold induction (TSA vs. DMSO treatment) at each time point. This experiment was repeated three times.*p < 0.01, vs. DMSO treatment group.
3.4. uc002mbe.2 is deregulated in HCC cell lines and human HCC tissues
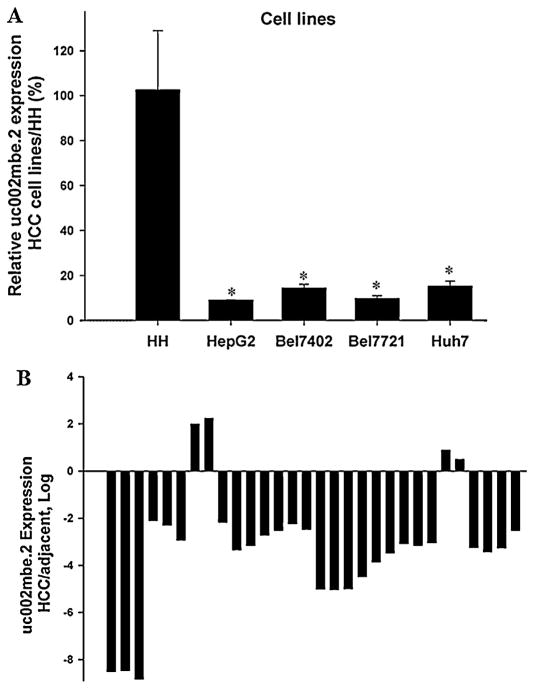
By quantitative real-time PCR, a striking decrease in uc002mbe.2 expression was observed in four separate HCC cell lines compared with non-malignant human hepatocytes (Fig. 6A). We next studied the expression of uc002mbe.2 in 30 pairs of human samples that included HCC tissues and their corresponding adjacent noncancerous liver tissues. The levels of uc002mbe.2 were remarkably reduced in 26 HCC samples in comparison with adjacent normal livers (Fig. 6B). These data suggested that uc002mbe.2 could be a tumor suppressor.
Fig. 6.
Reduced expression of uc002mbe.2 in HCC cell lines and human HCC tissues. uc002mbe.2 expression was studied by real-time PCR and normalized to GAPDH mRNA level. (A) RNA was extracted from HCC cell lines and human hepatocytes (HH). Each bar represents the mean and SD from three independent experiments. *p < 0.01, relative to HH. (B) RNA was extracted from thirty HCC samples and their corresponding adjacent noncancerous liver tissues. The heights of the columns in the figure represent the log 2-transformed fold changes between HCC samples and the corresponding adjacent noncancerous liver tissues.
3.5. TSA-induced uc002mbe.2 is involved in apoptosis in Huh7 cells
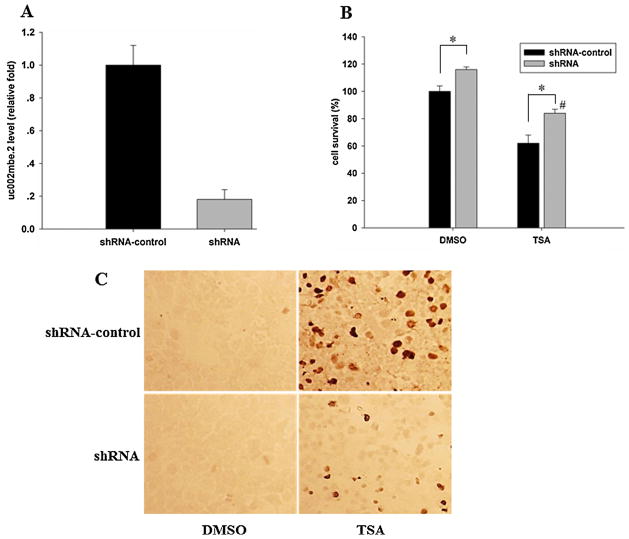
In order to study the role of TSA-induced uc002mbe.2 in mediating cell death, the expression of uc002mbe.2 was knocked down by shRNA transfection followed by cell viability and TUNEL assay. Transfection of uc002mbe.2 shRNA caused more than 80% reduction of uc002mbe.2 level (Fig. 7A). Down-regulation of uc002mbe.2 by shRNA plasmid increased the number of Huh7 cells implying its role in cell survival. In addition, inhibited expression of uc002mbe.2 also blocked TSA-induced Huh7 cell death as demonstrated by MTT and TUNEL assay (Fig. 7B and C). After 24 h of TSA treatment, robust DNA double-strand breaks were noted in cells transfected with control plasmid as revealed by positive TUNEL staining; whereas, only very few DNA double-strand breaks were seen in the cells transfected with uc002mbe.2 shRNA plasmid (Fig. 7C).
Fig. 7.
Knockdown the expression of uc002mbe.2 increased Huh7 cell survival and inhibited TSA-induced apoptosis of Huh7 cells. (A) uc002mbe.2 expression level in Huh7 cells that were transfected with either control plasmid or uc002mbe.2 shRNA plasmid for 48 h. (B) Percentage of cell survival in transfected Huh7 cells that were treated with either DMSO or TSA for 24 h. Data are expressed as mean ± SD from three independent experiments, *p < 0.05; #p < 0.05, vs. shRNA DMSO treatment group. (C) The expression of uc002mbe.2 was knocked down by shRNA in Huh7 cells, and then the cells were treated with TSA (1 μM) for 24 h followed by TUNEL assay.
4. Discussion
Several lncRNAs have been shown to act like tumor suppressor genes or have oncogenic abilities [20,23,33]. Although changes in lncRNA expression levels are causatively linked to HCC development, the underlying molecular mechanism still needs to be elucidated [23,25]. The current study demonstrates the effects of TSA on lncRNA and protein coding gene expression and the potential interactions between lncRNAs and coding genes in TSA-induced HCC cell death. Our novel findings showed that TSA altered the expression of many lncRNAs as well as coding RNA. In addition, TSA-induced apoptosis of HCC cells is uc002mbe.2 dependent and that the reduction of uc002mbe.2 may be associated with liver carcinogenesis.
Several studies have demonstrated the regulation of protein-coding gene changes in different cancer cells treated with HDACi; however, the changes vary depending on the type of cell lines and HDACi [12,14]. In a previous study, the result of hierarchical clustering did not show a clear gene separation of HepG2 cells treated with TSA (500 nM) and only about 500 genes altered their expression [34]. The present study demonstrated that 1849 coding genes were significantly altered and showed a distinguishable protein coding gene expression profiling by the treatment of TSA in Huh7 cells (Fig. 2). High concentration (5 μM) of TSA could affect more gene expression [35]. Thus, coding genes respond to TSA is cell type and dose specific. After performing functional analysis, the altered coding genes were found to be associated with the altered lncRNAs. Moreover, those TSA-regulated coding genes have catalytic activity, oxidoreductase activity, and cyclin-dependent protein kinase inhibitor activity (Fig. 4A and B). Thus, lncRNAs seem to play an important role in TSA-induced HCC cells death.
LncRNAs have a wide spectrum of molecular functions such as regulating alternative splicing, transcriptional pattern, and protein activity. They also have epigenetic effect and are precursors of small RNAs. LncRNAs play an important role in dosage compensation, genomic imprinting, chromatin regulation, and many other biological processes [23,33,36]. Recent study showed that the response of lncRNAs to stress was different and was cell-type and/ or agent-specific [37]. Our data showed that intergenic lncRNAs accounted for half of the altered lncRNA. It is known that intergenic lncRNAs regulate gene expression through modifying chromatin complexes or RNA binding proteins. In addition, aberrant expression of intergenic lncRNAs is associated with cancers [38,39]. Intergenic lncRNAs are seen to be new links in cancer progression and can be utilized for cancer diagnosis, recurrence, and potential therapeutic targets [39]. Intergenic lncRNAs including MEG3 (maternally expressed gene 3), H19, and MALAT1 (metastasis associated lung adenocarcinoma transcript 1) can function as tumor suppressor or oncogene in HCC [40–42]. However, the expression of these lncRNAs was not significantly changed after TSA treatment in Huh7 cells (our unpublished data). These findings indicated that the induction of uc002mbe.2 might be apoptotic or TSA specific.
4.1. Among the altered intergenic lncRNAs, the greatest change was noted for uc002mbe.2
Furthermore, we documented the selective induction of uc002mbe.2 in TSA-treated HCC cells, but not in normal hepatocytes. The TSA induced expression of uc002mbe.2 and apoptosis was time dependent in Huh7 [10]. Thus, the induction of uc002mbe.2 by TSA was positively correlated with the apoptotic effect of TSA in Huh7. It suggests the crucial role of uc002mbe.2 in mediating the cell death induced by TSA. The knockdown experiment firmly established the role of uc002mbe.2 in mediating TSA-induced cell death of HCC cells. Recent studies have also identified that lncRNAs interacted with protein coding genes that play central roles in cell-cycle inhibition and stress-induced apoptosis in different cancer cells [38,43]. These results suggested that particular lncRNAs have the potential to become the surrogate indicators of a specific cell stress. The exact role of uc002mbe.2 in TSA-induced HCC cells death is not clear. Whether uc002mbe.2 can regulate the transcriptional regulatory networks requires detailed investigation. Another interesting finding is that uc002mbe.2 expression is significantly reduced in HCC cell lines as well as HCC tissues and reducing the uc002mbe.2 expression in Huh7 cells can modestly increase cell proliferation. The anti-proliferative role of uc002mbe.2 may be due to its role in promoting apoptosis. Additional study is needed to support the future use of uc002mbe.2 in cancer therapy.
In summary, our data established the role of uc002mbe.2 in TSA-mediated apoptosis of HCC cells. Intergenic uc002mbe.2 may present a potential therapeutic target in HCC treatment. The reduction of uc002mbe.2 in HCC may promote proliferation in human liver cancer cells.
Acknowledgments
This work was supported by grants funded by the National Natural Science Foundation of China (No. 81001109 and 81001108), Natural Science Foundation of Guangdong Province (No. S2011020002143), Research project from Bureau of Education of Guangzhou Municipality (10A015G and 08A001) and NIH Grant CA 53596 (to Wan). We thank Jessica Tsuei for editing the manuscript.
Abbreviations
- TSA
Trichostatin A
- HCC
hepatocellular carcinoma
- lncRNA
long non-coding RNA
- qRT-PCR
real-time quantitative reverse transcription PCR
- HDAC
histone deacetylases
- HDACi
histone deacetylase inhibitors
- TUNEL
Terminal deoxynucleotidyltransferasedUTP nick end labeling
- shRNA
short hairpin RNA
- HULC
highly up-regulated in liver cancer
Footnotes
Conflict of interest
The authors declare that they have no competing interests.
Authors’ contribution
Hui Yang generated idea, experiment design, generated data, data analysis, and interpretation, manuscript preparation. Yun Zhong analyzed data, generated figures and tables as well as prepared manuscript. Hui Xie microarray data validation and plasmid transfection experiment. XiaoBo Lai collected HCC tissues samples, and real-time PCR experiment. Miqing Xu data analysis, and interpretation, manuscript preparation. Yuqiang Nie collected HCC tissues samples, data analysis, and interpretation. Shiming Liu data analysis, and interpretation, manuscript preparation. Yu-Jui Yvonne Wan study design and interpretation of data, manuscript writing.
References
- 1.Cao H, Phan H, Yang LX. Improved chemotherapy for hepatocellular carcinoma. Anticancer Res. 2012;32:1379–86. [PubMed] [Google Scholar]
- 2.El-Serag HB, Rudolph KL. Hepatocellular carcinoma: epidemiology and molecular carcinogenesis. Gastroenterology. 2007;132:2557–76. doi: 10.1053/j.gastro.2007.04.061. [DOI] [PubMed] [Google Scholar]
- 3.Huynh H. Molecularly targeted therapy in hepatocellular carcinoma. Biochem Pharmacol. 2010;80:550–60. doi: 10.1016/j.bcp.2010.03.034. [DOI] [PubMed] [Google Scholar]
- 4.Hagelkruys A, Sawicka A, Rennmayr M, Seiser C. The biology of HDAC in cancer: the nuclear and epigenetic components. Handb Exp Pharmacol. 2011;206:13–37. doi: 10.1007/978-3-642-21631-2_2. [DOI] [PubMed] [Google Scholar]
- 5.Esteller M. The necessity of a human epigenome project. Carcinogenesis. 2006;27:1121–5. doi: 10.1093/carcin/bgl033. [DOI] [PubMed] [Google Scholar]
- 6.Duong FH, Christen V, Lin S, Heim MH. Hepatitis C virus-induced up-regulation of protein phosphatase 2A inhibits histone modification and DNA damage repair. Hepatology. 2010;51:741–51. doi: 10.1002/hep.23388. [DOI] [PubMed] [Google Scholar]
- 7.Yoo YG, Na TY, Seo HW, Seong JK, Park CK, Shin YK, et al. Hepatitis B virus X protein induces the expression of MTA1 and HDAC1, which enhances hypoxia signaling in hepatocellular carcinoma cells. Oncogene. 2008;27:3405–13. doi: 10.1038/sj.onc.1211000. [DOI] [PubMed] [Google Scholar]
- 8.Lachenmayer A, Toffanin S, Cabellos L, Alsinet C, Hoshida Y, Villanueva A, et al. Combination therapy for hepatocellular carcinoma: additive preclinical efficacy of the HDAC inhibitor panobinostat with sorafenib. J Hepatol. 2012;56:1343–50. doi: 10.1016/j.jhep.2012.01.009. [DOI] [PMC free article] [PubMed] [Google Scholar]
- 9.Yang H, Nie Y, Li Y, Wan YJ. Histone modification-mediated CYP2E1 gene expression and apoptosis of HepG2 cells. Exp Biol Med (Maywood) 2010;235:32–9. doi: 10.1258/ebm.2009.009252. [DOI] [PMC free article] [PubMed] [Google Scholar]
- 10.Yang H, Zhan Q, Wan YJ. Enrichment of Nur77 mediated by retinoic acid receptor beta leads to apoptosis of human hepatocellular carcinoma cells induced by fenretinide and histone deacetylase inhibitors. Hepatology. 2011;53:865–74. doi: 10.1002/hep.24101. [DOI] [PMC free article] [PubMed] [Google Scholar]
- 11.Marks PA, Xu WS. Histone deacetylase inhibitors: potential in cancer therapy. J Cell Biochem. 2009;107:600–8. doi: 10.1002/jcb.22185. [DOI] [PMC free article] [PubMed] [Google Scholar]
- 12.Nalabothula N, Carrier F. Cancer cells’ pigenetic composition and predisposition to histone deacetylase inhibitor sensitization. Epigenomics. 2011;3:145–55. doi: 10.2217/epi.11.12. [DOI] [PMC free article] [PubMed] [Google Scholar]
- 13.Bots M, Johnstone RW. Rational combinations using HDAC inhibitors. Clin Cancer Res. 2009;15:3970–7. doi: 10.1158/1078-0432.CCR-08-2786. [DOI] [PubMed] [Google Scholar]
- 14.Delcuve GP, Khan DH, Davie JR. Roles of histone deacetylases in epigenetic regulation: emerging paradigms from studies with inhibitors. Clin Epigenetics. 2012;4:5. doi: 10.1186/1868-7083-4-5. [DOI] [PMC free article] [PubMed] [Google Scholar]
- 15.Birney E, Stamatoyannopoulos JA, Dutta A, Guigo R, Gingeras TR, Margulies EH, et al. Identification and analysis of functional elements in 1% of the human genome by the ENCODE pilot project. Nature. 2007;447:799–816. doi: 10.1038/nature05874. [DOI] [PMC free article] [PubMed] [Google Scholar]
- 16.Costa FF. Non-coding RNAs Meet thy masters. Bioessays. 2010;32:599–608. doi: 10.1002/bies.200900112. [DOI] [PubMed] [Google Scholar]
- 17.Stein LD. Human genome: end of the beginning. Nature. 2004;431:915–6. doi: 10.1038/431915a. [DOI] [PubMed] [Google Scholar]
- 18.Brosnan CA, Voinnet O. The long and the short of noncoding RNAs. Curr Opin Cell Biol. 2009;21:416–25. doi: 10.1016/j.ceb.2009.04.001. [DOI] [PubMed] [Google Scholar]
- 19.Ponting CP, Oliver PL, Reik W. Evolution and functions of long noncoding RNAs. Cell. 2009;136:629–41. doi: 10.1016/j.cell.2009.02.006. [DOI] [PubMed] [Google Scholar]
- 20.Mitra SA, Mitra AP, Triche TJ. A central role for long non-coding RNA in cancer. Front Genet. 2012;3:17. doi: 10.3389/fgene.2012.00017. [DOI] [PMC free article] [PubMed] [Google Scholar]
- 21.Reis EM, Verjovski-Almeida S. Perspectives of long non-coding RNAs in cancer diagnostics. Front Genet. 2012;3:32. doi: 10.3389/fgene.2012.00032. [DOI] [PMC free article] [PubMed] [Google Scholar]
- 22.Spizzo R, Almeida MI, Colombatti A, Calin GA. Long non-coding RNAs and cancer: a new frontier of translational research? Oncogene. 2012 doi: 10.1038/onc.2011.621. [DOI] [PMC free article] [PubMed] [Google Scholar]
- 23.Li X, Wu Z, Fu X, Han W. Long noncoding RNAs: insights from biological features and functions to diseases. Med Res Rev. 2012 doi: 10.1002/med.21254. [DOI] [PubMed] [Google Scholar]
- 24.Yang Z, Zhou L, Wu LM, Lai MC, Xie HY, Zhang F, et al. Overexpression of long non-coding RNA HOTAIR predicts tumor recurrence in hepatocellular carcinoma patients following liver transplantation. Ann Surg Oncol. 2011;18:1243–50. doi: 10.1245/s10434-011-1581-y. [DOI] [PubMed] [Google Scholar]
- 25.Yang F, Zhang L, Huo XS, Yuan JH, Xu D, Yuan SX, et al. Long noncoding RNA high expression in hepatocellular carcinoma facilitates tumor growth through enhancer of zeste homolog 2 in humans. Hepatology. 2011;54:1679–89. doi: 10.1002/hep.24563. [DOI] [PubMed] [Google Scholar]
- 26.Panzitt K, Tschernatsch MM, Guelly C, Moustafa T, Stradner M, Strohmaier HM, et al. Characterization of HULC, a novel gene with striking up-regulation in hepatocellular carcinoma, as noncoding RNA. Gastroenterology. 2007;132:330–42. doi: 10.1053/j.gastro.2006.08.026. [DOI] [PubMed] [Google Scholar]
- 27.Liao Q, Liu C, Yuan X, Kang S, Miao R, Xiao H, et al. Large-scale prediction of long non-coding RNA functions in a coding-non-coding gene co-expression network. Nucleic Acids Res. 2011;39:3864–78. doi: 10.1093/nar/gkq1348. [DOI] [PMC free article] [PubMed] [Google Scholar]
- 28.Mercer TR, Dinger ME, Sunkin SM, Mehler MF, Mattick JS. Specific expression of long noncoding RNAs in the mouse brain. Proc Natl Acad Sci U S A. 2008;105:716–21. doi: 10.1073/pnas.0706729105. [DOI] [PMC free article] [PubMed] [Google Scholar]
- 29.Engstrom PG, Suzuki H, Ninomiya N, Akalin A, Sessa L, Lavorgna G, et al. Complex loci in human and mouse genomes. PLoS Genet. 2006;2:e47. doi: 10.1371/journal.pgen.0020047. [DOI] [PMC free article] [PubMed] [Google Scholar]
- 30.Dinger ME, Amaral PP, Mercer TR, Pang KC, Bruce SJ, Gardiner BB, et al. Long noncoding RNAs in mouse embryonic stem cell pluripotency and differentiation. Genome Res. 2008;18:1433–45. doi: 10.1101/gr.078378.108. [DOI] [PMC free article] [PubMed] [Google Scholar]
- 31.Yang H, Bushue N, Bu P, Wan YJ. Induction and intracellular localization of Nur77 dictate fenretinide-induced apoptosis of human liver cancer cells. Biochem Pharmacol. 2010;79:948–54. doi: 10.1016/j.bcp.2009.11.004. [DOI] [PMC free article] [PubMed] [Google Scholar]
- 32.Du Y, Kong G, You X, Zhang S, Zhang T, Gao Y, et al. Elevation of highly up-regulated in liver cancer (HULC) by hepatitis B virus X protein promotes hepatoma cell proliferation via down-regulating p18. J Biol Chem. 2012;287:26302–11. doi: 10.1074/jbc.M112.342113. [DOI] [PMC free article] [PubMed] [Google Scholar]
- 33.Martin L, Chang HY. Uncovering the role of genomic “dark matter” in human disease. J Clin Invest. 2012;122:1589–95. doi: 10.1172/JCI60020. [DOI] [PMC free article] [PubMed] [Google Scholar]
- 34.Dannenberg LO, Edenberg HJ. Epigenetics of gene expression in human hepatoma cells: expression profiling the response to inhibition of DNA methylation and histone deacetylation. BMC Genomics. 2006;7:181. doi: 10.1186/1471-2164-7-181. [DOI] [PMC free article] [PubMed] [Google Scholar]
- 35.Roy S, Jeffrey R, Tenniswood M. Array-based analysis of the effects of trichostatin A and CG-1521 on cell cycle and cell death in LNCaP prostate cancer cells. Mol Cancer Ther. 2008;7:1931–9. doi: 10.1158/1535-7163.MCT-07-2353. [DOI] [PubMed] [Google Scholar]
- 36.Moran VA, Perera RJ, Khalil AM. Emerging functional and mechanistic paradigms of mammalian long non-coding RNAs. Nucleic Acids Res. 2012 doi: 10.1093/nar/gks296. [DOI] [PMC free article] [PubMed] [Google Scholar]
- 37.Ozgur E, Mert U, Isin M, Okutan M, Dalay N, Gezer U. Differential expression of long non-coding RNAs during genotoxic stress-induced apoptosis in HeLa and MCF-7 cells. Clin Exp Med. 2012 doi: 10.1007/s10238-012-0181-x. [DOI] [PubMed] [Google Scholar]
- 38.Gibb EA, Brown CJ, Lam WL. The functional role of long non-coding RNA in human carcinomas. Mol Cancer. 2011;10:38. doi: 10.1186/1476-4598-10-38. [DOI] [PMC free article] [PubMed] [Google Scholar]
- 39.Tsai MC, Spitale RC, Chang HY. Long intergenic noncoding RNAs: new links in cancer progression. Cancer Res. 2011;71:3–7. doi: 10.1158/0008-5472.CAN-10-2483. [DOI] [PMC free article] [PubMed] [Google Scholar]
- 40.Braconi C, Kogure T, Valeri N, Huang N, Nuovo G, Costinean S, et al. microRNA-29 can regulate expression of the long non-coding RNA gene MEG3 in hepatocellular cancer. Oncogene. 2011;30:4750–6. doi: 10.1038/onc.2011.193. [DOI] [PMC free article] [PubMed] [Google Scholar]
- 41.Zhang L, Yang F, Yuan JH, Yuan SX, Zhou WP, Huo XS, et al. Epigenetic activation of the MiR-200 family contributes to H19-mediated metastasis suppression in hepatocellular carcinoma. Carcinogenesis. 2013 doi: 10.1093/carcin/bgs381. [DOI] [PubMed] [Google Scholar]
- 42.Lai MC, Yang Z, Zhou L, Zhu QQ, Xie HY, Zhang F, et al. Long non-coding RNA MALAT-1 overexpression predicts tumor recurrence of hepatocellular carcinoma after liver transplantation. Med Oncol. 2012;29:1810–6. doi: 10.1007/s12032-011-0004-z. [DOI] [PubMed] [Google Scholar]
- 43.Niland CN, Merry CR, Khalil AM. Emerging roles for long non-coding RNAs in cancer and neurological disorders. Front Genet. 2012;3:25. doi: 10.3389/fgene.2012.00025. [DOI] [PMC free article] [PubMed] [Google Scholar]


