

Abstract
Interactions between protein domains and linear peptides underlie many biological processes. Among these interactions, the recognition of C-terminal peptides by PDZ domains is one of the most ubiquitous. In this work, we present a mathematical model for PDZ domain-peptide interactions capable of predicting both affinity and specificity of binding based on x-ray crystal structures and comparative modeling with Rosetta. We developed our mathematical model using a large phage display dataset describing binding specificity for a wild type PDZ domain and 91 single mutants, as well as binding affinity data for a wild type PDZ domain binding to 28 different peptides. Structural refinement was carried out through several Rosetta protocols, the most accurate of which included flexible peptide docking and several iterations of side chain repacking and backbone minimization. Our findings emphasize the importance of backbone flexibility and the energetic contributions of side chain-side chain hydrogen bonds in accurately predicting interactions. We also determined that predicting PDZ domain-peptide interactions became increasingly challenging as the length of the peptide increased in the N-terminal direction. In the training dataset, predicted binding energies correlated with those derived through calorimetry and specificity switches introduced through single mutations at interface positions were recapitulated. In independent tests, our best performing protocol was capable of predicting dissociation constants well within one order of magnitude of the experimental values and specificity profiles at the level of accuracy of previous studies. To our knowledge, this approach represents the first integrated protocol for predicting both affinity and specificity for PDZ domain-peptide interactions.
Keywords: binding energy prediction, PDZ domain, protein design, protein-peptide interaction, specificity prediction
INTRODUCTION
Proper organization and regulation of interacting protein domains is crucial for maintaining normal physiological function. Mutations which perturb these interactions often lead to dysfunction and disease [1]. While the evolutionary incorporation of modular protein domains into larger polypeptide chains has created an extraordinary amount of functional diversity, individual domains share common structural and energetic characteristics. Many contain an exposed binding interface optimized for recognition of short linear peptides. Such domain-peptide interactions are ubiquitous in cellular signal transduction and regulatory networks [1]. Synthetic and systems biology strategies have focused on particular domain-peptide interactions with the goal of detecting or designing high binding affinity and specificity. Recent examples include the design of native-like peptide-binding WW domains at atomic resolution using only information contained in multiple sequence alignments [2,3], computational design of peptides highly selective for one of 20 families of bZIP transcription factors [4], and proteome-wide evaluation of SH3 domain-peptide binding specificity with subsequent elucidation of the interactions’ roles in endocytosis [5]. These studies, among many others, have underscored the importance of accurately and efficiently analyzing affinity and selectivity of domain-peptide binding.
PDZ domains are ideal systems for studying domain-peptide interactions
In the present study, we focus on interactions between PDZ (PSD-95, Dlg, ZO-1) domains and linear C-terminal peptides. PDZ domains have many roles in biological function and disease and are ubiquitous within human and model organism proteomes. Notably, as of 2006, 918 and 771 PDZ domains are known to exist in the human and mouse genomes, respectively [6]. PDZ domain-peptide interactions are also present in plants, yeast, and bacteria [7]. Many of these interactions have been studied at atomic detail, as evidenced by the numerous structures of PDZ domain-peptide complexes elucidated through x-ray crystallography and nuclear magnetic resonance (NMR) spectroscopy in the Protein Data Bank (PDB). Calorimetric, fluorescence, and NMR titration studies, such as those of Saro et al. [8] and Fuentes et al. [9], have illustrated the effects of ligand and domain mutations on Gibbs free energy of PDZ domain-peptide binding. Furthermore, the use of phage-displayed peptide and domain libraries has revealed intricate sequence-function relationships, i.e. specificity of different natural and synthetic PDZ domains for peptides of varying sequence [10,11]. Computational efforts to redesign PDZ domains to modify their specificity have also proven fruitful [12,13]. Moreover, the recent design of stable competitive inhibitors of PDZ domain-peptide interactions has revealed a potential path to therapeutics for cocaine addiction, neuropathic pain, and ischemic stroke [14,15]. This abundance of structural, thermodynamic, and high-throughput sequence data, alongside numerous biomedical applications, renders the PDZ domain an ideal model system for the study of domain-peptide interactions.
Known determinants of PDZ domain specificity and promiscuity
All PDZ domains exhibit the same general binding mode (Fig. 1). The binding groove engages the C-terminal peptide ligand through main chain hydrogen bonds. The interaction is such that the peptide extends the antiparallel pairing interaction between β-strand 2 (β2) and β-strand 3 (β3) of the domain. Crucial hydrogen bonds are also found between the carboxylate of the C-terminal position of the peptide (position 0 or P0) and the “carboxylate binding loop” (CBL) immediately preceding β2 [16]. The hydrophobic C-terminal side chain of the peptide (ΦCOO−) serves as an anchor in a highly conserved knob-hole interaction. Additionally, the peptide participates in side chain interactions with α-helix 2 (α2) of the domain.
Figure 1.

Stereoview of the DLG4-3 PDZ domain with bound KKETWV peptide (PDB ID: 1TP5). The canonical hydrophobic C-terminal side chain (ΦCOO−) of the peptide inserts into a hole on the domain surface. The interaction is further stabilized by backbone-backbone hydrogen bonds between the C-terminal carboxylate moiety of the peptide and the “carboxylate binding loop” (CBL) of the domain. Backbone-backbone hydrogen bonds also allow the peptide to participate in antiparallel strand pairing interactions with β-strand 2 (β2), which adjoins β-strand 3 (β3). Side chain-side chain hydrogen bonds are present throughout the PDZ domain-peptide interface and those involving α-helix 2 (α2) are particularly important for interaction specificity.
While PDZ domain interfaces are hardwired to recognize specific C-terminal sequences, they can exhibit remarkably promiscuous binding. Molecular dynamics simulations have suggested that nonpolar contributions to PDZ domain-peptide binding are overwhelmingly favorable [17]. In addition, these calculations have suggested that, while enthalpic contributions must compensate for the loss of conformational entropy upon binding of the peptide ligand, this entropic cost of binding is variable across the PDZ domain family and even varies for the same domain interacting with different peptides [17]. The extent of high-energy water release from hydrophobic regions of the PDZ binding cleft is also highly variable and is likely a determinant of the free energy change at the interface [18]. This complex combination of thermodynamic factors lends promiscuity to PDZ domain-peptide interactions and explains why different domains recognize different portions of peptide sequence space.
Early studies delineated three main PDZ domain classes based on the four C-terminal positions of recognized peptides (P−3—P0). Class I, II, and III domains bind X-S/T-X-ΦCOO−, X-Φ-X-ΦCOO−, and X-D/E-X-ΦCOO− peptides, respectively, where X is any amino acid and Φ is hydrophobic [19]. This canonical classification system based on differences at P−2 was extended by Tonikian et al. [11] through the creation of a specificity map incorporating 82 human and worm PDZ domains. It was found that 73 domains fell into one of 16 specificity classes based on the properties of positions P−6—P0, while nine had unique specificities which could not be classified. This diverse space of preferred binding partners across the PDZ domain family makes in silico prediction of specificity profiles for individual domains a challenging yet fitting goal.
Affinity and specificity prediction for PDZ domain-peptide complexes is a nontrivial problem
Computational techniques for predicting PDZ domain-peptide interactions all depend on experimental data. Statistical and machine learning methods which rely only on primary sequence data are known for being highly accurate in predicting compatible binding partners [20–22]. However, these methods provide little insight into the structural or energetic nuances of interactions. Molecular mechanics techniques, on the other hand, use explicit physics-based calculations and have been applied to predict three-dimensional structural and energetic landscapes of PDZ domain-peptide interactions [17,23,24]. Although these studies have the power to reveal experimentally inaccessible information about interactions, large quantities of computational resources are required, ultimately limiting throughput.
Previous studies have demonstrated that the protein structure prediction program Rosetta [25] can accurately predict structural and energetic characteristics underlying PDZ domain-peptide interactions, often in a high-throughput manner [26–28]. The goal of the present study was to develop and test a unified framework for predicting both affinity and specificity of PDZ domain-peptide interactions using Rosetta. To this end, we first utilized a large phage display dataset and several Rosetta refinement routines to generate a mathematical model describing the free energy change of PDZ domain-peptide binding. This model was tested and further refined using calorimetric measurements of PDZ binding events. Finally, since our approach allows for calculation of free energy in parallel with specificity, we evaluated its predictive capacity through independent tests on several PDZ domains with available crystal structures, dissociation constants, and specificity profiles.
METHODS
Experimental datasets
We made use of single mutant and human PDZ domain phage display data provided by Tonikian et al. [11] (http://baderlab.org/Data/PDZ). Data were presented in the peptide file format, which included the domain sequence and a list of peptide binders derived through phage display. For domain-peptide pairing and measurement of area under the receiver operating characteristic curve (AUC), we included only unique peptides (i.e. no duplicates) following two manipulations: all peptides were truncated, leaving the six C-terminal residues; and any positions labeled as “X”, indicating that any amino acid was accepted at that position, were replaced with alanine. Any peptide found to bind a particular PDZ via phage display was considered a binder, while the remaining peptides that were not listed as binding that domain were considered non-binders. Prior to structural refinement, if necessary, domain crystal structures were also truncated such that they matched the domain sequence provided in the peptide file.
Calorimetric measurements of DLG4-3 binding energy were obtained for the 28 hexapeptides listed in Table 5 of Saro et al. [8]. Data were provided as Gibbs free energy in kcal/mol and did not require conversion.
We performed a systematic literature search for binding affinity data to be used in our independent test. First, we determined which of the human PDZ domains with available phage display data had bound x-ray crystal structures in the Protein Data Bank. For such PDZ domains, we then performed a search of the Medline database using the official HUGO Gene Nomenclature Committee name and any alternative names, along with the search terms PDZ, affinity, binding energy, calorimetry, surface plasmon resonance, and fluorescence. Since all affinity data in identified studies were provided as Kd values, we converted them to ΔΔG values using the formula
| (1) |
Structural refinement
Prior to generating domain-peptide pairs, each original x-ray crystal structure underwent extensive minimization using the Rosetta Relax application. The native peptide sequence was kept for this preprocessing step except in the case of the Erbin PDZ structure (PDB ID: 1MFG) where we utilized the peptide sequence of a different structure (PDB ID: 1N7T). Furthermore, because the two N-terminal backbone positions of the 1MFG peptide deviated slightly from those of other PDZ structures, we used the coordinates of 1TP5 for these peptide positions. The best scoring of 25 output structures, as indicated by the default Rosetta Score12 function, was used as the template onto which peptide sequences were mapped.
For protocols involving flexible peptide docking (FPD and FPD + IRM), the Rosetta FlexPepDock application [29] was utilized. For each input structure provided, peptide rigid body and torsion angle degrees of freedom were optimized, as were side chain angles. Preprocessing steps available through this application were not performed. Protocols calling for rigid body docking (RBD and RBD + IRM) were performed within the RosettaScripts application [30]. Peptides were subjected to small perturbations with translational and rotational standard deviations of 0.3 Å and 3º from the null. Interface side chain angles were sampled as well. RosettaScripts was also used for protocols involving iterative repacking and minimization (IRM, RBD + IRM, and FPD + IRM). Through this refinement scheme, input structures underwent eight iterative rounds of interface side chain repacking and whole backbone minimization. Over the eight rounds, the weight of the repulsive component of the Lennard-Jones potential (wrep) was increased from 12.5% to 100% of the default value. Finally, all protocols ended with calculation of ΔΔE, which was also a function within RosettaScripts. We generated 25 output structures corresponding to each input structure for all protocols and the best scoring of these, as indicated by Score12, was accepted for further analysis. Rosetta command lines and xml script are available in Supplemental Information: Methods.
Weight optimization
We modified the MinimizeScoreWeightSet application within the BioChemistry Library software suite [31] for optimization of weights in the binding energy function. AUC was the objective function for this process. Inputs included a table containing calculated ΔΔEt values representing each energy term t for all domain-peptide combinations, as well as starting weights and maximum step sizes for each. Optimization proceeded in two rounds. In the first, all starting weights were 1.00 (i.e. equal to the Score12 weights) and they were perturbed by at most 0.10 in each Monte Carlo step. This was carried out 100 separate times, producing 100 independent weight sets. Since the best scoring weight sets as indicated by AUC typically converged, the average of the top five was used as the starting weight set for the second round. In this round, starting weights were perturbed by at most 0.02 per step and the average of the five best scoring weight sets was the accepted weight set. In both rounds, the repulsive weight was fixed at 1.00 (i.e. it was not perturbed) while the rest varied. To arrive at a final weight set, we performed the aforementioned procedure in the form of a ten-fold cross-validation analysis. The training set consisting of 92 PDZ domains was partitioned into ten groups (eight groups of nine and two groups of ten). In a round-robin fashion, one group was left out while weight optimization proceeded on the remaining nine. The final weight set was the average of the ten rounds. Standard deviations were used as measures of stability.
Analysis of specificity
All sequence logos were made with Weblogo [32]. For the generation of logos illustrating phage display results, all peptides listed in the peptide file were included without modification. For logos illustrating computational results, the top ~2% of peptides based on calculated ΔΔG were used (36 peptides for training set predictions and 28 peptides for independent predictions). Sequence logos were compared using the distance metric dk. At each position k in a peptide sequence, the distance between a computational profile C and an experimental profile E was calculated as
| (2) |
where vk is a 20-dimensional vector of amino acid frequencies at position k and bk is the number of bits of information at that position, calculated as
| (3) |
For this application, the best dk is 0 and the worst is . When comparing computational and experimental specificity profiles via dk, all positions labeled as “X” were changed to alanine; no further modifications were made.
RESULTS AND DISCUSSION
Developing a mathematical model to predict domain-peptide interactions
We utilized phage display data generated by Tonikian et al. [11] to train our model for PDZ domain-peptide interactions. The dataset included sequences of C-terminal peptide binders for the Erbin PDZ domain and each of 91 single mutants. Mutations were produced at ten key interface positions of the Erbin PDZ and correspond to amino acids found at those particular positions in other PDZ domains. Although heptapeptide sequences (P−6—P0) were reported in the dataset, we chose to remove the P−6 position as it was much less specific than the other six.
Several different protocols within Rosetta were utilized for the structure-based refinement and evaluation of PDZ domain-peptide models in our training set (Fig. 2). This training set consisted of the aforementioned 92 domains and 2,147 phage-derived hexapeptides. Each possible combination of a domain sequence and a peptide sequence was threaded onto a high-resolution x-ray crystal structure of the Erbin PDZ domain with a bound peptide ligand (PDB ID: 1MFG, resolution: 1.25Å). In this fashion, 197,524 unique PDZ domain-peptide complexes were created. Five different refinement protocols consisting of Rosetta structural modifications were tested on each complex. These included: (i) rigid body docking (RBD); (ii) flexible peptide docking (FPD); (iii) iterative repacking and minimization (IRM); (iv) rigid body docking followed by iterative repacking and minimization (RBD + IRM); and (v) flexible peptide docking followed by iterative repacking and minimization (FPD + IRM). Each protocol is described in detail in the Methods section. Following refinement, the free energy of binding of each complex was calculated. For each Rosetta energy term t, the free energy of binding was computed as
Figure 2.
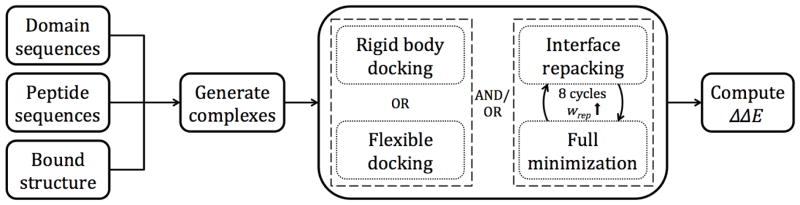
Schematic overview of the PDZ domain-peptide interaction prediction protocols tested. All possible combinations of domain and peptide sequences were threaded onto a structure determined through x-ray crystallography. Structural refinement was carried out through one of five schemes involving rigid body docking, flexible docking, iterative repacking and minimization, or combinations of these. For protocols with iterative repacking and minimization, there were eight alternating cycles of repacking of side chains at the interface and gradient-based minimization of the entire structure. Throughout the eight iterations, the repulsive weight (wrep) was ramped up. In the final step of each protocol, the domain and peptide were separated and the binding energy (ΔΔE) was calculated as the difference between the total energies of the bound and unbound complexes.
| (4) |
where and are the energy values corresponding to bound and unbound states of the PDZ domain-peptide complex, respectively.
To derive an energy function optimized for the detection of compatible and incompatible domain-peptide pairs, the naïve term-wise binding free energies calculated in Eq. (4) were re-weighted. Using an adapted version of a Monte Carlo minimizer within the BioChemistry Library software suite [31], each energy term was weighted such that AUC was maximized based on experimentally-determined specificity profiles of all 92 PDZ domains. In this fashion, for each refinement protocol applied to this training set, we derived a linear binding energy function of the form
| (5) |
where wt is the optimal weight for the energy term t. All final weights were determined through a ten-fold cross-validation analysis (see Methods).
The ten Rosetta energy terms that were not consistently equal to zero on ΔΔE calculation were considered for inclusion in the binding energy function. Of these, six were found to contribute to the optimal detection of domain-peptide interactions and, as such, were included. Van der Waals interactions are crucial given the multiple hydrophobic contacts at the PDZ domain-peptide interface. They were accounted for by the atr and rep energy terms corresponding to attractive and repulsive portions of the Lennard-Jones 12-6 potential, respectively. Solvation (sol), an important effect when considering the environment of the domain-peptide pair in bound versus unbound states, was modeled implicitly via the approximation of Lazaridis and Karplus [33]. Hydrogen bonds, fundamental to PDZ domain-peptide selectivity, were captured in an orientation-dependent fashion [34]. Importantly, they were categorized by the atoms involved: backbone-backbone, backbone-side chain, and side chain-side chain hydrogen bonds all had separate energy terms (hbond_bb_bb, hbond_bb_sc, and hbond_sc_sc, respectively) [35]. The binding energy function can therefore be written as
| (6) |
The nonzero terms representing rotamer-based side chain conformational energy (dun) [36], energy intrinsic to each amino acid in the unfolded state (ref), an electrostatic pair-wise potential (pair), and repulsive interactions among atoms within a single amino acid (intra_rep) were excluded.
There were several noteworthy differences between the weights optimized for PDZ domain-peptide interaction prediction and the default Rosetta Score12 weights (Table 1). The largest weight in all five optimized weight sets was for side chain-side chain hydrogen bonds (whbond_sc_sc). In contrast, the maximum weights in the default weight set were those of backbone-backbone and backbone-side chain hydrogen bonds (whbond_bb_bb and whbond_bb_sc, respectively), both of which were significantly smaller in the optimized weight sets. These differences among the hydrogen bond weights are evidence that side chain-side chain hydrogen bonds were more influential in specificity prediction than are hydrogen bonds involving the backbone, which are more homogeneous across different PDZ domain-peptide pairs. Additionally, atr and rep, the terms representing van der Waals interactions, were also substantially down-weighted in the optimized weight sets relative to the default weight set, indicating dominance of side chain-side chain hydrogen bonding over van der Waals interactions in the binding energy function. We note that there was no major alteration in the balance between attractive and repulsive components of the Lennard-Jones potential (i.e. watr > wrep in both the default and optimized weight sets). Finally, the solvation potential (sol) was upheld as a key factor in the Rosetta modeling process as it was only slightly down-weighted through optimization.
Table 1.
Default Rosetta weights alongside weights optimized for interaction prediction
| Default | Optimized | |||||
|---|---|---|---|---|---|---|
| Score12 | RBD | FPD | IRM | RBD + IRM | FPD + IRM | |
| watr | 0.68 | 0.15 ± 0.03 | 0.33 ± 0.02 | 0.23 ± 0.05 | 0.16 ± 0.04 | 0.20 ± 0.03 |
| wrep | 0.38 | 0.07 ± 0.00 | 0.13 ± 0.01 | 0.14 ± 0.02 | 0.12 ± 0.01 | 0.17 ± 0.03 |
| wsol | 0.56 | 0.27 ± 0.02 | 0.38 ± 0.03 | 0.42 ± 0.05 | 0.38 ± 0.05 | 0.40 ± 0.06 |
| whbond_bb_bb | 1.00 | 0.35 ± 0.05 | 0.46 ± 0.09 | 0.11 ± 0.11 | 0.39 ± 0.08 | 0.18 ± 0.08 |
| whbond_bb_sc | 1.00 | 0.10 ± 0.09 | −0.05 ± 0.08 | 0.12 ± 0.09 | 0.57 ± 0.08 | 0.12 ± 0.04 |
| whbond_sc_sc | 0.94 | 1.00 ± 0.04 | 1.00 ± 0.08 | 1.00 ± 0.10 | 1.00 ± 0.08 | 1.00 ± 0.16 |
Each set was normalized by dividing by the largest weight. Standard deviations were derived through a ten-fold cross-validation analysis. RBD: rigid body docking; FPD: flexible peptide docking; IRM: iterative repacking and minimization; RBD + IRM: rigid body docking followed by iterative repacking and minimization; FPD + IRM: flexible peptide docking followed by iterative repacking and minimization
The optimized weights had small standard deviations derived through a ten-fold cross-validation analysis, demonstrating their robustness. Interestingly, the optimal value of whbond_bb_sc for the FPD protocol was less than zero. This one instance of a negative weight can be interpreted in several ways: (i) through FPD, conformations that contain more favorable backbone-side chain hydrogen bonds tended to be energetically unfavorable overall; (ii) backbone-side chain hydrogen bonds might not have contributed to interaction prediction through FPD because the weight is within one standard deviation of zero (this would apply to whbond_bb_bb for the IRM protocol as well); (iii) whbond_bb_bb is larger for FPD than for any other optimized weight set—thus, backbone-side chain hydrogen bonds were accounted for such that they counterbalanced backbone-backbone hydrogen bonds.
Based on AUC calculated via the optimization process, the best performing protocol for predicting PDZ-hexapeptide interactions with ΔΔEtotal as a classifier was FPD + IRM (AUC = 0.57) followed by RM, FPD, RBD + RM, and RBD (AUC = 0.56, 0.56, 0.56, and 0.52, respectively). While the AUC achieved for each protocol was modest, it was consistently superior to that of the Score12 energy function, which is not optimized for the detection of domain-peptide binding (Fig. S1a for FPD + IRM). RBD + IRM was performed on the same training set with only the C-terminal four peptide residues (P−3—P0) present. The resulting AUC derived through optimization of tetrapeptide binding prediction (0.74) was markedly higher than the AUC for hexapeptide binding prediction through all protocols (Fig. S1b); however, the tetrapeptide AUC was improved over the corresponding Score12 AUC by a similar margin compared to the hexapeptide set. As such, predicting PDZ domain-peptide binding becomes increasingly challenging as the length of the peptide increases in the N-terminal direction. This is likely due to noise contributed by the N-terminal peptide positions for which the PDZ domain tends to be more promiscuous. The assessment of binder/non-binder prediction via AUC does not necessarily correspond to the sequence logo comparisons discussed later. Furthermore, the lower AUCs achieved through this method may be attributed to false negative phage display results (i.e. peptides not found to bind a particular PDZ which, through isothermal titration calorimetry [ITC] for example, bind with sufficient affinity). One accepted measurement of interaction prediction through AUC makes use of the amino acid frequencies constituting the computationally derived specificity profiles (i.e. sequence logos) as classifiers. Consistent with the method implemented by Smith and Kortemme [26], amino acids with frequency ≥10% at a particular peptide position in the experimental profile were defined as positives. Computational specificity profiles (generated as described in Methods) determined through FPD + IRM successfully discriminated between frequent and infrequent amino acids, as indicated by the AUC of 0.88. This is comparable to the value achieved by Smith and Kortemme for the same dataset (0.90) [26]. Although we did not optimize the binding energy function by maximizing this particular AUC, it did improve by 0.04 relative to Score12 (Fig. 3a).
Figure 3.

Impact of linear reweighting on prediction of PDZ domain-peptide interactions. Charts or graphics on the left hand side correspond to prediction using default Rosetta Score12 weights and those on the right hand side correspond to prediction using optimized weights. a: Through FPD + IRM, area under the receiver operating characteristic curve for prediction of frequent/infrequent amino acids improved by 0.04. b: Correlation of computational binding energies predicted through FPD + IRM and experimental binding energies (ΔΔEtotal and ΔΔG, respectively) for the DLG4-3 PDZ domain and 28 hexapeptides improved by 0.18. c: Sequence logos depicting computationally predicted and phage-derived specificity profiles for interactions between the wild type Erbin PDZ and hexapeptides. Following weight optimization, the average distance between profiles predicted through FPD + IRM and profiles predicted through phage display (dAvg) decreased by 0.20 (i.e. predictive accuracy increased). d: Profiles predicted through RBD + IRM and profiles predicted through phage display for interactions between the wild type Erbin PDZ and tetrapeptides. After weight optimization, dAvg increased by 0.53 (i.e. predictive accuracy decreased).
The aforementioned AUCs were calculated by rank ordering all values of the classifier (i.e. ΔΔEtotal values for all 197,524 domain-peptide pairs or amino acid frequencies in all 92 computational specificity profiles). To determine whether ΔΔEtotal more effectively predicted peptides binding to a particular PDZ domain or domains binding to a particular peptide, we calculated AUCs after partitioning the training dataset by domain or by peptide. While neither partition fared significantly better than the other, there was more variation in the predictive accuracy of domains binding to a particular peptide (Table 2). Both partitioned AUCs were also nearly equal to the AUC for all domain-peptide pairs (Table 2). Analogously, with amino acid frequency as a classifier, the AUC corresponding to data partitioned by domain was almost identical to that of the entire dataset (Table 2).
Table 2.
Performance based on area under the receiver operating characteristic curve (AUC)
| Training set | Independent test set | ||||||||
|---|---|---|---|---|---|---|---|---|---|
| Classifier | Partition | n | AUC* | IQR | Range | n | AUC* | IQR | Range |
| ΔΔEtotal | Domain | 92 | 0.57 | 0.51–0.60 | 0.38–0.76 | 5 | 0.63 | 0.60–0.63 | 0.52–0.70 |
| Peptide | 2147 | 0.58 | 0.37–0.79 | 0.00–1.00 | 149 | 0.50 | 0.25–0.75 | 0.00–1.00 | |
| None (all domain- peptide pairs) | - | 0.57 | - | - | - | 0.59 | - | - | |
| Amino acid frequency | Domain | 92 | 0.88 | 0.85–0.92 | 0.72–0.97 | 5 | 0.79 | 0.78–0.83 | 0.71–0.88 |
| None (all domains) | - | 0.88 | - | - | - | 0.79 | - | - | |
Represents the median AUC for partitioned data. All results represent the performance of flexible peptide docking followed by iterative repacking and minimization.
IQR: interquartile range
Correlation of calorimetric and computational binding free energies
Although our mathematical model for PDZ domain-peptide interactions was optimized for the prediction of a dichotomous variable (binding or lack thereof), we also evaluated and fine-tuned its ability to predict binding free energies. We leveraged ITC measurements collected by Saro et al. [8] for 28 hexapeptides binding the DLG4-3 PDZ domain (also known as PDZ3 of PSD-95). Using a high-resolution x-ray crystal structure of the DLG4-3 PDZ domain-peptide complex (PDB ID: 1TP5, resolution: 1.54Å), all five refinement protocols were applied to this dataset and binding energies (ΔΔEtotal) were predicted with the optimized weight set of each protocol. We compared these computational binding energies with Gibbs free energies of binding (ΔΔG) determined through ITC. For each of the five sets of 28 data points, we derived a best-fit line:
| (7) |
Correlation coefficients (R), scaling factors (c), and vertical intercepts (b) for each refinement protocol are presented in Table 3. Binding energies calculated following FPD had the strongest correlation with the experimental ΔΔG values (R = 0.60), followed by FPD + IRM, RBD + IRM, RBD, and IRM (R = 0.53, 0.48, 0.45, and 0.44, respectively). Weight optimization improved the correlation between computational and experimental binding energies for all five protocols (Fig. 3b for FPD + IRM, other protocols not shown). This analysis makes it possible to approximate ΔΔG values following any of the five Rosetta refinement protocols by substitution of the right hand side of Eq. (6) into Eq. (7) along with the appropriate values from Tables 1 and 3.
Table 3.
Correlation of experimental (ΔΔG) and computational (ΔΔE) values for DLG4-3 PDZ domain-peptide affinity
| RBD | FPD | IRM | RBD + IRM | FPD + IRM | |
|---|---|---|---|---|---|
| R | 0.45 | 0.60 | 0.44 | 0.48 | 0.53 |
| c | 0.42 | 0.76 | 1.06 | 0.90 | 0.89 |
| b | −5.71 | −2.52 | −5.99 | −5.37 | −6.51 |
R: correlation coefficient; c: scaling factor; b: vertical intercept; RBD: rigid body docking; FPD: flexible peptide docking; IRM: iterative repacking and minimization; RBD + IRM: rigid body docking followed by iterative repacking and minimization; FPD + IRM: flexible peptide docking followed by iterative repacking and minimization
We performed only FPD + IRM for the remaining experiments as this protocol was found to have the highest AUC value for prediction of binders and non-binders in the training set. Although FPD + IRM yielded the second strongest correlation between computational and experimental binding energies and FPD gave the strongest, we eliminated the FPD protocol on the basis of the negative optimal value of whbond_bb_sc.
Analyzing specificity prediction in the training set
Specificity profiles predicted by our mathematical model were compared to those derived through phage display. Preferred binding partners for all 92 PDZ domains are conveniently visualized through the creation of a position weight matrix and subsequent generation of a sequence logo. Computational and experimental profiles were compared via the information content-based distance metric dk (see Methods).
Specificity prediction for 76 out of 92 domains and four out of six peptide positions was improved by weight optimization (Fig. 4). Overall, P0 and P−1 were accurately predicted, likely because of high specificity and homogeneity of preferred residues at these positions (valine at P0 and tryptophan at P−1). Preferences at P−2 and P−3 were generally more challenging to detect due to heterogeneity of amino acids at these positions across the dataset albeit high specificity. P−4 and P−5 were usually less specific overall or “flatter” and were thus not as heavily penalized due to the information content multiplier in the calculation of dk. Notably, through FPD + IRM, the most accurately predicted profile was that of the wild type Erbin PDZ binding to hexapeptide ligands (Fig. 4) and it was much improved relative to the Score12 prediction (Fig 3c); however, using RBD + IRM, prediction of wild type Erbin PDZ binding to tetrapeptides was in the lower ranking 50% of predictions (result not shown) and was not improved on weight optimization (Fig. 3d). Evidently, the hexapeptide binding prediction model may be finer-grained for the prediction of wild type and wild type-like specificity profiles. This result is likely due to the larger percentage of peptides representing these profiles in the hexapeptide dataset compared to the tetrapeptide dataset. All 92 specificity profile comparisons for the PDZ-hexapeptide complexes in our training set are provided in Figure S2.
Figure 4.

Specificity prediction performance using flexible peptide docking followed by iterative repacking and minimization (FPD + IRM) on the training set of Erbin PDZ single mutants. Distance values (dk) are represented for all 92 domains at each peptide position k in the heat map. Domains and peptide positions marked with an asterisk performed worse (i.e. had a greater dk) with optimized weights than with default Rosetta Score12 weights. Example sequence logo comparisons are provided, which have numerous notable features. Q51M: Prediction of preferred amino acids and degree of specificity was close to ideal. H79R: Preference for an aromatic residue at P−2 and aspartate at P−3 was detected. V83K: The preferred aspartate residues at P−2 and P−3 were not predicted; however, dAvg was relatively low for this mutant because predicted amino acid frequencies were accurate even though rank ordering was not. R49A: P−3—P0 were well predicted but the slight preference for phenylalanine at P−4 was missed. T48K: Aspartate/glutamate specificity at P−3 was detected albeit in reverse order. S26N: Glycine at P−3 was not predicted and overall specificity at P−4 and P−5 was under-predicted although preference for an aromatic residue at P−5 was detected. S28K: Glycine at P−3 was predicted but specificity for phenylalanine at P−4 was dramatically over-predicted. L23V: This was among the worst performing mutants due to lack of detection of isoleucine preference at P0, under-prediction of specificity for threonine at P−2, and failure to predict the strong preference for acidic residues at P−3.
Independent assessment of affinity and specificity prediction
We evaluated both binding free energy and specificity for an independent set of PDZ domain-peptide interactions as a means of external validation of our protocol. Using a systematic database search strategy described in Methods, we found five PDZ domains with available binding affinity measurements for at least one hexapeptide, phage display data, and bound x-ray crystal structures (Table 4). Affinity data presented in the five studies we identified [37–41] were obtained through ITC, fluorescence anisotropy, fluorescence resonance energy transfer, and surface plasmon resonance. Phage display data generated by Tonikian et al. [11] consisted of peptide binders for a panel of 54 human PDZ domains. All five x-ray crystal structures were of good resolution (2.31 Å or better [Table 4]).
Table 4.
Human PDZ domain structures and affinity data used for independent predictions
| PDZ domain | PDB ID | X-ray resolution (Å) | PDZ chain | Peptide chain | Affinity data sources | Peptide sequences | Experimental methods |
|---|---|---|---|---|---|---|---|
| DLG1-1 | 3RL7 | 2.30 | A | G | Wang et al. [37] | YKETDV | FA |
| DLG1-2 | 2I0L | 2.31 | A | C | Wang et al. [37] | YKETDV | FA |
| MPDZ-10 | 2OPG | 1.50 | A | B | Sharma et al. [38] | ERISSV | ITC |
| PTPN13-2 | 3LNY | 1.30 | A | B | Gianni et al. [39] | EQVSAV, EQVTAV | FRET |
| SNTA1-1 | 1QAV | 1.90 | A | B* | Wiedemann et al. [40]; Harris et al. [41] |
IRETIV, LEGIFV, WLETWV; SIESDV, VKESLV | SPR; FA |
Residues 1106–1111 were used
FA: fluorescence anisotropy; ITC: isothermal titration calorimetry; FRET: fluorescence resonance energy transfer; SPR: surface plasmon resonance
Each PDZ domain was paired with each of the 1,731 peptides in the human PDZ phage display dataset, as well as peptides for which affinity data were available. We utilized the FPD + IRM protocol for structural refinement of models in this independent assessment. Using the optimized weight set and linear model described previously, ΔΔG was approximated for each complex. Since all affinity measurements in our sources were presented as Kd values, we converted these into ΔΔG values. As a measure of affinity prediction accuracy, we calculated dΔΔG—the absolute value of the difference between computational and experimental ΔΔG values. As in our assessment of specificity prediction in the training set, we also generated sequence logos illustrating and comparing computational and experimental specificity profiles, and differences between them were quantified using the distance metric dk.
Affinity and specificity prediction performance for the five PDZ domains is illustrated in Figure 5. The average dΔΔG was 0.81 kcal/mol (range: 0.23–1.81); when this average dΔΔG was converted to a ratio of computational versus experimental Kd values, we obtained a result of 3.93 (range: 1.47–21.26), where computational affinities were greater than experimental affinities for four out of five domains. Visual inspection of sequence logos comparing predicted and experimental specificity profiles (Fig. 5 for two selected domains and Fig. S3 for all five domains) reveals that amino acid preferences were well predicted overall. In contrast with specificity prediction in the training set, independent predictions were inferior, as expected. Relative to training set performance measured through dk, predictions at P−1 and P0 were much less accurate. P−3 was the only position more accurately predicted in the independent set than in the training set. AUCs according to ΔΔEtotal were roughly equivalent to those of the training set (Table 2). However, AUCs according to amino acid frequency were considerably lower than those of the training set, albeit still strong (Table 2). Overall, the reduction in accuracy is likely due to diverse amino acid preferences in the independent set compared to the training set.
Figure 5.
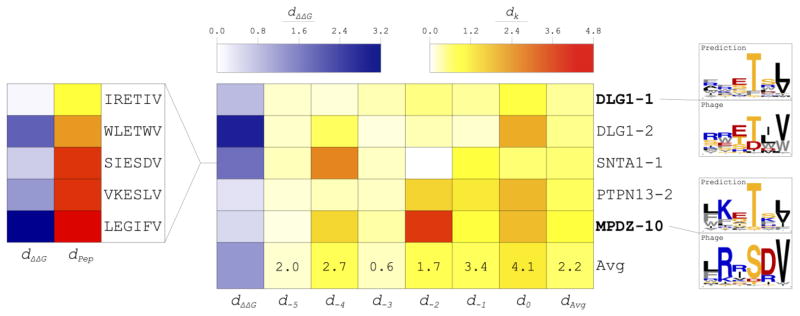
Prediction of affinity and specificity using flexible peptide docking followed by iterative repacking and minimization (FPD + IRM) for an independent set of five PDZ domains. Comparison of predicted and experimental ΔΔG values was performed using the dΔΔG metric; comparison of predicted and experimental specificity profiles was performed using the dk metric at each peptide position k. Both are illustrated in the heat map at the center of the figure. The ratio of the average dk in the independent set to that of the training set is provided in the last row of the heat map. The correlation of dPep (a measure of the extent to which a peptide is represented in the experimentally determined specificity profile) and dΔΔG for five peptides interacting with the SNTA1-1 PDZ domain is shown at left. Two example sequence logo comparisons are provided at right, which have several notable features. DLG1-1: This was the best performing domain due to nearly ideal predictions at P−5—P−2, though the preference for a hydrophobic residue at P−1 and the strong preference for valine at P0 were not captured. MPDZ-10: This was the worst performing domain because strong specificities for arginine, serine, and aspartate were missed at P−4, P−2, and P−1, respectively; however, another basic residue (lysine) was predicted in place of arginine, another polar residue (threonine) was predicted in place of serine, and the prediction at P−5 was very accurate.
Although the same calculations yielded predictions of both affinity and specificity, we found no correlation between accuracy of binding energy prediction measured through dΔΔG and specificity prediction measured through dk. We believe this may be due to discordance between peptides used for affinity prediction and peptides in the phage display dataset. To explore this difference, for each of the five peptides with known affinities for SNTA1-1, we calculated dPep—a distance metric corresponding to dk for a single peptide compared to a set of peptides representing a specificity profile. Figure 5 illustrates agreement of dΔΔG with dPep for individual peptides binding to this domain. Thus, accurate prediction of binding affinity may depend on the extent to which the peptide is represented in the specificity profile of the domain.
It is important to note that these results are contingent upon qualities of the five PDZ domains tested. All five are classified as canonical Class I domains which have serine/threonine preferences at P−2. Moreover, all peptides utilized for affinity prediction had a C-terminal valine. Finally, the number of available peptides with known affinities, the experimental techniques utilized to measure affinity, and the resolution of the x-ray crystal structures used as templates varied by domain. Overall, we believe this was the most rigorous possible test of our method, and it demonstrated that both binding energy and specificity could be accurately predicted through one integrated approach.
Successes, challenges, and caveats of PDZ interaction prediction
To our knowledge, this work represents the only attempt to predict both binding free energies and specificity profiles for PDZ domain-peptide interactions using one protocol. We began by training a mathematical model to discriminate between binders and non-binders for the Erbin PDZ domain and 91 single mutants. Optimization of Rosetta weights for this task yielded a modest AUC. We attribute this to the challenge of predicting interactions using sets of longer peptides where the domain is considerably less specific for the N-terminal residues than for the C-terminal residues. However, the AUC reflecting classification of frequent/infrequent amino acids in specificity profiles indicated a high level of accuracy consistent with a previous study [26]. The optimization process yielded an energy function in which side chain-side chain hydrogen bonds had considerable weight compared to the default Rosetta energy function, an indicator of their importance in PDZ domain specificity. While the weight of the solvation potential was similar to its weight in the default energy function, weights corresponding to van der Waals interactions as well as backbone-side chain and backbone-backbone hydrogen bonds were reduced. Kaufmann et al. [28] utilized a different Rosetta protocol and optimized the correlation of predicted binding energies with those determined by Saro et al. [8] through ITC. Their energy function consisted of a generalized hydrogen bonding term, the attractive component of the Lennard-Jones potential representing van der Waals interactions, and the solvation potential, where the hydrogen bonding term had the highest weight. Although Kaufmann et al. successfully discriminated between Class I and Class II PDZ domains using their energy function, the inclusion of different hydrogen bonding terms and the repulsive component of the Lennard-Jones potential in our model may help capture finer-grained features in specificity profiles.
One of our goals was to determine the best protocol within Rosetta for the structural refinement of PDZ domain-peptide complexes. We found that routines involving flexible peptide docking performed better than those involving rigid body docking or iterative repacking and minimization alone. Moreover, our best performing protocol (FPD + IRM) included both flexible peptide docking and gradient-based minimization of the backbone, emphasizing the need for backbone flexibility in attaining the best possible predictions of affinity and specificity. Smith and Kortemme [26] and King and Bradley [27] both found that introducing backbone flexibility by using conformational ensembles as inputs improved specificity prediction. This can be achieved through ensemble generators such as backrub [42] or the use of NMR structures. Although we utilized x-ray crystal structures and did not generate ensembles, we likewise conclude that backbone flexibility is essential.
In developing our model for prediction of PDZ domain-peptide interactions, we attained a linear fit by correlating computational binding free energies from all of our tested protocols with those determined through ITC by Saro et al. [8]. Although we only obtained a scaling factor and a vertical intercept through this procedure (i.e. the optimized weights before and after this procedure were linearly dependent), the resulting correlations were nearly as strong as those of previous studies. Our two best performing protocols in this area achieved correlation coefficients of 0.60 (FPD) and 0.53 (FPD + IRM), while Kaufmann et al. [28] achieved a correlation coefficient of 0.66 through a multi-linear regression analysis using the same dataset. Also using the same dataset, Tian et al. [24] acquired a correlation coefficient of 0.65 through a multi-linear regression analysis containing the quantum mechanics/molecular mechanics, Poisson-Boltzmann/surface area, and conformational free energy analysis components of their model. In addition, through regression analysis applied to a large set of PDZ domain microarray and fluorescence data, Shao et al. [43] predicted binding affinities based on primary sequence data, achieving an average correlation coefficient of 0.65. While our method yielded correlation coefficients that were slightly lower than those of several previous studies, we note that our optimization method did not maximize the correlation coefficient; rather, it optimized the prediction of binders and non-binders based only on single mutant specificity data. Had we performed a multi-linear regression analysis to maximize the correlation, accuracy of specificity prediction likely would have suffered.
There were several interesting results arising from the comparison of specificity profiles in our training set of Erbin PDZ single mutants. Smith and Kortemme [26] utilized the same dataset for specificity prediction via a Rosetta protocol involving backrub ensemble generation and genetic algorithm prediction of peptide sequences recognized by each domain. Similar to their findings, we determined that our model recapitulated the loss of aspartate/glutamate at P−3 and serine/threonine at P−2, though not 100% of the time. For example, while specificity for an aromatic residue at P−2 was captured in a number of cases, aspartate/glutamate at this position was not captured for the one mutant where it was preferred. Interestingly, our model was capable of detecting specificity for glycine at P−3 in certain cases, whereas Smith and Kortemme consistently missed this. While these results reveal strengths and weaknesses of the algorithm underlying our predictions, our model was optimized for the prediction of binders contributing to these profiles, as well as non-binders; as such, a test on an independent dataset is the best indicator of the predictive accuracy of our model.
We conducted independent tests of affinity and specificity on a set of five PDZ domains with available binding affinities for at least one hexapeptide and phage display specificity data, as well as bound x-ray crystal structures. Affinity predictions were accurate, as most computationally derived Kd values were well within one order of magnitude of the experimental value. However, these predictions were not uniformly accurate. We found that the extent to which a peptide was represented in the specificity profile of the domain may have governed accuracy, possibly explaining this inconsistency. Not surprisingly, compared to the training set of PDZ domain single mutants, prediction of specificity profiles in this independent dataset was less accurate. However, visual comparison of the specificity profiles suggests that our predictions were actually quite accurate. In fact, the average Frobenius distance between computational and experimental profiles in this dataset was 0.52, which is consistent with the value obtained by Smith and Kortemme (0.59) [26]. AUCs based on classification of frequent/infrequent amino acids in specificity profiles were also similar. Overall, these results indicate that our approach successfully predicted both affinity and specificity of PDZ domain-peptide interactions. This integrated method offers the benefit of simultaneous calculation of a dissociation constant and generation of a sequence logo, both based on the predicted free energy change at the interface.
Methods for predicting domain-peptide interactions such as ours are not devoid of limitations. Similar to previous computational studies of PDZ domain-peptide interactions, we developed and tested our model based on the effects of amino acid variation in and around the binding interface. However, a recent study demonstrated that removal of a distal structural element in a PDZ domain (α-helix 3 of DLG4-3) resulted in a 21-fold decrease in binding affinity [44]. Therefore, there are likely crucial contributions to binding affinity and specificity beyond those of the binding interface that computational methods may not capture. Additionally, we utilized a linear model for binding energy prediction; this likely describes some, but not all, contributions to PDZ domain-peptide interactions [24]. Also, as there is little consensus on a single best scoring metric for comparing specificity profiles [26], we utilized a custom metric accounting for both amino acid frequencies and information content. Had we used a different scoring metric, our results likely would have differed, albeit not dramatically. As with all work in computational structural biology, predictions are limited by the quality of the experimental data on which they are based. While our approach could also be applied to other protein-peptide interactions (e.g. SH3 and TPR domains), this is contingent upon availability of high-quality experimental data for model development. Furthermore, biophysical data are not necessarily representative of in vitro or in vivo patterns. In general, to determine the extent to which in silico findings are biologically accurate, one must validate them experimentally. Therefore, we believe that our method could serve as a springboard for improving binding affinity for a particular ligand, the identification of new ligands, and the redesign of specificity.
CONLUSIONS
Our method for modeling PDZ domain-peptide interactions predicts both free energy and specificity of binding through one unified protocol. In the development of our mathematical model, we determined that incorporating backbone flexibility and placing considerable weight on side chain-side chain hydrogen bonds were essential for achieving accurate predictions. It was also evident that specificity prediction became increasingly challenging as peptide length increased in the N-terminal direction. In independent tests, our model predicted dissociation constants well within one order of magnitude and specificity at a level of accuracy consistent with previous studies. We believe that this general approach can be applied to other protein-peptide interactions and has the potential to enhance experimental investigation and manipulation of these systems.
Supplementary Material
Figure S1. Impact of linear reweighting on prediction of PDZ domain-peptide interactions. Receiver operating characteristic (ROC) curves on the left hand side correspond to prediction using default Rosetta Score12 weights and those on the right hand side correspond to prediction using optimized weights. a: Through flexible peptide docking and iterative repacking and minimization (FPD + IRM), area under the ROC curve (AUC) for prediction of interactions between Erbin PDZ single mutants and hexapeptides based on ΔΔEtotal improved by 0.05 after weight optimization. b: Through rigid body docking and iterative repacking and minimization (RBD + IRM), AUC for prediction of interactions between Erbin PDZ single mutants and tetrapeptides based on ΔΔEtotal improved by 0.04.
Figure S2. Sequence logo comparisons for 92 PDZ domains including the wild type Erbin PDZ and 91 single mutants.
Figure S3. Sequence logo comparisons for the independent dataset consisting of five PDZ domains.
Supplemental Methods. Rosetta command lines and xml script.
Acknowledgments
The authors thank Nils Woetzel for reconfiguring the BioChemistry Library Monte Carlo minimizer for this work and Jordan Willis and Sarel Fleishman for help with RosettaScripts protocol development. Additionally, we thank the entire Meiler Lab and Rosetta community for insightful feedback on this project. In particular, we are grateful to Tanja Kortemme, Colin Smith, Ora Schueler-Furman, and Nir London for useful discussion. Work in the Meiler Lab is supported through NIH (R01 GM080403, R01 MH090192, R01 GM099842) and NSF (Career 0742762). JJC received support through the Beckman Scholars Program of the Arnold and Mabel Beckman Foundation.
Footnotes
Conflicts of interest: none
References
- 1.Pawson T, Nash P. Assembly of cell regulatory systems through protein interaction domains. Science. 2003;300:445. doi: 10.1126/science.1083653. [DOI] [PubMed] [Google Scholar]
- 2.Socolich M, Lockless SW, Russ WP, Lee H, Gardner KH, Ranganathan R. Evolutionary information for specifying a protein fold. Nature. 2005;437:512–518. doi: 10.1038/nature03991. [DOI] [PubMed] [Google Scholar]
- 3.Russ WP, Lowery DM, Mishra P, Yaffe MB, Ranganathan R. Natural-like function in artificial WW domains. Nature. 2005;437:579–583. doi: 10.1038/nature03990. [DOI] [PubMed] [Google Scholar]
- 4.Grigoryan G, Reinke AW, Keating AE. Design of protein-interaction specificity gives selective bZIP-binding peptides. Nature. 2009;458:859–864. doi: 10.1038/nature07885. [DOI] [PMC free article] [PubMed] [Google Scholar]
- 5.Tonikian R, Xin X, Toret CP, Gfeller D, Landgraf C, Panni S, Paoluzi S, Castagnoli L, Currell B, Seshagiri S, Yu H, Winsor B, Vidal M, Gerstein MB, Bader GD, Volkmer R, Cesareni G, Drubin DG, Kim PM, Sidhu SS, Boone C. Bayesian modeling of the yeast SH3 domain interactome predicts spatiotemporal dynamics of endocytosis proteins. PLoS Biol. 2009;7:e1000218. doi: 10.1371/journal.pbio.1000218. [DOI] [PMC free article] [PubMed] [Google Scholar]
- 6.Spaller MR. Act globally, think locally: systems biology addresses the PDZ domain. ACS Chem Biol. 2006;1:207–210. doi: 10.1021/cb600191y. [DOI] [PubMed] [Google Scholar]
- 7.Ponting CP. Evidence for PDZ domains in bacteria, yeast, and plants. Protein Sci. 1997;6:464–468. doi: 10.1002/pro.5560060225. [DOI] [PMC free article] [PubMed] [Google Scholar]
- 8.Saro D, Li T, Rupasinghe C, Paredes A, Caspers N, Spaller MR. A thermodynamic ligand binding study of the third PDZ domain (PDZ3) from the mammalian neuronal protein PSD-95. Biochemistry. 2007;46:6340–6352. doi: 10.1021/bi062088k. [DOI] [PMC free article] [PubMed] [Google Scholar]
- 9.Fuentes EJ, Gilmore SA, Mauldin RV, Lee AL. Evaluation of energetic and dynamic coupling networks in a PDZ domain protein. J Mol Biol. 2006;364:337–351. doi: 10.1016/j.jmb.2006.08.076. [DOI] [PubMed] [Google Scholar]
- 10.Ernst A, Sazinsky SL, Hui S, Currell B, Dharsee M, Seshagiri S, Bader GD, Sidhu SS. Rapid evolution of functional complexity in a domain family. Sci Signal. 2009;2:ra50. doi: 10.1126/scisignal.2000416. [DOI] [PubMed] [Google Scholar]
- 11.Tonikian R, Zhang Y, Sazinsky SL, Currell B, Yeh J-H, Reva B, Held HA, Appleton BA, Evangelista M, Wu Y, Xin X, Chan AC, Seshagiri S, Lasky LA, Sander C, Boone C, Bader GD, Sidhu SS. A specificity map for the PDZ domain family. PLoS Biol. 2008;6:e239. doi: 10.1371/journal.pbio.0060239. [DOI] [PMC free article] [PubMed] [Google Scholar]
- 12.Reina J, Lacroix E, Hobson SD, Fernandez-Ballester G, Rybin V, Schwab MS, Serrano L, Gonzalez C. Computer-aided design of a PDZ domain to recognize new target sequences. Nat Struct Biol. 2002;9:621–627. doi: 10.1038/nsb815. [DOI] [PubMed] [Google Scholar]
- 13.Smith CA, Shi CA, Chroust MK, Bliska TE, Kelly MJS, Jacobson MP, Kortemme T. Design of a phosphorylatable PDZ domain with Peptide-specific affinity changes. Structure. 2013;21:54–64. doi: 10.1016/j.str.2012.10.007. [DOI] [PubMed] [Google Scholar]
- 14.Thorsen TS, Madsen KL, Rebola N, Rathje M, Anggono V, Bach A, Moreira IS, Stuhr-Hansen N, Dyhring T, Peters D, Beuming T, Huganir R, Weinstein H, Mulle C, Strømgaard K, Rønn LCB, Gether U. Identification of a small-molecule inhibitor of the PICK1 PDZ domain that inhibits hippocampal LTP and LTD. Proc Natl Acad Sci U S A. 2010;107:413–418. doi: 10.1073/pnas.0902225107. [DOI] [PMC free article] [PubMed] [Google Scholar]
- 15.Bach A, Clausen BH, Møller M, Vestergaard B, Chi CN, Round A, Sørensen PL, Nissen KB, Kastrup JS, Gajhede M, Jemth P, Kristensen AS, Lundström P, Lambertsen KL, Strømgaard K. A high-affinity, dimeric inhibitor of PSD-95 bivalently interacts with PDZ1–2 and protects against ischemic brain damage. Proc Natl Acad Sci U S A. 2012;109:3317–3322. doi: 10.1073/pnas.1113761109. [DOI] [PMC free article] [PubMed] [Google Scholar]
- 16.Doyle DA, Lee A, Lewis J, Kim E, Sheng M, MacKinnon R. Crystal structures of a complexed and peptide-free membrane protein-binding domain: molecular basis of peptide recognition by PDZ. Cell. 1996;85:1067–1076. doi: 10.1016/s0092-8674(00)81307-0. [DOI] [PubMed] [Google Scholar]
- 17.Basdevant N, Weinstein H, Ceruso M. Thermodynamic basis for promiscuity and selectivity in protein-protein interactions: PDZ domains, a case study. J Am Chem Soc. 2006;128:12766–12777. doi: 10.1021/ja060830y. [DOI] [PMC free article] [PubMed] [Google Scholar]
- 18.Beuming T, Farid R, Sherman W. High-energy water sites determine peptide binding affinity and specificity of PDZ domains. Protein Sci. 2009;18:1609–1619. doi: 10.1002/pro.177. [DOI] [PMC free article] [PubMed] [Google Scholar]
- 19.Nourry C, Grant SGN, Borg J-P. PDZ domain proteins: plug and play! Sci STKE. 2003;2003:RE7. doi: 10.1126/stke.2003.179.re7. [DOI] [PubMed] [Google Scholar]
- 20.Chen JR, Chang BH, Allen JE, Stiffler MA, MacBeath G. Predicting PDZ domain-peptide interactions from primary sequences. Nat Biotechnol. 2008;26:1041–1045. doi: 10.1038/nbt.1489. [DOI] [PMC free article] [PubMed] [Google Scholar]
- 21.Schillinger C, Boisguerin P, Krause G. Domain Interaction Footprint: a multi-classification approach to predict domain-peptide interactions. Bioinformatics. 2009;25:1632–1639. doi: 10.1093/bioinformatics/btp264. [DOI] [PubMed] [Google Scholar]
- 22.Zaslavsky E, Bradley P, Yanover C. Inferring PDZ domain multi-mutant binding preferences from single-mutant data. PLoS One. 2010;5:e12787. doi: 10.1371/journal.pone.0012787. [DOI] [PMC free article] [PubMed] [Google Scholar]
- 23.Gerek ZN, Keskin O, Ozkan SB. Identification of specificity and promiscuity of PDZ domain interactions through their dynamic behavior. Proteins. 2009;77:796–811. doi: 10.1002/prot.22492. [DOI] [PubMed] [Google Scholar]
- 24.Tian F, Lv Y, Zhou P, Yang L. Characterization of PDZ domain-peptide interactions using an integrated protocol of QM/MM, PB/SA, and CFEA analyses. J Comput Aided Mol Des. 2011;25:947–958. doi: 10.1007/s10822-011-9474-5. [DOI] [PubMed] [Google Scholar]
- 25.Kaufmann KW, Lemmon GH, Deluca SL, Sheehan JH, Meiler J. Practically useful: what the Rosetta protein modeling suite can do for you. Biochemistry. 2010;49:2987–2998. doi: 10.1021/bi902153g. [DOI] [PMC free article] [PubMed] [Google Scholar]
- 26.Smith CA, Kortemme T. Structure-based prediction of the peptide sequence space recognized by natural and synthetic PDZ domains. J Mol Biol. 2010;402:460–474. doi: 10.1016/j.jmb.2010.07.032. [DOI] [PubMed] [Google Scholar]
- 27.King CA, Bradley P. Structure-based prediction of protein-peptide specificity in Rosetta. Proteins. 2010;78:3437–3449. doi: 10.1002/prot.22851. [DOI] [PubMed] [Google Scholar]
- 28.Kaufmann K, Shen N, Mizoue L, Meiler J. A physical model for PDZ-domain/peptide interactions. J Mol Model. 2011;17:315–324. doi: 10.1007/s00894-010-0725-5. [DOI] [PMC free article] [PubMed] [Google Scholar]
- 29.Raveh B, London N, Schueler-Furman O. Sub-angstrom modeling of complexes between flexible peptides and globular proteins. Proteins. 2010;78:2029–2040. doi: 10.1002/prot.22716. [DOI] [PubMed] [Google Scholar]
- 30.Fleishman SJ, Leaver-Fay A, Corn JE, Strauch E-M, Khare SD, Koga N, Ashworth J, Murphy P, Richter F, Lemmon G, Meiler J, Baker D. RosettaScripts: a scripting language interface to the Rosetta macromolecular modeling suite. PLoS One. 2011;6:e20161. doi: 10.1371/journal.pone.0020161. [DOI] [PMC free article] [PubMed] [Google Scholar]
- 31.Dong E, Smith J, Heinze S, Alexander N, Meiler J. BCL::Align-sequence alignment and fold recognition with a custom scoring function online. Gene. 2008;422:41–46. doi: 10.1016/j.gene.2008.06.006. [DOI] [PMC free article] [PubMed] [Google Scholar]
- 32.Crooks GE, Hon G, Chandonia J-M, Brenner SE. WebLogo: a sequence logo generator. Genome Res. 2004;14:1188–1190. doi: 10.1101/gr.849004. [DOI] [PMC free article] [PubMed] [Google Scholar]
- 33.Lazaridis T, Karplus M. Effective energy function for proteins in solution. Proteins. 1999;35:133–152. doi: 10.1002/(sici)1097-0134(19990501)35:2<133::aid-prot1>3.0.co;2-n. [DOI] [PubMed] [Google Scholar]
- 34.Kortemme T, Morozov AV, Baker D. An orientation-dependent hydrogen bonding potential improves prediction of specificity and structure for proteins and protein-protein complexes. J Mol Biol. 2003;326:1239–1259. doi: 10.1016/s0022-2836(03)00021-4. [DOI] [PubMed] [Google Scholar]
- 35.Kortemme T, Baker D. A simple physical model for binding energy hot spots in protein-protein complexes. Proc Natl Acad Sci U S A. 2002;99:14116–14121. doi: 10.1073/pnas.202485799. [DOI] [PMC free article] [PubMed] [Google Scholar]
- 36.Dunbrack RL, Karplus M. Backbone-dependent rotamer library for proteins. Application to side-chain prediction. J Mol Biol. 1993;230:543–574. doi: 10.1006/jmbi.1993.1170. [DOI] [PubMed] [Google Scholar]
- 37.Wang L, Piserchio A, Mierke DF. Structural characterization of the intermolecular interactions of synapse-associated protein-97 with the NR2B subunit of N-methyl-D-aspartate receptors. J Biol Chem. 2005;280:26992–26996. doi: 10.1074/jbc.M503555200. [DOI] [PubMed] [Google Scholar]
- 38.Sharma SC, Rupasinghe CN, Parisien RB, Spaller MR. Design, synthesis, and evaluation of linear and cyclic peptide ligands for PDZ10 of the multi-PDZ domain protein MUPP1. Biochemistry. 2007;46:12709–12720. doi: 10.1021/bi7008135. [DOI] [PubMed] [Google Scholar]
- 39.Gianni S, Haq SR, Montemiglio LC, Jürgens MC, Engström, Chi CN, Brunori M, Jemth P. Sequence-specific long range networks in PSD-95/discs large/ZO-1 (PDZ) domains tune their binding selectivity. J Biol Chem. 2011;286:27167–27175. doi: 10.1074/jbc.M111.239541. [DOI] [PMC free article] [PubMed] [Google Scholar]
- 40.Wiedemann U, Boisguerin P, Leben R, Leitner D, Krause G, Moelling K, Volkmer-Engert R, Oschkinat H. Quantification of PDZ domain specificity, prediction of ligand affinity and rational design of super-binding peptides. J Mol Biol. 2004;343:703–718. doi: 10.1016/j.jmb.2004.08.064. [DOI] [PubMed] [Google Scholar]
- 41.Harris BZ, Hillier BJ, Lim WA. Energetic determinants of internal motif recognition by PDZ domains. Biochemistry. 2001;40:5921–5930. doi: 10.1021/bi010142l. [DOI] [PubMed] [Google Scholar]
- 42.Smith CA, Kortemme T. Backrub-like backbone simulation recapitulates natural protein conformational variability and improves mutant side-chain prediction. J Mol Biol. 2008;380:742–756. doi: 10.1016/j.jmb.2008.05.023. [DOI] [PMC free article] [PubMed] [Google Scholar]
- 43.Shao X, Tan CS, Voss C, Li SS, Deng N, Bader GD. A regression framework incorporating quantitative and negative interaction data improves quantitative prediction of PDZ domain-peptide interaction from primary sequence. Bioinformatics. 2011;27:383–390. doi: 10.1093/bioinformatics/btq657. [DOI] [PMC free article] [PubMed] [Google Scholar]
- 44.Petit CM, Zhang J, Sapienza PJ, Fuentes EJ, Lee AL. Hidden dynamic allostery in a PDZ domain. Proc Natl Acad Sci U S A. 2009;106:18249–18254. doi: 10.1073/pnas.0904492106. [DOI] [PMC free article] [PubMed] [Google Scholar]
Associated Data
This section collects any data citations, data availability statements, or supplementary materials included in this article.
Supplementary Materials
Figure S1. Impact of linear reweighting on prediction of PDZ domain-peptide interactions. Receiver operating characteristic (ROC) curves on the left hand side correspond to prediction using default Rosetta Score12 weights and those on the right hand side correspond to prediction using optimized weights. a: Through flexible peptide docking and iterative repacking and minimization (FPD + IRM), area under the ROC curve (AUC) for prediction of interactions between Erbin PDZ single mutants and hexapeptides based on ΔΔEtotal improved by 0.05 after weight optimization. b: Through rigid body docking and iterative repacking and minimization (RBD + IRM), AUC for prediction of interactions between Erbin PDZ single mutants and tetrapeptides based on ΔΔEtotal improved by 0.04.
Figure S2. Sequence logo comparisons for 92 PDZ domains including the wild type Erbin PDZ and 91 single mutants.
Figure S3. Sequence logo comparisons for the independent dataset consisting of five PDZ domains.
Supplemental Methods. Rosetta command lines and xml script.