

Abstract
In the present study, we report a compound acquisition and prioritization algorithm established for rational chemical library purchasing or compound synthesis in order to increase the diversity of an existing compound collection. This method was established based on chemistry-space calculation using BCUT (Burden CAS University of Texas) descriptors. In order to identify the acquisition of compounds from candidate collections into the existing collection, a derived distance-based selection rule was applied, and the results were well supported by pairwise similarity calculations and cell-partition statistics in chemistry space. The correlation between chemistry-space distance and Tanimoto similarity index was also studied to justify the compound acquisition strategy through weighted linear regression. As a rational approach for library design, the distance-based selection rule exhibits certain advantages in prioritizing compound selection to enhance the overall structural diversity of an existing in-house compound collection or virtual combinatorial library for in silico screening, diversity oriented synthesis and high-throughput screening.
Keywords: BCUT descriptor, Compound Acquisition, Diversity Analysis
INTRODUCTION
The advent of combinatorial chemistry has significantly contributed to the rapid growth of the number of compounds and various compound collections. Thus, it becomes increasingly important to emphasize the importance of building high-quality and structurally diverse screening collections for high-throughput screening (HTS) or highcontent screening (HCS).1 Although modern HTS technologies can screen millions of compounds more quickly and cheaply than ever before, it is still challenging for a small pharmaceutical company or an academic institution to cover the costs in the absence of significant funds. Moreover, interrogating a large number of compounds generates unmanageable false positives. Thus, it is particularly necessary and important to build high-quality compound screening sets for some bioassays that have low screening throughput capacity or are limited by the availability of key reagents (e.g., antibodies, primary cells, or whole organism systems). In contrast to a large combinatorial screening collection that targets structural variations for structure-activity relationship (SAR) studies, a high-quality screening compound set built by rational acquisition of structurally diverse compounds potentially improves the HTS/HCS hit rate while preserving resources.
To build a compound collection for virtual screening or high-throughput screening, an ideal strategy seeks balanced tradeoff between overall molecular diversity and the number of compounds. Molecular diversity may be assessed by the variety of molecular properties, which is encoded by molecular descriptors such as physicochemical properties, topology index, or fingerprints.2 Enhancing molecular diversity or removing redundancy can be achieved by four categories of approaches: cluster-based method, dissimilarity-based method, cell-based method and optimization-based method.3 A cluster-based method is implemented to assign compounds into groups so that compounds possess higher within-group similarity than between-group similarity.4 Once compound similarity is solved, a hierarchy-clustering algorithm, such as neighbor joining, or non-hierarchy algorithm, such as K-means, can be carried out for clustering. The motivation for applying a chemical dissimilarity-based method is to maximize the total dissimilarity between each pair of nearest neighboring compounds.5 Relying on some linear or nonlinear binning procedure, a cell based method aims to cover more cells with a minimal number of compounds, categorizing compounds in the same cell as similar.6 An optimization-based approach enhances the diversity by optimizing the object function that may incorporate a set of descriptors to measure the molecular diversity in different criteria.7 Although the approaches involving molecular diversity are frequently mentioned, there is still no widely accepted quantitative procedure for the prioritization and acquisition of new compounds to increase the structural diversity of an existing compound collection.
Among various molecular descriptors, BCUT descriptors6, 8 incorporate comprehensive information regarding molecular structure, atom property and more into decimal numbers. Creating BCUT descriptors is one of the most popular approaches to construct lowdimensional chemistry space and perform diversity analyses. The performance of BCUT descriptors has been validated through previous QSAR studies9 and successful applications in library design.10 While BCUT descriptors demonstrate the relevance of generating a representative PubChem library11 and diversity analysis,12 we are expanding their use for the acquisition of new candidate compounds from external compound collections, in order to optimize an existing in-house screening set and increase its overall diversity.
In this manuscript, we present a compound acquisition and prioritization algorithm established on the Euclidean distance in BCUT chemistry space. This method is validated using weighted linear regression between the Euclidean distance and similarity index. Results from two case studies demonstrate that the selected subsets of external candidate compound collections enhanced the overall chemical diversity of an existing in-house screening collection, according to chemistry-space cell partition statistics and similarity index. Discussions are also presented on distance cutoff value and disagreement between the chemistry-space distance and similarity index. The algorithm provides useful information to facilitate decision-making for acquiring new candidate compounds and prioritizing compound syntheses.
EXPERIMENTAL METHOD AND CALCULATION
BCUT Chemistry Space and Compound Acquisition Protocol
The established compound acquisition and prioritization algorithm is based on BCUT chemistry-space calculation using the protocol reported.11 Briefly, BCUT descriptors6 are defined by combining atomic descriptors for each atom and description of the nominal bond-types for adjacent and nonadjacent atoms into BCUT matrices. The value of each chemistry-space coordinate is specified as the highest or lowest eigen-value of BCUT matrix. In our study, the Diverse Solutions program (Tripos Sybyl 8.0) 13 was used to generate a set of default 2D BCUT descriptors that covered different scaling factors and atomic properties, including H-bond donor, H-bond acceptor, partial charge and polarity. The optimal combination of descriptors was selected automatically by the program to construct BCUT chemistry space, with the restriction that the correlation coefficient between any pair of BCUT descriptors was less than 0.25.
The computational protocol of the compound acquisition and prioritization algorithm using chemistry-space distance calculation is summarized below:
|
This method is rationally justified through the correlation studies between Euclidean distance in the BCUT chemistry space and Tanimoto coefficient from MACCS key fingerprints. The results are given later. More information regarding the implementation of the regression analysis, acquisition algorithm and distance threshold can be found at Supporting Information Part I.
Distance Threshold
By default, the distance cutoff value, c, is defined as the estimated density of the existing compound collection according to the equation,
where i, j are the compound indices for the existing collection. The density indicates how well the chemistry space was explored or exhausted in the previous experiment. Thus, the new candidate compounds are also expected to cover the chemistry space in a similar pattern. Figure 1 illustrates how the density of an existing compound collection affects the choice of acquired compounds. Candidate compounds with large distance to their nearest neighbors in the existing collection are considered dissimilar to the compounds in the existing collection, and such candidate compounds are recommended for acquisition (like points “a” and “b” in Figure 1A). On the other hand, the candidate compound, “c” in Figure 1A, is excluded from the acquisition list due to its short distance to its nearest neighbor, “d”. However, the compound, “f” in Figure 1B, is still to be acquired, although the distance to its nearest neighbor “e” is almost the same as the distance between “c” and “d” (Figure 1A). The different acquisition decisions for similar circumstance can be explained by the density of two existing compound collections. In Figure 1A, the established compound dataset may be primarily designed to search the chemistry space sparsely. The high-density dataset in Figure 1B may explore the chemistry space more thoroughly. Therefore, the decision-making relies on the profile of the existing compound collection. In this method, the default distance threshold is equal to the density of the existing compound collection.
Figure 1.

A graphic representation of BCUT chemistry space to illustrate the concept and effect of the density of an existing compound collection. The compound collection with low density (A) sparsely covers the BCUT chemistry space, while the one with high density (B) exhausts the chemistry space more specifically. The choice of distance cutoff value depends on the density of the existing compound collection.
Molecular Diversity Analyses
A structurally diverse compound collection is expected to cover well-defined chemistry space uniformly. The chemical diversity of a compound dataset may be measured in a binning procedure14. The binning procedure is used to generate “cells” in a multidimensional descriptor space. Each dimension is divided uniformly into a finite number of “bins”. The bin-definition defines multi-dimensional “cells”, which cover the entire space. The chemical diversity could be accessed by counting the number of filled cells. As illustrated in Figure 2, the concepts regarding a bin and a filled/void cell are given in a hypothetical plot of two-dimensional BCUT chemistry space. As shown in the plot, the acquired compound filling a void cell is believed to increase the overall structural diversity. On the other hand, the new compound in the cell that already has compounds (red dots) from the existing compound collection does not contribute to increase structural diversity and is not recommended to be acquired or purchased.6
Figure 2.

A graphic representation of two-dimensional chemistry space and filled/void cells to illustrate the analysis of the diversity increment attributed by the candidate compounds (blue dots), in comparison with the compounds (red dots) from the existing compound collection.
In this study, four-dimensional instead of two-dimensional chemistry-space was constructed. The entire space was partitioned into 1004 cells with the same volume by dividing each axis into 100 bins equally. Each cell was indexed by (I1, I2, I3, I4). Indices Ik were integers ranging from 0 to 99. A cell indexed by (I1, I2, I3, I4) represented a subspace R(I1, I2, I3, I4) = { (x1, x2, x3, x4): Ik × 0.1 ≤ xk< Ik × 0.1+0.1, k=1, 2, 3, 4 }. Finally the number of filled void cells by candidate compounds was sorted out to describe diversity increment.
Candidate compounds could also be compared to an established compound collection to characterize the degree of similarity between two compound datasets, according to molecular fingerprint. This approach measures how closely the candidate compounds are represented in the existing compound collection by Tanimoto coefficient.15 The degree of similarity between candidate compounds and the existing compound collection was evaluated by Database Comparison program (Tripos Sybyl) based on UNITY fingerprint, as described below.
RESULTS AND DISCUSSION
Similar to other drug screening centers or institutes, the University of Pittsburgh Drug Discovery Institute (UPDDI) faces the issue of building a high-quality chemical library in terms of library size and structural diversity associated with the cost of purchasing and storage. In this section, the rationality of the compound acquisition and prioritization algorithm, together with its application, is presented through guiding candidate compound acquisition in order to increase diversity of the current PMLSC screening set that contains 230k compounds from the Pittsburgh Molecular Libraries Screening Center (PMLSC, pmlsc.pitt.edu). For this illustration, two commercial libraries, TimTec 3k Natural Derivatives Library (NDL)16 and TimTec 2k Active Probes Library (APL) were selected as candidate compound collections, from which compounds were prioritized and selectively deposited into the PMLSC screening set.
Four atom properties (partial charge, polarity, H-bond donor, and H-bond acceptor in diagonal elements) were considered to calculate BCUT. According to PMLSC screening set, the best combination of scaling factor and the choice of eigen-value were selected to construct chemistry space. The value of each BCUT descriptor was scaled to range from 0 to 10. The distribution of each BCUT descriptor of the PMLSC screening set is shown in Figure 3, and the specifications of BCUT descriptors are listed in Table 1. The correlation coefficient, r2, between any pair of dimensions was less than 0.11, suggesting that every dimension independently described different aspects of molecular properties.
Figure 3.

The distribution of four chemistry-space descriptors for the PMLSC screening set, showing (a) the histograms of atomic partial charge descriptor, (b) H-bond acceptor descriptor, (c) H-bond donor descriptor, and (d) polarity descriptor.
Table 1.
The specifications of BCUT descriptors for constructing four-dimensional chemistry space
| Diagonal Element | Off-diagonal Element |
Scaling factor | Remove(R) or keep(K) hydrogen |
Use lowest(L) or highest(H) Eigen value |
|---|---|---|---|---|
| GasTchrg | Burden | 0.1 | R | H |
| (Atomic Charge) | ||||
| Haccept (HBA) | Burden | 0.9 | R | H |
| Hdonor (HBD) | Burden | 0.75 | R | H |
| Tabpolar (polarity) | Burden | 0.5 | R | H |
In the compound selection or prioritization algorithm, high acquisition priority was assigned to the candidate compounds that had large chemistry-space distances to their nearest neighbors in the existing compound collection. For the validation of this method, 1991 pairs of compounds were selected sequentially from the Active Probes Library (APL) in order to study the correlation between Tanimoto coefficient (Tc) and chemistryspace distance through weighted linear regression. MACCS 17 key molecular fingerprints were then generated to calculate Tanimoto coefficient for these compounds pairs, and their chemistry-space distances were evaluated in the chemistry space defined by PMLSC screening set. Figure 4A displays the scatter plot of the raw Euclidean distance in chemistry space and the calculated Tanimoto coefficient (Tc) similarity score of 1991 pairs of compounds in APL. The Tc values of 1991 compound pairs range from 0.023 to 1.000 and their distances range from 0.002 to 12.824.
Figure 4.

(A) The scatter plot between the Euclidean distance in BCUT chemistry space and Tanimoto coefficient (Tc) of 1991 pairs of compounds in Active Probes Library (APL). The fitted regression line and five labeled outliers are also shown. The Tanimoto coefficients are calculated according to MACCS fingerprint; (B) The scatter plot of Tanimoto coefficient (Tc) and transformed Euclidean distance for the 1991 pairs of APL compounds with the weighted regression line. The weight for each point is its Tc value. (C) The Q-Q plot for regression residuals, the theoretical quantile is standard normal quantile.
For a correlation study, the distance in chemistry space was transformed to normalize its variance as a function of Tc (Figure 4B). As fingerprints were developed to measure compound similarity instead of dissimilarity,6 weighted regression was performed to emphasize the significance of high Tc values. Figure 4B shows the scatter plot of (D: chemistry-space distance along y-axis) and Tanimoto coefficient (Tc along x-axis) of 1991 pairs of APL compounds together with the fitted regression line. The regression equation was then solved as:
where α= 6.13, β = −5.23; and the correlation coefficient, r2, was 0.61.
The corresponding normal Q-Q plot of regression residuals is shown in Figure 4C. Q-Q plot is an effective technique to examine the distributions of two sets of samples by plotting quantiles against each other. According to the Q-Q plot, the distribution of regression residuals that were the difference between fitted values and corresponding observed values was close to standard normal distribution, allowing for hypothesis testing to examine the correlation of those two variables. Based on Figure 4B, hypothesis testing resulted in a two-sided p-value < 0.0001, which was strongly against null hypothesis β = 0 and favored alternative hypothesis β ≠ 0. This statistical result suggested a fine negative correlation between the chemistry-space distance and Tanimoto coefficient calculated by MACCS fingerprint. Therefore, candidate compounds with large distances to their nearest neighbors were expected to be dissimilar to the compounds in the existing compound collection, and acquiring such compounds would efficiently enhance the overall chemical diversity.
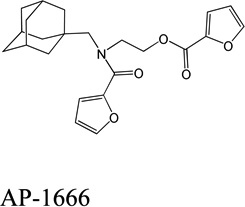
Despite favorable correlations, discrepancies still existed between chemistry-space distance and Tc, as illustrated by five pairs of labeled outliers in Figure 4A. The structures of the compound pairs are listed in Table 2. MACCS fingerprint based similarity Tc calculation did not detect the structural difference for the compound pair 1 (AP-49 and AP-50), showing a Tc value of 1.0 (Table 2). However, the distance between them was considered to be relatively large (distance = 1.16) in the BCUT chemistry space, which could reflect different π-conjugated systems between two compounds. The subtle feature is sometimes important for biological activities. On the other hand, the compound pair 2 (AP-526/AP-527) and pair 3(AP-230/AP-231) were quite similar with reported distance of 0.031 and 0.095 respectively, while the Tc value was less than 0.85, indicating structural difference between them. The large distances between compound pair 4 and pair 5 (distance = 6.65 and 4.61 respectively) were essentially due to the BCUT polarity descriptor. For example, the calculated electric dipole of compound AP-1665 was 2.61 Debye, while the dipole of AP-1666 was 5.34 Debye (according to original structure and Gasteiger–Hückel charge). Thus, BCUT descriptors characterize structural topology together with atom properties and possess certain advantages for constructing low-dimensional chemistry space, compared to molecular fingerprint. The distribution of distances between all pairs of nearest-neighboring compounds in the PMLSC screening set is shown in Figure 5A. The probability density function (Figure 5B) of exponential distribution was fit to the normalized histogram:
Thus, the expectation of distance between one pair of nearest-neighboring compounds was 0.072. As shown Figure 5B, λ could be regarded as the density of an existing compound collection, so λ was the default threshold for compound selection. In the present case, the distance threshold value, c, was equal to 0.072.
Table 2.
Five pairs of compounds illustrate some outliers in Figure 4A.
| Compound Pair | Distance | Tc | ||
|---|---|---|---|---|
| 1 | 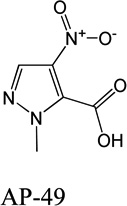 |
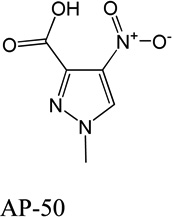 |
1.16 | 1.0 |
| 2 | 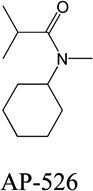 |
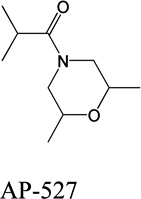 |
0.031 | 0.44 |
| 3 | 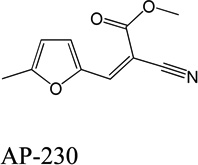 |
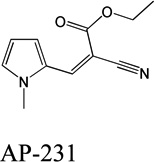 |
0.095 | 0.53 |
| 4 | 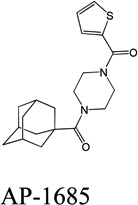 |
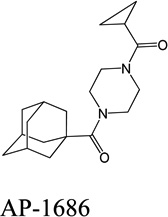 |
6.65 | 0.81 |
| 5 | 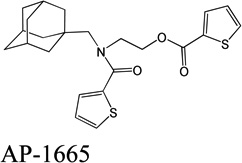 |
 |
4.61 | 0.85 |
Figure 5.

(A) The histogram of the distances between nearest neighboring compounds in the existing screening collection. (B) The normalized histogram with fitted exponential probability density function (PDF). The default distance cutoff value is 0.072.
For comparison, different subsets of commercial compound collections (NDL and APL) were generated and compared to the current PMLSC screening collection, with the intention to justify the compound acquisition method. As shown in Table 3, 1648 compounds from NDL (NDL-B) and 1096 compounds from APL (APL-C) were selected according to the acquisition protocol, using distance threshold 0.072. Alternatively, the top 1000 and 500 compounds were selected to create another two subsets, NDL-C and NDL-D respectively, after ranking NDL compounds descendingly according to their distances to the nearest neighbors from the PMLSC screening set. The same strategy was also applied to select 1500 and 500 APL compounds (APL-B and APL-D).
Table 3.
The average and standard deviation of Tc for different NDL and APL compound subsets, compared to the PMLSC screening collection. The Tanimoto coefficients are calculated by Database Comparison program that is based on UNITY fingerprint.
| Natural Derivatives Library | Active Probes Library | ||||
|---|---|---|---|---|---|
| Subset | Size | Mean/Stdev Tanimoto |
Subset | Size | Mean/Stdev Tanimoto |
| NDLA | 3000 | 0.8593±0.11 | APLA | 2000 | 0.8134±0.15 |
| NDLB | 1648 | 0.8211±0.11 | APLB | 1500 | 0.7636±0.13 |
| NDLC | 1000 | 0.8071±0.11 | APLC | 1096 | 0.7460±0.13 |
| NDLD | 500 | 0.7851±0.12 | APLD | 500 | 0.7004±0.13 |
To investigate the correlation between chemistry space distance and Tc in a larger scale, the whole NDL, APL and their subsets were compared to the PMLSC screening set using Database Comparison program. It is worth pointing out that Database Comparison program characterizes the degree of overlapping between two compound collections using UNITY fingerprint and Tanimoto coefficient. As subsets NDL-C, NDL-D, APL-B and APL-D were not created by compound acquisition protocol, they might possess high intra-subset similarity. However, Database Comparison program was used to examine the between-collection similarity, i.e. comparing NDL or APL subsets to the PMLSC screening set, to show the effect of chemistry space distance on Tanimoto similarity index. Table 3 summarizes the sample mean and standard deviation of Tc values for different NDL and APL subsets, when compared to the PMLSC screening set. As shown in the table, the subset NDL-A, the whole NDL, possesses average Tc 0.8593 in comparison to the PMLSC screening set, whereas the subsets, NDL-B, NDL-C and NDLD, have average Tc values of 0.8211, 0.8071 and 0.7851, when the number of acquired compounds is 1648, 1000 and 500 respectively. A similar trend is also observed with the APL, which possesses an average Tc value of 0.8134 to the PMLSC collection. The average Tc values between the APL subsets and the PMLSC collection decrease from 0.8134 to 0.7004, as the size of acquired compounds is reduced from 2000 to 500.
The Database Comparison program calculates the Tanimoto between all candidate compounds and their nearest neighboring compounds in the PMLSC screening set. Thus, a set of Tanimoto coefficients were reported after comparing NDL or APL to the PMLSC screening set, and a histogram was created to examine the distribution of these Tc values. The distributions of Tc values are plotted in Figure 6A for NDL subsets and Figure 6B for APL subsets. In Figure 6A, the solid line represents the density profile of Tc values between all the NDL compounds and their most similar counterparts in the PMLSC compound collection in 0.01 intervals. While the data shows 12% NDL compounds with Tc=1.0 to the PMLSC screening set (data point not shown in Figure 6A), the peak of the curve is around Tc = 0.91, indicating a relatively large portion of NDL compounds with Tc = 0.91. The distributions of Tc values from NDL subsets with size 1648, 1000 and 500 are represented by a dashed line, a dotted line and a dash-dotted line, respectively. Any of the three subsets contains less than 1% of compounds that possess Tc = 1.0 to the PMLSC collection. As the size of NDL subsets decreases from 3000 to 500, the distribution shifts to the lower Tc value, indicating that smaller subsets tend to be increasingly dissimilar to the PMLSC screening set.
Figure 6.

(A) The distribution of Tanimoto coefficient (Tc) values for four NDL subsets: NDL-A with 3000 compounds, NDL-B with 1648 compounds, NDL-C with 1000 compounds, NDL-D with 500 compounds; (B) The distribution of Tanimoto coefficient (Tc) values for four APL subsets: APL-A with 2000 compounds, APL-B with 1500 compounds, APL-C with 1096 compounds, APL-D with 500 compounds. The Y-axis is the percentage of Tanimoto values that fall into every 0.01 interval.
Figure 6B reveals a similar pattern for APL. 15% of APL compounds have Tc = 1.0 to their most similar counterpart in PMLSC collection, while none of APL-B, APL-C and APL-D possesses more than 1% of Tc that is 1.0 (data point not shown in the Figure). The peaks also shift towards the lower value of Tc as the size of APL subsets decreases. In general, the correlation between subset size and Tc distribution can be explained by the regression study as shown in Figure 4 above. Figure 4 reveals the negative correlation between Tc values and chemistry-space distance. In other words, the Tc value between a pair of compounds tends to decrease as their chemistry-space distance increases. As the NDL or APL candidate compounds were selected according to the distances to their nearest neighbors, smaller subset had larger average distance to the PMLSC screening set. Thus, the smaller subset tended to be dissimilar to the PMLSC compound collection, even if the similarity score was calculated by Database Comparison program based on UNITY fingerprint (Figure 6 and Table 3). While any novel candidate compounds would add certain structural diversity to an existing compound collection, the amount of to-be- acquired candidate compounds should be carefully determined to balance the quality and quantity through the choice of distance cutoff value. The density of an established compound collection is the recommended distance cutoff value, because it reflects how the compound dataset explores the chemistry space. Furthermore, the chemistry-space distance between identical compounds is zero, because identical compounds have the same coordinate values. Import of any duplicate candidate compounds into the PMLSC screening set is avoided by applying an appropriate distance cutoff value. For example, 12% of compounds in NDL were duplicates to the PMLSC screening set and removed from the wish list. However, in our case studies, less than 1% of compounds present in NDL-B, NDL-C and NDL-D possessed Tc = 1.0 to the PMLSC screening set. This is attributed to the fact that a pair of compounds possessing Tc = 1.0, such as the compound pair 1 (AP49/AP50) from Table 2, may not necessarily be identical.
The similarity assessment from Database Comparison program described the degree of overlapping between two compound collections, yet it was unable to provide a quantitative measure of the overall diversity increment. Therefore, a “binning” procedure described in Methods section was applied to the BCUT chemistry space for diversity assessment. For the binning procedure, the bin size was required to determine the volume of “cells” in chemistry space. A large bin size would reduce the sensitivity of diversity measurement, where as a small bin size would trap most candidate compounds in void cells and make counting the filled void cells meaningless. A reasonable bin size could be determined in consideration of the size and density of an existing compound collection, or the regression analysis illustrated in Figure 4. For this study, the size of one bin was set to 0.1, which was at the magnitude of the density of the PMLSC compound collection.
Figure 7 visualizes the number of filled void cells by applying the established compound acquisition and prioritization algorithm and gradually relaxing the threshold distance value, c, until all the NDL and APL compounds were deposited into the PMLSC screening set. The X-axis denotes the number of the deposited compounds, while the Yaxis denotes the number of void cells filled by the corresponding compounds. Figure 7 shows an approximate linear growth of the number of filled cells (dotted lines), when less than 1500 NDL compounds or less than 1000 APL compounds are deposited into the PMLSC screening set (data points circled in Figure 7). At the early stage, the deposited candidate compounds surely filled a void cell due to the large distance to their nearest neighbors in the PMLSC compound collection. As the number of acquired compounds increased, newly acquired ones tended to be closer to their nearest-neighbors, and some of them might be located in the same cells where some PMLSC compounds were already present. As the circled points marked in Figure 7, the derivative of the number of filled cells began to decrease after acquiring more than 1500 NDL compounds or 1000 APL compounds, respectively. Subsequently, fewer and fewer void cells were filled as more candidate compounds were acquired. Finally, the number of filled cells reached a plateau after depositing approximately 2500 NDL compounds with 1844 filled void cells, and 1500 APL compounds with 1290 filled void cells. For comparison, candidate compounds from NDL and APL were sequentially merged into the PMLSC compound collection. Because the candidate libraries and the PMLSC screening set were prepared independently for the calculation, there was an equal probability to fill a void cell by any NDL or APL compound.
Figure 7.

The plots of the number of filled void cells as a function of the number of candidate compounds that are selected sequentially or acquired by the compound acquisition method. Plot (a) is for NDL compounds and plot (b) is for APL compounds.
A close analysis of plots in Figure 7 also reveals that the solid lines, representing the number of filled cells under the sequential compound acquisition, demonstrate nearly linear growth with the number of candidate compounds. The dashed lines in Figure 7 represent the difference in the number of filled cells between the established compound acquisition method and sequential compound selection. The dashed lines reached the plateau when approximately 1700 NDL compounds and 1200 APL compounds were acquired. After the plateau of the dashed lines, the diversity analysis showed that the low priority compounds did not significantly fill the void cells or increase the diversity of the PMLSC screening set. Consequently, the plateau indicated the optimal number of compounds to be acquired under the current chemistry space binning procedure. This conclusion was also supported by the number of acquired compounds with the default distance threshold, which instructed us to acquire 1648 compounds from NDL and 1096 compounds from APL.
The compound acquisition algorithm is established on various BCUT descriptors. In certain circumstances, some additional procedures are necessary to ensure that the to-beacquired compounds are of biological or pharmacological interest. Supporting Information Part II exemplifies the explicit removal of compounds with undesired properties, using Lipinski's Rule of Five18 and filter for Pan Assay Interference Compounds (PAINS)19. Rule of Five takes “drug-likeness” into account, and PAINS filter removes compounds that tend to interfere in assay signaling. Beyond these, other selection standards may be designed, depending on the research objective.
CONCLUSIONS
Through the application of BCUT descriptors, we have constructed multiple dimensional chemistry space for compound acquisition and prioritization. As pointed out above, highquality diverse compound collections play a significant role in virtual screening and HTS/HCS campaigns. In general, a structurally diverse library, or representative subset, is constructed directly or indirectly from compound collections in order to minimize the experimental bioassay costs, but this may result in a failure to identify active compounds or promising “leads”, namely false negatives. Thus, thoughtfully expanding the screening sets and testing these newly acquired compounds provide opportunities to cover more structural chemistry space, while avoiding duplicating the testing of structurally similar compounds. However, the acquisition of candidate compounds should be performed in carefully designed chemistry space that is within a biological meaningful context, because the interpretation of “diversity” is directly determined by chemistry-space coordinates. Cautions should be taken that solely blinded pursue of structural dissimilarity may bring in irrelevant compounds and impair the outcome of virtual screening or high-throughput screening.
In the compound acquisition protocol, candidate compounds are acquired or deposited into an existing compound collection according to Euclidean distance in BCUT chemistry space. In order to rationalize this approach, a regression analysis was carried out to model the correlation between chemistry distance and Tanimoto coefficient based on MACCS key. Statistical results indicated negative correlation between the two variables, supporting the conclusion that a pair of compounds tended to be dissimilar if the chemistry distance between them was large. Different sizes of NDL and APL subsets were then generated and compared to the PMLSC screening set in order to show the correlation between Tanimoto similarity index and chemistry space distance in a compound collection scale. Next, the diversity assessment was implemented to demonstrate how the number of filled void cells grew along with the number of acquired candidate compounds using either sequential selection or the compound acquisition protocol. We also wanted to point out that the choice of bin size would affect the diversity assessment as discussed above. The result illustrated the diversity increment by importing candidate compounds and helped to determine the optimal number of acquired compounds in a specific binning procedure.
Taken together, the compound acquisition and prioritization algorithm using BCUT descriptors is capable of retrieving compounds from candidate compound collections to increase structural diversity of an existing compound dataset. Currently, this method is being used for prioritizing to-be-synthesized combinatorial libraries in order to enhance the diversity-oriented library design and synthesis; however, it could also be view as a necessary complement to the existing techniques for building quality chemical libraries for HTS/HCS and virtual screening.
Supplementary Material
Acknowledgement
This project was supported by NIH grant R01 DA R025612 and P50 GM067082. We wish to thank Brielle R Schreiter and George Xie for proof-reading of the manuscript and both Tong Ying Shun and Paul Johnston for providing information concerning the UPDDI chemical library.
Footnotes
C.M., J.L. and X.X. conceived and designed the experiments, C.M. performed the experiments, C.M. and X.X. co-wrote the manuscript.
Supporting Information. The supporting information is divided into two parts. Part I describes the computational protocol and algorithm implementation. Part II illustrates complementary procedures to the acquisition algorithm, so that compounds with undesired properties are filtered out explicitly. This material is available free of charge via the Internet at http://pubs.acs.org.
Reference
- 1.(a) Beno BR, Mason JS. The design of combinatorial libraries using properties and 3D pharmacophore fingerprints. Drug Discov. Today. 2001;6(5):251–258. doi: 10.1016/s1359-6446(00)01665-2. [DOI] [PubMed] [Google Scholar]; (b) Xie X-Q. Exploiting PubChem for virtual screening. Expert Opin. Drug Discovery. 2010;5:1205–1220. doi: 10.1517/17460441.2010.524924. [DOI] [PMC free article] [PubMed] [Google Scholar]
- 2.Gillet VJ. New directions in library design and analysis. Curr. Opin. Chem. Biol. 2008;12(3):372–378. doi: 10.1016/j.cbpa.2008.02.015. [DOI] [PubMed] [Google Scholar]
- 3.Gorse AD. Diversity in medicinal chemistry space. Curr. Top. Med. Chem. 2006;6:3–18. doi: 10.2174/156802606775193310. [DOI] [PubMed] [Google Scholar]
- 4.Downs GM, Barnard JM. Clustering Methods and Their Uses in Computational Chemistry. In: Lipkowitz KB, Boyd DB, editors. Rev. Comput. Chem. Vol 18. John Wiley & Sons, Inc.; 2003. pp. 1–40. [Google Scholar]
- 5.Lajiness MS. Dissimilarity-based compound selection techniques. Perspect. Drug Discovery Des. 1997;7–8:65–84. [Google Scholar]
- 6.Pearlman RS, Smith KM. Novel Software Tools for Chemical Diversity. Perspect. Drug Discovery Des. 1998;9–11:339–353. [Google Scholar]
- 7.(a) Brown RD, Martin YC. Designing combinatorial library mixtures using a genetic algorithm. J Med Chem. 1997;40(15):2304–2313. doi: 10.1021/jm970033y. [DOI] [PubMed] [Google Scholar]; (b) Chen H, Borjesson U, Engkvist O, Kogej T, Svensson MA, Blomberg N, Weigelt D, Burrows JN, Lange T. ProSAR: a new methodology for combinatorial library design. J Chem Inf Model. 2009;49(3):603–614. doi: 10.1021/ci800231d. [DOI] [PubMed] [Google Scholar]
- 8.(a) Pearlman RS. Diverse Solutions User’s Manual. 1997:1–44. [Google Scholar]; (b) Pearlman RS, Smith KM. Metric validation and the receptor-relevant subspace concept. J. Chem. Inf. Comput. Sci. 1999;39:28–35. [Google Scholar]; (c) Burden FR. Molecular Identification Number for Substructure Searches. J. Chem. Inf. Comput. Sci. 1989;29:225–227. [Google Scholar]
- 9.(a) Stanton DT. Evaluation and Use of BCUT Descriptors in QSAR and QSPR Studies. J. Chem. Inf. Comput. Sci. 1999;39(1):11–20. [Google Scholar]; (b) Pirard B, Pickett SD. Classification of Kinase Inhibitors Using BCUT Descriptors. J. Chem. Inf. Comput. Sci. 2000;40(6):1431–1440. doi: 10.1021/ci000386x. [DOI] [PubMed] [Google Scholar]; (c) Gao H. Application of BCUT metrics and genetic algorithm in binary QSAR analysis. J. Chem. Inf. Comput. Sci. 2001;41(2):402–7. doi: 10.1021/ci000306p. [DOI] [PubMed] [Google Scholar]
- 10.(a) Menard PR, Mason JS, Morize I, Bauerschmidt S. Chemistry Space Metrics in Diversity Analysis, Library Design, and Compound Selection. J. Chem. Inf. Comput. Sci. 1998;38(6):1204–1213. [Google Scholar]; (b) Schnur D. Design and Diversity Analysis of Large Combinatorial Libraries Using Cell-Based Methods. J. Chem. Inf. Comput. Sci. 1999;39(1):36–45. [Google Scholar]
- 11.Xie XQ, Chen JZ. Data mining a small molecule drug screening representative subset from NIH PubChem. J. Chem. Inf. Model. 2008;48(3):465–475. doi: 10.1021/ci700193u. [DOI] [PubMed] [Google Scholar]
- 12.Zhang L, Xiao Q, Ma C, Xie X-Q, Floreancig PE. Construction of a Bicyclic β-Benzyloxy and β-Hydroxy Amide Library through a Multicomponent Cyclization Reaction. J. Comb. Chem. 2009;11(4):640–644. doi: 10.1021/cc800200h. [DOI] [PMC free article] [PubMed] [Google Scholar]
- 13.DiverseSolutions, Version 6.3.2. St. Louis, MO: Tripos, Inc.; 2005. p. CI800276T. [Google Scholar]
- 14.Stahura FL, Bajorath J. Partitioning methods for the identification of active molecules. Curr. Med. Chem. 2003;10(8):707–715. doi: 10.2174/0929867033457881. [DOI] [PubMed] [Google Scholar]
- 15.Tripos Selector Manual. :134–135. [Google Scholar]
- 16.(a) Newman DJ. Natural Products as Leads to Potential Drugs: An Old Process or the New Hope for Drug Discovery? J. Med. Chem. 2008;51(9):2589–2599. doi: 10.1021/jm0704090. [DOI] [PubMed] [Google Scholar]; (b) Rishton GM. Natural products as a robust source of new drugs and drug leads: past successes and present day issues. Am. J. Cardiol. 2008;101(10A):43D–49D. doi: 10.1016/j.amjcard.2008.02.007. [DOI] [PubMed] [Google Scholar]
- 17.MACCS keys. San Leandro, CA: MDL information Systems; [Google Scholar]
- 18.Lipinski CA, Lombardo F, Dominy BW, Feeney PJ. Experimental and computational approaches to estimate solubility and permeability in drug discovery and development settings. Adv Drug Deliver Rev. 2001;46(1–3):3–26. doi: 10.1016/s0169-409x(00)00129-0. [DOI] [PubMed] [Google Scholar]
- 19.Baell JB, Holloway GA. New Substructure Filters for Removal of Pan Assay Interference Compounds (PAINS) from Screening Libraries and for Their Exclusion in Bioassays. J Med Chem. 2010;53(7):2719–2740. doi: 10.1021/jm901137j. [DOI] [PubMed] [Google Scholar]
Associated Data
This section collects any data citations, data availability statements, or supplementary materials included in this article.