

Abstract
Background
Results from the Diuretic Optimization Strategies in Acute Heart Failure (DOSE-AHF) study suggest that an initial continuous infusion of loop diuretics is not superior to bolus dosing with regard to clinical endpoints in AHF. We hypothesized that outpatient furosemide dose was associated with congestion and poorer renal function, and explored the hypothesis that a continuous infusion may be more effective in patients on higher outpatient diuretic doses.
Methods
DOSE-AHF randomized 308 patients within 24 hours of admission to high vs. low initial intravenous diuretic dose given as either a continuous infusion or bolus. We compared baseline characteristics and assessed associations between mode of administration (bolus vs. continuous) and outcomes in patients receiving high-dose (≥120 mg furosemide equivalent, n=177) versus low-dose (<120 mg furosemide equivalent, n=131) outpatient diuretics.
Results
Patients on higher doses of furosemide were less frequently on renin-angiotensin system inhibitors (P=.01), and had worse renal function and more advanced symptoms. There was a significant interaction between outpatient dose and mode of therapy (P=0.01) with respect to net fluid loss at 72 hours after adjusting for creatinine and intensification strategy. Admission diuretic dose was associated with an increased risk of death or rehospitalization at 60 days (adjusted HR=1.08 per 20-mg increment in dose, 95% CI 1.01–1.16, P=.03).
Conclusions
In acute HF, patients on higher diuretic doses have greater disease severity, and may benefit from an initial bolus strategy.
Keywords: Heart failure, prognosis, diuretics
Introduction
Despite lack of evidence of clinical benefit (and potential harm) in chronic heart failure,1,2 loop diuretics remain a cornerstone of decongestive therapy in acute heart failure.3 Diuretic escalation is employed in the outpatient setting to prevent heart failure (HF) admission, but can be associated with worsening renal function, neurohormonal activation, diuretic refractoriness, and worse outcomes.4 The proposed explanation for diuretic dose escalation is multifactorial,5 including progressive renal dysfunction, bowel wall edema from elevation of systemic venous pressures,6 and increased renal absorption of sodium during intra-dosing periods.7 Prior to the publication of the results of the Diuretic Optimization Strategies in Acute Heart Failure (DOSE) trial,8 data primarily from small observational studies and meta-analyses suggested that continuous infusion diuretic therapy was more effective than intravenous boluses at decongestion, without compromising renal function.9
DOSE was the first randomized clinical trial to address the hypothesis that mode of diuretic therapy may affect decongestion, renal function, and clinical outcomes in acute decompensated heart failure. Using a 2-by-2 factorial design, 308 patients were randomly assigned within 24 hours of heart failure admission to receive high dose vs. low dose and continuous vs. bolus intravenous diuretics at either dose. There were no differences in symptom relief, renal function, net fluid loss, or death and rehospitalization at 60 days between patients receiving bolus versus continuous infusion diuretics. Despite the overall neutral results with regard to diuretic strategy (bolus vs. continuous), we sought to test the hypothesis that outpatient furosemide dose may be associated with markers of congestion and worsening renal function in patients with acute HF. Furthermore, we hypothesized that patients with acute decompensated HF may respond differentially to bolus versus continuous infusion diuretic therapy as a function of outpatient diuretic dose.
Methods
Study Population
Patients with chronic heart failure receiving outpatient loop diuretics (at least 80 mg furosemide equivalent per day) were eligible for enrollment in DOSE-AHF if they were identified within 24 hours of an admission for acute decompensated heart failure, had a systolic blood pressure ≥90 mm Hg and a serum creatinine level ≤3.0 mg/dl. The details of the study design, methods and primary results have been published previously.8 Using a double-dummy and 2-by-2 factorial design, 308 patients were randomly assigned in a 1:1:1:1 ratio to (1) high intensification (2.5 × oral outpatient dose) intravenous (IV) furosemide bolus administered twice daily; (2) high intensification (2.5 × oral dose) IV furosemide administered by continuous infusion; (3) low intensification (1 × oral dose) IV furosemide bolus administered twice daily; or (4) low intensification (1 × oral dose) IV furosemide administered by continuous infusion.
Statistical Analysis
All 308 patients in the DOSE-AHF study were included in this analysis. For the purposes of regression models, patients were excluded from certain analyses if data elements were missing. Patients were stratified by the median qualifying outpatient furosemide dose in the overall DOSE-AHF population (120 mg per day; interquartile range 80–160 mg per day). Baseline characteristics, including age, sex, race, etiology of HF, New York Heart Association (NYHA) functional class, left ventricular ejection fraction (LVEF), hypertension, diabetes, medical therapy, signs of congestion, and relevant laboratories and biomarkers were compared between the ≥120 mg and <120 mg strata using Wilcoxon signed rank test for continuous variables and Chi-square test for categorical variables.
In order to identify whether mode of diuretic therapy, outpatient furosemide dose, and the interaction were independent predictors of clinical outcomes in HF, different regression models were constructed to identify predictors of worsening renal function (as assessed by change in serum creatinine at 72 hours), poorer dyspnea relief (by global visual analog scale [VAS] at 72 hours), decongestion (by net fluid loss at 72 hours [NFL72], and change in weight at 48 hours) and reduction in relevant serum biomarkers (by change in cystatin C or N-terminal pro-B-type natriuretic peptide [NT-proBNP] at 72 hours). Each model was built in stages.
The first model included only qualifying outpatient furosemide dose to determine if there was any univariate relationship between furosemide dose and each endpoint. Successively, mode of administration (continuous or bolus), initial IV diuretic dose intensity (high or low dose), and interaction terms (initial IV diuretic dose intensity and outpatient diuretic dose; mode and outpatient furosemide dose) were added to the model. In addition, the baseline value of the specific endpoint being modeled was added as a covariate (e.g., baseline weight. and baseline plasma levels of creatinine, cystatin C and NT-proBNP). When interaction terms were significant, a P value only for the interaction term (not its comprising main effects) was reported; non-significant interaction terms were dropped from the regression models in favor of main effects. Any patient missing the endpoint or a covariate predictor variable was excluded from the models (as specified in Tables 2–4 below). Each of the above models was run using a general linear model.
Table 2.
Regression Models for Predictors of Change in Serum Creatinine, Global VAS, Cystatin C and NT-proBNP at 72 hours
| Covariate | Change in Serum Creatinine at 72 h (N=301) | Change in Global VAS at 72 h (N=303) | % change in Serum Cystatin C at 72 h (N=247) | % change in NT-proBNP at 72 h (N=245) |
|---|---|---|---|---|
|
| ||||
| P value | P value | P value | P value | |
|
|
||||
| Baseline creatinine | <.0001 (−) | .43 (+) | NA | NA |
| Baseline covariate | NA | <.0001 (+) | <.0001 (−) | .40 (−) |
| Outpatient furosemide dose | 22 (+) | .84 (+) | .01 (+) | .44 (+) |
| Continuous mode of therapy | .40 (+) | .48 (+) | .16 (+) | .85 (−) |
| High initial IV diuretic dose | .21 (+) | .06 (+) | .30 (+) | .01 (−) |
Baseline covariate indicates the results of regression using the baseline value of the covariate (e.g., baseline cystatin C level) as a covariate to predict the dependent variable (e.g., change in cystatin C level). The (+) and (−) after the P values signify the directionality of the regression coefficients. NA indicates that the covariate was not tested in the regression model. The interaction terms between furosemide dose and mode and furosemide dose and intensification were tested in a separate model and found to be not significant. They were subsequently not included in the model results presented. The number (N) of patients with data available for each regression model is specified. Abbreviations: NT-proBNP, N-terminal pro-B-type natriuretic peptide; VAS, visual analog scale.
Table 4.
Regression Model* to Predict Net Fluid Loss at 72 hours, including Clinical and Laboratory Covariates Assessed at or before Study Enrollment
| Covariate | P value |
|---|---|
| Age | .02 (−) |
| Sex | .07 (−) |
| LVEF | .06 (+) |
| NYHA class | .59 (−) |
| Baseline global VAS | .51 (+) |
| Baseline hemoglobin | .30 (−) |
| Serum sodium | .45 (+) |
| Baseline BUN | .24 (+) |
| Baseline troponin I | .69 (−) |
| Baseline NT-proBNP | .27 (+) |
| Baseline cystatin C | .06 (−) |
| Baseline creatinine | .32 (−) |
| Furosemide dose | Interaction factor |
| Continuous mode of therapy | Interaction factor |
| Continuous mode × outpatient dose | .0028 (−) |
| High initial IV diuretic dose | .0007 (+) |
198 patients had data available for this model.
Abbreviations: BUN, blood urea nitrogen; LVEF, left ventricular ejection fraction; NT-proBNP, N-terminal pro-B-type natriuretic peptide, NYHA, New York Heart Association; VAS, visual analog scale. The (+) and (−) after the P values signify the directionality of the regression
To assess the impact of outpatient furosemide dose on a composite clinical outcome of death or rehospitalization at 60 days, Cox proportional hazards models (to identify predictors of the outcome) and Kaplan-Meier survival analysis were used to test the statistical significance of difference between the ≥120 mg and <120 mg outpatient furosemide dose strata. Analyses were performed using validated SAS software (SAS Institute, Inc, Cary, NC), with P<.05 considered statistically significant, unless otherwise specified.
Study Funding
This study was supported by a Post-Doctoral Fellowship from the American Heart Association to RVS (11POST6810000) and the Heart Failure Clinical Research Network (U01-HL084877). The overall DOSE-AHF study was conducted with funding from the National Institutes of Health (U01 HL084904-01).
Results
Baseline Characteristics
Baseline clinical and laboratory characteristics of the study population are shown in Table 1, stratified by median qualifying outpatient furosemide dose (120 mg per day). In the high outpatient dose (≥120 mg per day) group, the median dose was 160 mg (interquartile range [IQR] 160–190 mg). In the low outpatient dose (<120 mg per day) group, the median dose was 80 mg (IQR 80–80 mg). Compared to patients on <120 mg per day, patients receiving higher outpatient diuretic doses were less likely to be on an angiotensin-converting enzyme (ACE) inhibitor or angiotensin receptor blocker (58% vs. 72%, P=.01), had higher levels of BUN (41±24 vs. 32±20, P=.001), serum creatinine (1.6±0.5 vs. 1.4±0.5, P=.003) and cystatin C (1.7±0.6 vs. 1.4±0.5, P=.001), and poorer overall global well-being and dyspnea by VAS (both P≤.01). There was no difference between the two groups in age, sex, cause of HF, HF hospitalization within the past year, NYHA class, LVEF, signs of HF, or NT-proBNP concentration.
Table 1.
Baseline Characteristics of Patients on Lower vs. Higher Admission Oral Dose of Loop Diuretics
| Characteristic | Furosemide dose <120 mg (N=131) | Furosemide dose ≥120 mg (N=177) | P value |
|---|---|---|---|
| Age, years | |||
| Mean (SD) | 66 (14) | 66 (13) | 0.91 |
| Median (25th, 75th) | 69 (54, 77) | 67 (56, 77) | |
| Male sex, n (%) | 90 (69) | 136 (77) | 0.11 |
| White race, n (%) | 88 (67) | 134 (76) | 0.10 |
| Ischemic cause of HF, n (%) | 73 (56) | 103 (58) | 0.67 |
| HF hospitalizations in past year | |||
| Mean (SD) | 1.5 (1.4) | 1.6 (1.9) | 0.59 |
| Median (25th, 75th) | 1.0 (1.0, 2.0) | 1.0 (0.0, 2.0) | |
| NYHA class, n (%) | |||
| I/II | 3 (3) | 9 (6) | 0.12 |
| III | 81 (70) | 96 (59) | |
| IV | 31 (27) | 57 (35) | |
| LVEF | |||
| Mean (SD) | 34 (18) | 35 (17) | 0.59 |
| Median (25th, 75th) | 27 (20, 50) | 30 (20, 50) | |
| <50%, n (%) | 93 (74) | 126 (72) | 0.79 |
| Co-morbidities, n (%) | |||
| Hypertension | 102 (78) | 144 (81) | 0.45 |
| Diabetes | 61 (47) | 97 (55) | 0.15 |
| Medications, n (%) | |||
| ACEI or ARB | 94 (72) | 103 (58) | 0.01 |
| Beta-blocker | 111 (85) | 145 (82) | 0.51 |
| Aldsoterone antagonist | 36 (28) | 50 (28) | 0.88 |
| Other diuretics | |||
| Metolazone, n (%) | |||
| Yes, daily | 9 (7) | 20 (11) | 0.14 |
| Yes, as needed | 5 (4) | 13 (7) | |
| Hydrochlorothiazide, n (%) | |||
| Yes, daily | 1 (1) | 4 (2) | 0.51 |
| Yes, as needed | 0 (0) | 1 (1) | |
| JVP ≥8 cm, n (%) | 113 (92) | 154 (91) | 0.82 |
| Moderate-severe edema, n (%) | 105 (80) | 138 (78) | 0.64 |
| Serum sodium, mEq/L | |||
| Mean (SD) | 139 (4) | 138 (4) | 0.20 |
| Median (25th, 75th) | 139 (136, 141) | 138 (136, 140) | |
| BUN, mg/dl | |||
| Mean (SD) | 32 (20) | 41 (24) | 0.001 |
| Median (25th, 75th) | 27 (19, 41) | 35 (22, 55) | |
| Creatinine, mg/dl | |||
| Mean (SD) | 1.40 (0.48) | 1.57 (0.53) | 0.003 |
| Median (25th, 75th) | 1.30 (1.02, 1.70) | 1.50 (1.15, 1.91) | |
| Cystatin C, mg/dl | |||
| Mean (SD) | 1.44 (0.53) | 1.65 (0.57) | 0.001 |
| Median (25th, 75th) | 1.37 (1.01, 1.75) | 1.58 (1.21, 2.06) | |
| NT-proBNP, pg/ml | |||
| Mean (SD) | 7236 (6914) | 7585 (7614) | 0.77 |
| Median (25th, 75th) | 4651 (2442, 9699) | 4435 (2466, 11122) | |
| Uric acid, mg/dl | |||
| Mean (SD) | 9.4 (2.4) | 10.1 (2.7) | 0.10 |
| Median (25th, 75th) | 9.7 (7.8, 11.0) | 9.7 (8.2, 11.6) | |
| Global well being VAS | |||
| Mean (SD) | 49 (23) | 41 (24) | 0.002 |
| Median (25th, 75th) | 53 (31, 65) | 42 (22, 55) | |
| Dyspnea VAS | |||
| Mean (SD) | 54 (27) | 46 (27) | 0.01 |
| Median (25th, 75th) | 57 (37, 74) | 45 (25, 67) |
Abbreviations: BUN, blood urea nitrogen; HF, heart failure; JVP, jugular venous pressure; LVEF, left ventricular ejection fraction; NT-proBNP, N-terminal pro-B-type natriuretic peptide; NYHA, New York Heart Association; SBP, systolic blood pressure; VAS, visual analog scale.
Outpatient Diuretic Dose and Mode of Administration as Predictors of Decongestion and Renal Function
Results of regression models are shown in Tables 2–4. In a model to predict change in serum creatinine from baseline to 72 hours, only baseline serum creatinine (P<.0001; Table 2) emerged as an independent predictor, even when mode of therapy and initial IV loop diuretic dose intensity (high vs. low) were included in the model. Similarly, only baseline global VAS predicted global VAS at 72 hours (P<.0001; Table 2). In a model to predict percent change in serum cystatin C concentration adjusted for mode of therapy, initial IV diuretic dose intensity, and baseline cystatin C concentration, only qualifying furosemide dose and baseline cystatin C concentration remained as independent predictors (P=.01 and P<.0001, respectively; Table 2). Of note, in each of these models (predicting change in cystatin C, creatinine, or global VAS), the effect of the interaction between mode of therapy and outpatient furosemide dose on these outcomes was separately tested and found to be non-significant (P>.05 for all). The interaction terms were removed from the final models.
Changes in natriuretic peptide concentration, net fluid loss at 72 hours, and weight change at 48 hours were used as markers of decongestion in models involving mode of administration and initial IV diuretic dose intensity as covariates. No covariates predicted percent change in NT-proBNP at 72 hours except intensification strategy (Table 2). In an adjusted model of weight change at 48 hours, only intensification strategy remained an independent predictor (P=.0002; Table 3). There was no significant relationship between outpatient furosemide dose or mode of therapy on weight change at 48 hr, and no effect of their interaction on weight change at 48 hr.
Table 3.
Regression Models for Predictors of Change in Weight at 48 Hours and Net Fluid Loss at 72 hours
| Covariate | Change in Weight at 48 hours (N=294) | Net Fluid Loss at 72 hours (N=242) |
|---|---|---|
|
| ||
| P value | P value | |
|
|
||
| Baseline creatinine | NA | .0062 |
| Baseline weight | .36 (+) | NA |
| Outpatient furosemide dose | 94 (+) | Interaction factor |
| Continuous mode of therapy | .31 (−) | Interaction factor |
| Continuous mode × outpatient dose | NA | .01 |
| High initial IV diuretic dose | .0002 (−) | .001 |
The (+) and (−) after the P values signify the directionality of the regression coefficients. NA indicates that the covariate was not tested in the regression model. The number (N) of patients with data available for each regression model is specified. The P values for the interaction factors are not interpretable on their own given their relationship with the interaction term and are not reported.
In a model to predict net fluid loss at 72 hours as a marker of decongestion including outpatient dose, mode of therapy, their interaction, baseline creatinine, and initial dose intensity, there was a significant interaction between mode of therapy and outpatient furosemide dose on NFL72 (P=.02; Table 3). For every 10 mg higher in qualifying outpatient furosemide dose, patients given bolus diuretics experienced 95 ml more NFL72, whereas patients given continuous infusion experienced 88 ml less NFL72. The benefit of a bolus strategy over continuous infusion on NFL72 appeared in patients on >140 mg outpatient furosemide equivalents and persisted regardless of whether a high or a low intensity intravenous regimen was chosen at randomization (Figure 1). When this model was further adjusted for age, sex, LVEF, NYHA class, global VAS, BUN, hermoglobin, sodium, creatinine, and serum biomarkers (troponin I, NT-proBNP, cystatin C), the interaction between mode of administration and outpatient dose remained predictive of NFL72 (P=.0028; Table 4), with similar effect of more NFL72 with a bolus strategy at the highest doses of outpatient diuretic.
Figure 1.
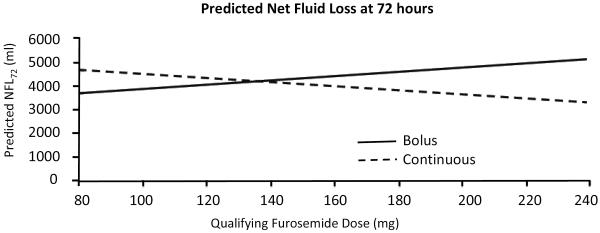
Predicted net fluid loss at 72 hours, based on a multivariate model containing qualifying furosemide dose, mode of administration (bolus or continuous infusion), and an interaction term. Similar results (e.g., greater net fluid loss at lower qualifying doses with a bolus strategy) were obtained when stratified by intravenous dose intensity (data not shown).
Outpatient Furosemide Dose and Event-free Survival at 60 Days
In an unadjusted Cox proportional hazards model for predictors of time to discharge containing only outpatient furosemide dose as a covariate, a higher outpatient furosemide dose was associated with a longer hospital length of stay (a lower discharge probability; HR = 0.95 per 20 mg increase in furosemide dose; 95% CI 0.91–0.99; P=.01). This association remained significant when adjusted for mode of therapy (HR = 0.95, 95% CI 0.91–0.99; P=.01), and the effect of an interaction between mode of therapy and outpatient dose on discharge was not significant (P=.62). Similar results were obtained when outpatient furosemide dose was stratified by median value (<120 mg vs. ≥120 mg), such that patients on ≥120 mg outpatient furosemide dose had a longer length of stay compared to patients on lower doses (a lower discharge rate; HR = 0.77; 95% CI 0.61–0.97, P=.03), and remained significant when adjusted for mode of therapy.
In an unadjusted Cox proportional hazards model for predictors of a composite outcome of death or rehospitalization at 60 days, outpatient furosemide dose (treated in 20 mg increments) was again a predictor of the composite outcome (unadjusted HR = 1.10 per 20 mg increment in dose; 95% CI 1.03–1.18, P=.003). This association persisted in a model including dose intensification, age, LVEF, creatinine, NT-proBNP, BUN, systolic blood pressure, troponin I, cystatin C, and number of hospitalizations in the past year (adjusted HR = 1.08 per 20 mg increment in dose; 95% CI 1.01–1.16, P=.03). Of note, the effect of an interaction between outpatient dose and mode of therapy on the composite outcome was not significant (P=.95). The results of an adjusted Kaplan-Meier survival analysis (excluding the interaction between mode of therapy and outpatient dose, as it was non-significant) for death and re-hospitalization at 60 days stratified by outpatient furosemide dose is shown in Figure 2.
Figure 2.

Kaplan-Meier survival curves for death or re-hospitalization at 60 days, stratified by outpatient furosemide dose.
Discussion
Although loop diuretics are a mainstay of therapy in the treatment of acute decompensated heart failure, there is limited data from randomized clinical trials to guide mode of therapy and dosing strategies. In this study, we found that a higher outpatient diuretic dose (defined as ≥120 mg furosemide or its equivalent) is associated with increased death and re-hospitalization for HF, as well as markers of greater HF severity (e.g., medication use, renal function, and cystatin C levels). Also, patients on a higher outpatient diuretic dose experience more initial diuresis (by net fluid loss in 72 hr) in response to a bolus strategy versus a continuous infusion strategy. Conversely, those patients on lower doses of diuretic therapy on admission may have more diuresis to a continuous infusion initially. In the face of neutral results from the overall DOSE study, these results suggest that some patients with HF may derive benefit from a tailored initial approach to diuretic therapy.
Our study has implications on the mechanism of diuretic refractoriness in HF. Although we cannot differentiate more advanced chronic kidney disease from progressive renal injury in the face of an escalating outpatient diuretic dose as the cause of renal dysfunction in patients on higher admission furosemide doses, the presence of renal dysfunction on admission with acute decompensated HF (“cardiorenal syndrome”) in patients on increased diuretics places these patients at risk for diuretic refractoriness. From a mechanistic perspective, the presence of diuretic refractoriness has been attributed to elevated venous pressures (with altered absorption kinetics and a lower transglomerular filtration pressure),6,10 and intra-renal injury resulting from diuretics, neurohormonal activation and local hemodynamic changes.4 Of note, the incidence of elevated JVP and moderate-severe edema was similar in both groups, suggesting that differences in response to diuretic therapy cannot be solely explained by differential elevation in venous pressure. Consistent with a higher risk clinical profile, patients on higher doses of admission diuretics had a longer hospital stay and poorer event-free survival at 60 days. These results are consistent with a recent report from the Beta-Blocker Evaluation of Survival Trial (BEST),11 in which patients on >160 mg/day furosemide equivalents had less frequent use of ACE inhibitor therapy, poorer renal function, higher serum norepinephrine levels, and impaired quality of life and long-term survival compared to patients on lower dose diuretics. However, after controlling for baseline variables, higher-dose diuretics were not associated with increased mortality in BEST. In contrast, in the Seattle Heart Failure Model (a commonly used prognostic algorithm in ambulatory HF), diuretic dose is a powerful and independent predictor of survival, even after adjustment for medication use, renal function, and serum sodium.12 In our multivariable analyses controlling for baseline and treatment covariates, the association between high dose diuretics and hospital length of stay and 60-day event-free survival also lost significance. Although the divergence between the ambulatory models11,12 and our results may be in part explained by a higher-risk inpatient HF population studied in DOSE, collectively these results suggest that high-dose diuretics are a powerful marker of clinical instability and worse outcomes in HF.
When surrogate endpoints of decongestion (weight change at 48 hours and net fluid loss at 72 hours) were examined, we found several interesting, discordant relationships. In a model of early weight loss, we found that higher initial IV diuretic doses were associated with greater weight loss at 48 hours, similar to the overall DOSE-AHF results, independent of mode of administration or outpatient furosemide dose. Clinically, this finding implies that higher initial IV doses—regardless of mode of administration—may be more effective in decongesting an acute HF patient at 48 hours, regardless of how the diuretic is administered. These results are in concert with current ACC/AHA guidelines that recommend that IV diuretic dosing on admission for acute HF should “equal or exceed” the outpatient dose.13 On the other hand, when we considered net fluid loss at 72 hours, a different surrogate marker of decongestion, we found that the interaction between outpatient furosemide dose and mode of therapy predicted net fluid loss. Specifically, patients on higher doses of outpatient loop diuretics benefit from an initial bolus strategy, whereas patients on lower doses have greater fluid loss from continuous therapy.
These discordant results are especially compelling given the lack of overall benefit on dyspnea scores in the overall DOSE trial, further clarifying the disparity between patient-centered and clinical/biochemical endpoints. Specifically, the use of weight loss as a clinically relevant endpoint in HF has recently come into question.14,15 Our results suggest that an up-front strategy of continuous diuretic infusion, specifically in patients on lower doses of admission diuretics, may be independently associated with greater net fluid loss at 72 hours, but not with weight loss at 48 hours, suggesting that the time point of observation did not confound our results. There are data with vasopressin antagonists showing lack of long-term clinical benefit despite persistent weight loss in acute HF.16,17 Conversely, in the ESCAPE study, Mehta et al.15 found no relationship between weight loss and clinical endpoints. From a practical standpoint, the assessment of weight change is reliant on multiple factors unrelated to underlying HF status (e.g., time of weight assessment, clothing, mechanical properties of the scale), whereas the assessment of net fluid loss can be more precisely measured.
Is there a physiologic explanation for why patients on a higher outpatient oral diuretic dose might benefit from a high dose of an IV loop diuretic given as a bolus rather than as a continuous infusion? One potential explanation involves the need for a higher initial dose of bolus diuretics in patients who present with diuretic refractoriness. Indeed, an optimal method to achieve high and sustained renal diuretic concentration may be a bolus followed by continuous infusion to achieve immediate and sustained effects.5 Conversely, in patients receiving lower doses of outpatient diuretics, a large initial bolus may not be necessary to achieve a high tubular concentration, as these patients may not be as diuretic refractory. Interestingly, we saw associations between mode of administration and net fluid loss at 72 hours, independent of biomarkers of diuretic refractoriness (including creatinine and cystatin C). As such, alternative mechanisms of cardiorenal physiology,18 including differences in degree of neurohormonal activation and intra-renal mechanisms of sodium avidity, are possible. Testani et al.11 recently identified an association between high-dose loop diuretics and increased mortality in a subgroup of HF patients with high BUN levels. In their analysis, serum norepinephrine was associated with BUN, suggesting a link between high dose diuretic therapy, renal dysfunction, neurohormonal activation, and mortality. Elevations in serum BUN may indicate an ongoing vicious cycle of crosstalk between the heart and kidney, involving activation of neurohormones well-known to enforce poor outcomes and adverse physiology in HF (e.g., arginine vasopressin).19 Although we did not measure norepinephrine levels in our cohort, patients on higher outpatient furosemide doses had higher BUN levels, lending support to a cardiac-renal-neurohormonal axis. Indeed, alternative volume management strategies that take into account BUN may be warranted to improve AHF outcomes, but require testing in prospective studies.
Our results have several limitations. This analysis represents a substudy of a neutral randomized clinical trial, and our associations should be viewed as hypothesis-generating. As such, the regression models discussed here are exploratory. In addition, in the overall DOSE-AHF study, physicians caring for study patients were allowed to change diuretic therapy at 48 hours, which may have affected the net fluid loss at 72 hours between the continuous and bolus groups. However, we did not observe a difference in the frequency of change in diuretic therapy at 48 hours between the two groups (data not shown).
In conclusion, the relative benefit of bolus vs. continuous infusion diuretics during admission for acute HF may depend on outpatient diuretic dose. Patients with acute HF on a higher outpatient loop diuretic dose (≥120 mg furosemide equivalent) may benefit from an initial strategy of bolus intravenous diuretics with a higher net fluid loss at 72 hours, as compared to a continuous infusion. Patients on a lower outpatient dose of loop diuretic may have more net fluid loss at 72 hours with an initial continuous infusion. Further research should be done to identify subgroups that may benefit from initial bolus or continuous therapy in acute HF.
Acknowledgement
The authors would like to acknowledge the work of the Heart Failure Network research investigators and coordinators, the study coordination of the Duke Clinical Research Institute, and the participation of the DOSE-AHF patients.
Footnotes
Disclosures None
References
- 1.Cooper HA, Dries DL, Davis CE, et al. Diuretics and risk of arrhythmic death in patients with left ventricular dysfunction. Circulation. 1999;100:1311–1315. doi: 10.1161/01.cir.100.12.1311. [DOI] [PubMed] [Google Scholar]
- 2.Eshaghian S, Horwich TB, Fonarow GC. Relation of loop diuretic dose to mortality in advanced heart failure. Am J Cardiol. 2006;97:1759–1764. doi: 10.1016/j.amjcard.2005.12.072. [DOI] [PubMed] [Google Scholar]
- 3.Gheorghiade M, Pang PS. Acute heart failure syndromes. J Am Coll Cardiol. 2009;53:557–573. doi: 10.1016/j.jacc.2008.10.041. [DOI] [PubMed] [Google Scholar]
- 4.Ronco C, Haapio M, House AA, et al. Cardiorenal syndrome. J Am Coll Cardiol. 2008;52:1527–1539. doi: 10.1016/j.jacc.2008.07.051. [DOI] [PubMed] [Google Scholar]
- 5.Brater DC. Diuretic therapy. N Engl J Med. 1998;339:387–395. doi: 10.1056/NEJM199808063390607. [DOI] [PubMed] [Google Scholar]
- 6.Mullens W, Abrahams Z, Francis GS, et al. Importance of venous congestion for worsening of renal function in advanced decompensated heart failure. J Am Coll Cardiol. 2009;53:589–596. doi: 10.1016/j.jacc.2008.05.068. [DOI] [PMC free article] [PubMed] [Google Scholar]
- 7.Abdallah JG, Schrier RW, Edelstein C, et al. Loop diuretic infusion increases thiazide-sensitive Na(+)/Cl(−)-cotransporter abundance: role of aldosterone. J Am Soc Nephrol. 2001;12:1335–1341. doi: 10.1681/ASN.V1271335. [DOI] [PubMed] [Google Scholar]
- 8.Felker GM, Lee KL, Bull DA, et al. Diuretic strategies in patients with acute decompensated heart failure. N Engl J Med. 2011;364:797–805. doi: 10.1056/NEJMoa1005419. [DOI] [PMC free article] [PubMed] [Google Scholar]
- 9.Salvador DR, Rey NR, Ramos GC, et al. Continuous infusion versus bolus injection of loop diuretics in congestive heart failure. Cochrane Database Syst Rev. 2005:CD003178. doi: 10.1002/14651858.CD003178.pub3. [DOI] [PMC free article] [PubMed] [Google Scholar]
- 10.Vasko MR, Cartwright DB, Knochel JP, et al. Furosemide absorption altered in decompensated congestive heart failure. Ann Intern Med. 1985;102:314–318. doi: 10.7326/0003-4819-102-3-314. [DOI] [PubMed] [Google Scholar]
- 11.Testani JM, Cappola TP, Brensinger CM, et al. Interaction between loop diuretic-associated mortality and blood urea nitrogen concentration in chronic heart failure. J Am Coll Cardiol. 2011;58:375–382. doi: 10.1016/j.jacc.2011.01.052. [DOI] [PMC free article] [PubMed] [Google Scholar]
- 12.Levy WC, Mozaffarian D, Linker DT, et al. The Seattle Heart Failure Model: prediction of survival in heart failure. Circulation. 2006;113:1424–1433. doi: 10.1161/CIRCULATIONAHA.105.584102. [DOI] [PubMed] [Google Scholar]
- 13.Hunt SA, Abraham WT, Chin MH, et al. 2009 focused update incorporated into the ACC/AHA 2005 Guidelines for the Diagnosis and Management of Heart Failure in Adults: a report of the American College of Cardiology Foundation/American Heart Association Task Force on Practice Guidelines: developed in collaboration with the International Society for Heart and Lung Transplantation. Circulation. 2009;119:e391–e479. doi: 10.1161/CIRCULATIONAHA.109.192065. [DOI] [PubMed] [Google Scholar]
- 14.Jessup M. Defining success in heart failure: the end-point mess. Circulation. 2010;121:1977–1980. doi: 10.1161/CIRCULATIONAHA.110.946988. [DOI] [PubMed] [Google Scholar]
- 15.Mehta RH, Rogers JG, Hasselblad V, et al. Association of weight change with subsequent outcomes in patients hospitalized with acute decompensated heart failure. Am J Cardiol. 2009;103:76–81. doi: 10.1016/j.amjcard.2008.08.041. [DOI] [PMC free article] [PubMed] [Google Scholar]
- 16.Gheorghiade M, Konstam MA, Burnett JC, Jr., et al. Short-term clinical effects of tolvaptan, an oral vasopressin antagonist, in patients hospitalized for heart failure: the EVEREST Clinical Status Trials. JAMA. 2007;297:1332–1343. doi: 10.1001/jama.297.12.1332. [DOI] [PubMed] [Google Scholar]
- 17.Konstam MA, Gheorghiade M, Burnett JC, Jr., et al. Effects of oral tolvaptan in patients hospitalized for worsening heart failure: the EVEREST Outcome Trial. JAMA. 2007;297:1319–1331. doi: 10.1001/jama.297.12.1319. [DOI] [PubMed] [Google Scholar]
- 18.Shah RV, Givertz MM. Managing acute renal failure in patients with acute decompensated heart failure: the cardiorenal syndrome. Curr Heart Fail Rep. 2009;6:176–181. doi: 10.1007/s11897-009-0025-5. [DOI] [PubMed] [Google Scholar]
- 19.Schrier RW. Blood urea nitrogen and serum creatinine: not married in heart failure. Circ Heart Fail. 2008;1:2–5. doi: 10.1161/CIRCHEARTFAILURE.108.770834. [DOI] [PubMed] [Google Scholar]