

Abstract
The blood storage lesion involves morphological and biochemical changes of red blood cells (RBCs) that occur during storage. These include conversion of the biconcave disc morphology to a spherical one, decreased mean corpuscular hemoglobin concentration, varied mean corpuscular volume, reduced integrity of the erythrocyte membrane with formation of microparticles, and increased cell-free hemoglobin. We studied the extent that older stored red blood cells scavenge nitric oxide (NO) faster than fresher stored red blood cells. Using electron paramagnetic resonance spectroscopy and stopped-flow absorption spectroscopy to measure the rate of NO uptake and reaction with hemoglobin in red cells, we found that older stored red blood cells scavenge NO about 1.8 times faster than fresher ones. Based on these experimental data, we simulated NO scavenging by fresher or older stored red blood cells with a biconcave or spherical geometry, respectively, in order to explore the mechanism of NO scavenging related to changes that occur during blood storage. We found that red blood cells with a spherical geometry scavenges NO about 2 times slower than ones with a biconcave geometry, and a smaller RBC hemoglobin concentration or volume increases NO scavenging by red blood cells. Our simulations demonstrate that even the most extreme possible changes in mean corpuscular hemoglobin concentration and mean corpuscular volume that favor increased NO scavenging are insufficient to account for what is observed experimentally. Therefore, RBC membrane permeability must increase during storage and we find that the permeability is likely to increase between 5 and 70 fold. Simulations using a two-dimensional blood vessel show that even a 5-fold increase in membrane permeability to NO can reduce NO bioavailability at the smooth muscle.
Background
Transfusion of older stored blood may be harmful.
Results
Older stored red blood cells scavenge nitric oxide more than fresher cells.
Conclusion
As stored red blood cells age, structural and biochemical changes occur that lead to faster scavenging.
Significance
Increased nitric oxide scavenging by red blood cells as a function of storage age contributes to deleterious effects upon transfusion.
Abbreviations: NO, nitric oxide; RBC, red blood cell; Hb, hemoglobin; MCHC, mean corpuscular hemoglobin concentration; MCV, mean corpuscular hemoglobin volume; PBS, phosphate buffered saline; MetHb, methemoglobin
Keywords: Nitric oxide, Erythrocyte, Blood, Kinetics, Electron paramagnetic resonance (EPR), Blood storage lesion
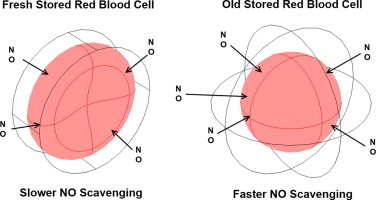
Graphical abstract
Highlights
-
•
Older stored red blood cells scavenge NO faster.
-
•
The biconcave geometry of fresh red cells favors faster NO scavenging.
-
•
A smaller RBC MCHC or MCV leads to increased NO scavenging.
-
•
RBC membrane permeability to NO needs to increase in order to explain our experimental results.
-
•
Even a 5-fold increase of RBC membrane permeability to NO can reduce NO bioavailability.
Introduction
Blood transfusion is one of the most common medical therapies, with about 14 million units of red blood cells (RBCs) having been transfused in the United States in 2011 [1]. The average age of red blood cells at transfusion is approximately 18 days. According to the blood banking standard, RBCs preserved in ADOSL can be stored up to 42 days. However, a growing body of literature has demonstrated an association between an increased incidence of adverse clinical outcomes of blood transfusion and the storage of RBCs [2], [3], [4], [5], [6], [7]. The adverse effect of blood transfusion is also suggested to be related to the number of units transfused [8], [9].
A number of chemical and morphological changes in RBCs occur during blood storage including a reduction in levels of 2, 3-diphosphoglycerate, ATP, and pH values, as well as an increase of potassium and lactate [10]. These changes result in a reduced deformability, increased osmotic fragility, spheroechinocyte formation, reduced integrity of the erythrocyte membrane with formation of microparticles, and increased cell-free hemoglobin (Hb) in plasma [11], [12], [13], [14], [15], [16], [17]. Numerous studies have found that the geometry of the red blood cell tends to become more spherical during storage thereby having a smaller surface area to volume ratio [10], [18], [19], [20]. The mean corpuscular hemoglobin concentration decreases, and the structure of RBC membrane changes significantly during storage [21], [22]. In addition, RBC volume varies during blood storage but the type of change depends on which additive preservation solutions is used [23], [24]. Changes in RBCs during storage are referred as blood storage lesion. Precise mechanisms that explain how the blood storage lesion is associated with adverse effects of blood transfusion remain unclear.
Nitric oxide functions as the endothelial derived relaxing factor, decreases platelet activation and vascular cell adhesion, influences oxidative and nitrosative stress, functions in host defense, and influences a large number of cellular functions through protein modification [25], [26], [27], [28], [29]. We hypothesize that the blood storage lesion is associated with a loss of NO signaling. It has been well established that oxygenated cell-free Hb reacts with NO at a high rate of 6–8×10⁷ M−1 s−1 to form nitrate and methemoglobin [30], [31], [32]. Microparticles are small phospholipid vesicles that contain hemoglobin and they react with NO only about 3 times slower than cell-free Hb, but still 1000 times faster than RBCs [33], [34], [35]. Several mechanisms are responsible for the reduced rate of NO scavenging by hemoglobin encapsulated in RBCs. NO diffusion to the RBC is limited by an unstirred layer around the RBC which is due to the fast scavenging of NO close to RBCs [36], [37], [38], [39]. A RBC cell-free zone is created when RBCs are pushed to the center of vessel during flow and it separates RBCs from endothelial cells where NO is produced [40], [41]. Another mechanism that accounts for slower NO scavenging by RBCs is that the RBC membrane has a finite permeability to NO, like a physical barrier which slows down the diffusion [38], [42]. These diffusion barriers are regulated by RBC size, shape, and surface area; biophysical properties that are changed during RBC storage [22]. Since hemoglobin and red cell microparticles scavenge NO close to 1000 times faster than red cell encapsulated hemoglobin, red cell breakdown in storage or post transfusion substantially reduces NO bioavailabiliy [34], [35]. In addition, recent studies show that the effects of storage will lead to an increased intrinsic NO scavenging by older stored RBCs, as measured by nitric oxide competition experiments and inhibition of aortic vasodilation [20], [43], [44]. However, the extent of the increase in NO scavenging by older red blood cells compared to fresh ones was not fully explored and the mechanism for this phenomenon was not satisfactorily provided.
In this study, we further examine the rate of NO scavenging by both fresh and old stored RBCs using time-resolved stopped-flow absorption spectroscopy and electron paramagnetic resonance spectroscopy. Computational simulations are also conducted to explore the effects of morphological changes, mean corpuscular hemoglobin concentration (MCHC), mean corpuscular volume (MCV), and permeability to NO on the rate of NO scavenging using 3D single RBC models. We use results of these simulations to account for the observed increase in NO scavenging by RBCs as a function of storage age.
Experimental procedures
Old and fresh, leukodepleted packed red blood cells were collected from packed red blood cell segments stored in the University of Alabama at Birmingham blood bank in AS-1 storage solution. The average storage length of old and fresh red blood cells in this study were 8.5±1.4 days and 37.5±2.9 days. Red blood cells were washed in phosphate buffered saline (PBS) at least three times or until the supernatants were clear. The hemoglobin concentration of the red blood cell solution (in heme) was determined by absorption spectroscopy using a Cary 100 spectrometer equipped with an integrating sphere detector. Spectra of cell-free hemoglobin were taken on a Cary 50 Bio spectrometer (Varian Inc.). Cell-free hemoglobin was prepared as described previously [45]. All experiments were performed in PBS buffer and all chemicals were purchased from Sigma unless otherwise stated.
Competition experiments
Experiments were performed similarly to those described previously [38], [46]. Briefly, oxygenated cell-free Hb and Hb encapsulated in RBCs compete to react with NO to form methemoglobin (MetHb). The relative rates of NO uptake by RBCs compared to cell-free Hb can be determined by examining the concentrations of MetHb produced from each fraction using electron paramagnetic resonance (EPR) spectroscopy. In the experiments, cell-free Hb (100 µM in heme) was mixed with either old or fresh stored red blood cell solutions (50% hematocrit). The mixtures were stirred with a magnetic bar at a slow speed to keep the sample homogeneous throughout the experiment. The NO donor DEANONOate was prepared in a deoxygenated 0.01 M NAOH solution and added to the mixture to a final concentration of 20 µM. The first EPR tube was filled with the mixture at 45 min and the rest of the mixture was centrifuged at 3000g for 2 min. The supernatant was put in another EPR tube and the third EPR tube was filled with the RBC pellet. Control experiments were performed as described previously to account for any autoxidation or MetHb reductase activity [46]. All the EPR tubes prepared in the experiment were frozen simultaneously at 1 h. The amounts of MetHb were measured by electron paramagnetic resonance using a Bruker EMX 10/12 spectrometer as described previously [45]. Hemolysis during the experiment was checked by examining the hemoglobin concentrations in the supernatant prior to the addition of NO donor and after the centrifugation.
The ratio of the bimolecular rate constant of NO reacting with cell-free Hb (kf) to the bimolecular rate constant of NO uptake by RBC-encapsulated Hb (kr) was determined by the relative amount of MetHb formed in each fraction as shown in the equation:
| (1) |
where the subscripts “f” and “r” stand for cell-free Hb and RBCs encapsulated Hb respectively. The concentrations indicated by brackets are the moles of the species over the total volume. Natural log terms on both sides of the equation were also calculated as previously described [47] in order to account for the fact that the total amount of oxygenated hemoglobin in the free and RBC fractions may decrease with time from its initial amount. The ratio kf/kr calculated using Eq. (1) had less than 2% difference from the result calculated with natural log terms. Three methods were used to calculate kf/kr using two MetHb concentrations of those in the mixture, supernatant, and RBC pellet in order to avoid errors as described previously [45].
Stopped-flow analysis
Stopped-flow time-resolved absorption experiments of the reaction between NO and RBCs were conducted using a Molecular Kinetics three-syringe mixer (Indianapolis, IN) coupled to an Olis RSM spectrometer (Bogart, GA) as described previously [47]. The NO donor PROLINONOate (10 mM, Cayman Chemicals) was prepared in 0.01 M NAOH and loaded in the first syringe. Either old or fresh stored red blood cells (100 µM in heme) were filled in the second syringe and the third syringe was loaded with deoxygenated PBS. Mixing was accomplished as follows: the NO donor was diluted to 500 µM by PBS and aged for 20 s in the first mixer so that the NO would be released. NO-containing buffer was then rapidly pushed into the second mixer and mixed with either old or fresh stored red blood cells. Experiments were conducted under aerobic conditions so that NO reacted with oxygenated Hb to make MetHb. As NO can also further react with MetHb to produce MetHb–NO, we only performed experiments with NO present at two-fold molar excess to oxygenated Hb. Time-resolved absorption spectra were collected and analyzed by Specfit software (Boston, MA) through singular value decomposition and global analysis as described previously [48].
Computational simulations
Three dimensional models were constructed to simulate competition and stopped-flow experiments performed in this study using COMSOL Multiphysics (Comsol Inc., Burlington, MA, version 4.3). We have assumed that RBCs are distributed homogenously within the reaction region. A single red blood cell was simulated as a 3D biconcave geometry contained in the reaction region of a cylindrical boundary for the reactions between fresh stored red blood cells and NO (Fig. 1A). A spherical geometry within another sphere was adopted to simulate the reactions between old stored red blood cells and NO (Fig. 1B). The comparison between NO scavenging by old and fresh stored red blood cells was conducted using those full 3D models.
Fig. 1.
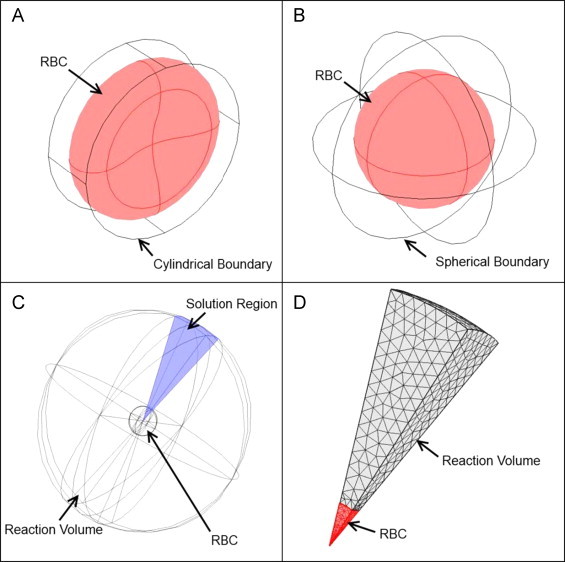
Three-dimensional models. (A) A full 3D model with a biconcave geometry contained in a cylindrical boundary for the reactions between fresh stored red blood cells and NO. (B) A full 3D model with a spherical geometry within another sphere for the reactions between old stored red blood cells and NO. (C) The 20×20 degree square cone as the solution region. (D) A finite element mesh of the cone solution region with a user defined finer mesh and twice the refinement in the intracellular domain (red).
In addition, to examine the effect of RBC MCHC, MCV, and membrane permeability on NO scavenging by old red blood cells, we performed simulations where each of these parameters was varied while maintaining the other parameters constant. In order to save time and sufficiently resolve both the reaction region and the RBC with enough finite elements we exploited the spherical symmetry of the old red blood cell model. The reaction was simulated solely over a 20×20 degree square cone cut out of the two sphere system, as previously described (Fig. 1C) [33]. This reduced the number of degrees of freedom and allowed a sufficient number of finite elements. All simulations were performed using a user defined finer mesh with twice the refinement in the intracellular domain unless otherwise stated (Fig. 1D).
Simulated competition experiments
Those competition experiments were simulated similarly to that described previously [49]. Briefly, NO is released by an NO donor and reacts with cell-free hemoglobin in the external space. In the extracellular space, the overall reaction rate for NO is given by
| (2) |
where R is the reaction rate, kdonor is the rate constant that NO is released by the donor, and kHb is the bimolecular rate constant of NO scavenging by oxygenated Hb. Concentrations are indicated by brackets.
In the intracellular compartment, NO diffused from extracellular space is scavenged by oxygenated Hb encapsulated by the RBC:
| (3) |
The boundary condition at the RBC membrane is defined as:
| (4) |
where n is the unit normal vector, D is NO diffusion rate, C is its concentration, Pm is NO permeability of RBC membrane, Co is NO concentration at the outer surface of the RBC, and Ci is the concentration in the RBC.
The models for competition experiments simulated the first 5 ms of the real experimental reaction. Parameters used in simulations are listed in Table 1. At 5 ms, the average concentrations of MetHb for both cell and plasma fractions were plugged into Eq. (1) to calculate the relative rate kf/kr.
Table 1.
Competition simulation parameters.
| Parameter | Value | Units |
|---|---|---|
| RBC volume | 90 | µm3 |
| Hematocrit | 50 | % |
| Initial [RBC Hb] | 20 | mM |
| Initial [NO donor] | 20 | µM |
| Initial [cell-free Hb] | 100 | µM |
| kHb | 8.9×10⁷ | M−1 s−1 |
| kdonor | 1 | s−1 |
| Extracellular NO diffusion coefficient | 3300 | µm2 s−1 |
| Intracellular NO diffusion coefficient | 880 | µm2 s−1 |
| Extracellular Hb diffusion coefficient | 1 | µm2 s−1 |
| Intracellular Hb diffusion coefficient | 0.27 | µm2 s−1 |
| RBC membrane permeability to NO | 5000 | µm s−1 |
Simulated stopped-flow experiments
Stopped-flow experiments were simulated similarly to the simulations for competition experiments as well as to those described previously [33]. The bimolecular reaction rate constant k was calculated at 5 ms after mixing using the formula,
| (5) |
where [Hb](t) and [Hb](0) are averaged hemoglobin concentrations at time t and in the beginning of the reaction. A constant concentration of NO was assumed in order to use pseudo first-order kinetics. Parameters used in simulations are summarized in Table 2.
Table 2.
Stopped-flow simulation parameters.
| Parameter | Value | Units |
|---|---|---|
| RBC volume | 90 | µm3 |
| Hematocrit | 0.5 | % |
| Initial [RBC Hb] | 20 | mM |
| Initial [NO] | 100 | µM |
| kHb | 8.9×10⁷ | M−1 s−1 |
| Extracellular NO diffusion coefficient | 3300 | µm2 s−1 |
| Intracellular NO diffusion coefficient | 880 | µm2 s−1 |
| Intracellular Hb diffusion coefficient | 0.27 | µm2 s−1 |
| RBC membrane permeability to NO | 5000 | µm s−1 |
Examined effects of RBC MCHC, MCV, and permeability
In order to further explore the effects of RBC MCHC, MCV and permeability on NO scavenging by older stored RBCs, a 20×20 degree square cone model was used and parameters were varied as described in Table 3. Other studies have shown that RBC MCHC and MCV change during blood storage and the type and extent of the changes depend on the additive preservation solution that is used to store the RBCs [21], [23], [24]. Therefore, in our simulations, RBC MCHC was varied from 14 to 22 mM and the volume of RBC was decreased from 90 to 60 µm3. These values overlap normal clinical reference ranges for RBC MCHC (19–22 mM) and MCV (80–99 µm3). In addition, it has been shown that significant changes in the RBC membrane occur during blood storage and storage leads to cytoskeletal damage [21], [50], [51]. Disruption of cytoskeleton results in increased NO scavenging associated with increased NO permeability [52]. Thus, the simulations were conducted examining effects on changes in NO membrane permeability starting with a base RBC membrane permeability (Pm=5000 µm s−1) and varying it by up to 100 fold (Pm×1–100) as shown in Table 3.
Table 3.
Parameters varied in simulations.
| Parameter | Value | Units |
|---|---|---|
| RBC MCHC | 14, 16, 18, 20, 22 | mM |
| RBC MCV | 90, 80, 70, 60 | µm3 |
| Tested range of permeability | Pm(1–100) |
Two-dimensional computational simulation
A two-dimensional model was used to examine the effect of an increased RBC membrane permeability to NO on nitric oxide availability within a blood vessel (Fig. 2). The computational model has been described previously [35], [53]. Briefly, the model includes the intracellular space of the RBCs with 45% hematocrit, the vessel lumen surrounding the RBCs, a cell-free zone within the lumen, an endothelial layer around the vessel wall, and the surrounding smooth muscle. It can simulate the production, diffusion, and consumption of NO within these areas. Steady state NO concentrations were computed as a function of position and the averaged NO concentrations at each fixed radius were plotted as a function of the distance to the vessel center. The parameters used are listed in Table 4.
Fig. 2.
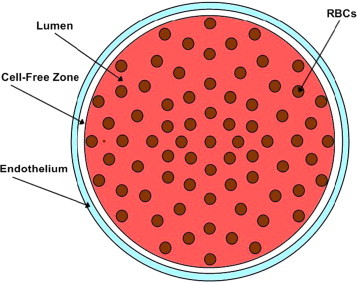
Illustration of the two-dimensional model of the vessel. RBCs are in the lumen of the blood vessel, which includes a cell-free zone. The smooth muscle is the outermost layer around the blood vessel. NO is produced in the endothelium and diffused into either the smooth muscle area or the lumen of the blood vessel. NO is consumed in different compartments as defined previously [53].
Table 4.
Parameters in the 2D simulations.
| Parameter | Value | Units |
|---|---|---|
| Initial [RBC Hb] | 20 | µM |
| Total NO production rate | 42.4 | µM s−1 |
| NO reaction rate constant in smooth muscle | 0.05 | µM−1 s−1 |
| kHb | 8.9×10⁷ | M−1 s−1 |
| Hematocrit | 45 | % |
| Extracellular NO diffusion coefficient | 3300 | µm2 s−1 |
| Intracellular NO diffusion coefficient | 880 | µm2 s−1 |
| RBC membrane permeability to NO | Pm(1,5,70) | |
| Blood vessel radius | 50 | µm |
| Cell-free zone thickness | 2.5 | µm |
| Endothelium thickness | 2.5 | µm |
| Radius of RBC | 3.39 | µm |
| RBC membrane thickness | 0.0078 | µm |
Statistical analysis
Analysis was performed with Microsoft Office Excel 2010 (Redland, OR). A student's t-test with two tails and equal variance was used to test for statistical significance. Results were considered significant when P<0.05. All values are presented as mean±SD.
Results
Competition experiments confirm old stored red blood cells scavenge NO faster
We conducted competition experiments to confirm the faster NO scavenging by old stored red cells using electron paramagnetic resonance spectroscopy. Fig. 3A shows representative EPR spectra taken of the mixture (MXT), the supernatant (SPT), and RBC pellet (RBC) after 1 h of incubating old or fresh stored red blood cells with DEANONOate. The EPR spectra are subtracted by the baseline spectra from control experiments and corrected to the total volume of the mixture so that the sum of MetHb in the RBC pellet and in the supernatant is equal to the total MetHb in the mixture. MetHb concentrations in the mixture are same for experiments using old (17.5±2.1 µM) and fresh (17.4±2.2 µM) RBCs. The averaged MetHb concentration of the supernatant is larger when fresh RBCs were used (9.6±1.4 µM) than the concentration of the supernatant when old RBCs were used (7.6±1.7 µM). In contrast, the average MetHb concentration of the fresh RBC pellet (7.6±2.0 µM) is smaller than that of the old RBC pellet (10.7±2.9 µM). Given that released cell-free Hb will scavenge NO at the same rate (whether it come from fresh or old RBCs), these data show that older RBCs scavenge NO faster than freshly stored ones.
Fig. 3.
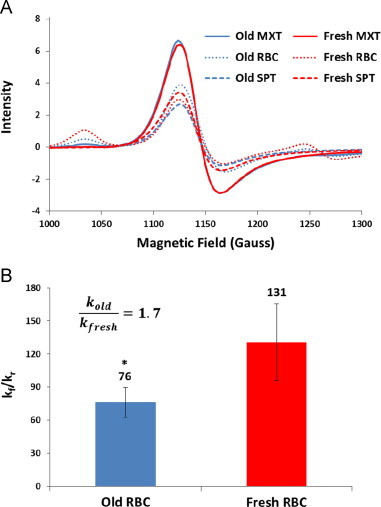
Competition measurements determining relative rates of NO reacting with old (blue) vs. fresh red cells (red). (A) EPR spectra taken of the mixture (MXT, solid), the supernatant (SPT, dashed), and RBC pellet (RBC, dotted) for old and fresh stored red blood cells. (B) The ratios of the bimolecular rate constant of NO reacting with cell-free Hb to the bimolecular rate constant of NO uptake by old and fresh stored RBC-encapsulated Hb are 76±13 and 131±35 respectively (n=6). The ratio of the bimolecular rate constant of NO uptake by old stored red blood cells (kold) to that of NO uptake by fresh stored red blood cells (kfresh) is about 1.7. ⁎P<0.005.
Fig. 3B shows that the average ratios of kf/kr for old and fresh red blood cells from multiple experiments are 76±13 and 131±35 respectively, similar in general magnitude to our previous measurements [39]. Thus, we were able to calculate the ratio of the bimolecular rate constant of NO uptake by old stored red blood cells (kold) to that of NO uptake by fresh stored red blood cells (kfresh) as about 1.7, which suggests that older stored red blood cell scavenges NO about 1.7 times faster than fresher ones.
Old stored red blood cells scavenge NO faster in stopped-flow experiments
To further compare the reaction rate of NO scavenging by old and fresh stored red blood cells, we performed stopped-flow experiments with NO and either old or fresh stored red blood cells. The experiments were conducted with a NO:Hb ratio of 2 under aerobic conditions. Fig. 4A shows representative kinetics of the absorption at 574 nm for both old (40 days) and fresh (7 days) stored red blood cells. It is apparent that old stored red blood cells scavenge NO faster than fresh ones. Fig. 4B shows that the bimolecular rate constants of NO reacting with old and fresh stored red blood cells calculated from stopped-flow experiments are (6.8±0.6)×104 M−1 s−1 and (3.8±0.1)×104 M−1 s−1 (n=4), which is consistent with our previous measurements [39]. Therefore, old stored red blood cells scavenge NO about 1.8 times faster than fresh ones in stopped-flow experiments.
Fig. 4.
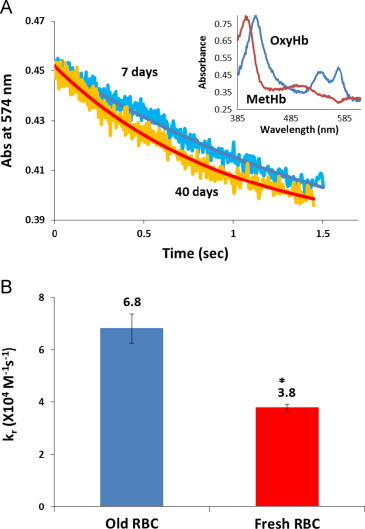
Stopped-flow absorption measurements of NO reactions with old and fresh red cells. (A) Kinetics of absorption at 574 nm for both old and fresh red blood cells scavenging NO. Both the raw data (noisy) and the fits from singular value decomposition and global analysis are shown. The initial species OxyHb and final species MetHb are shown in the inset. (B) Bimolecular rate constants of NO binding to old and fresh stored red blood cells are 6.8±0.6×10⁴ M−1 s−1 and 3.8±0.1×10⁴ M−1 s−1 (n=4). ⁎P<0.005.
Biconcave geometry is favored in NO scavenging
Competition and stopped-flow experiments were simulated when the RBC was represented by a biconcave geometry or a spherical geometry to explore the effect of the surface to volume ratio on NO scavenging. With the same volume, a biconcave geometry (predominating in fresh red cells) has a larger surface area than a spherical geometry (predominating in old red cells). As expected, results show that the RBC with a biconcave geometry scavenges more NO than the RBC with a spherical geometry for both competition (Fig. 5A) and stopped-flow experiments (Fig. 5B). In the simulations of competition experiments, the ratios kf/kr for old and fresh RBCs are 181 and 83 respectively. Thus, the simulations show that the biconcave geometry scavenges NO about 2.2 times faster than the spherical geometry. From simulations of stopped-flow experiments, we found that the biconcave geometry scavenges NO 1.4 times faster than the spherical geometry. These simulations show that the morphological changes that occur during RBC storage result in slower NO scavenging, contrary to what is observed experimentally. Thus other factors such as RBC MCHC, MCV, or NO permeability must play substantial roles in governing NO scavenging by stored RBCs.
Fig. 5.
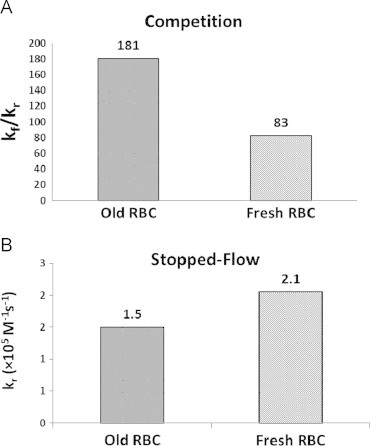
NO scavenging by old and fresh stored red blood cells due to geomotries examined using full 3D models. (A) The ratios of the bimolecular rate constant kf/kr calculated by simulating competition experiments. The ratios kf/kr are 181 and 83 for old (spherical) and fresh (biconcave) stored RBCs respectively. (B) Bimolecular rate constant kr calculated by simulating stopped-flow experiments. The values of kr are 1.5 and 2.1×10⁵ M−1 s−1 for old and fresh stored RBCs respectively.
Effects of RBC MCHC and MCV on NO scavenging
Other factors that account for an increased NO scavenging by older stored RBCs were examined by varying MCHC and MCV of the RBC using a 20×20 degree square cone model as shown in Table 3. For simulations of competition experiments, the ratio kf/kr is increased from 96 to 146 when RBC MCHC is increased from 14 to 22 mM (Fig. 6A). The ratio kf/kr is increased from 120 to 133 when MCV changes from 60 to 90 µm3 (Fig. 6B). In simulations of stopped-flow experiments, the bimolecular rate constant of NO scavenging by the RBC is decreased from 1.8 to 1.0×10⁵ M−1 s−1 and from 1.4 to 1.2×10⁵ M−1 s−1 when MCHC is increased from 14 to 22 mM (Fig. 6C) and MCV is increased from 60 to 90 µm3 respectively (Fig. 6D). Simulations of both competition experiments and stopped-flow experiments show that the RBC scavenges NO faster with a smaller MCHC or MCV, which is consistent with what we have found previously [33], [54].
Fig. 6.
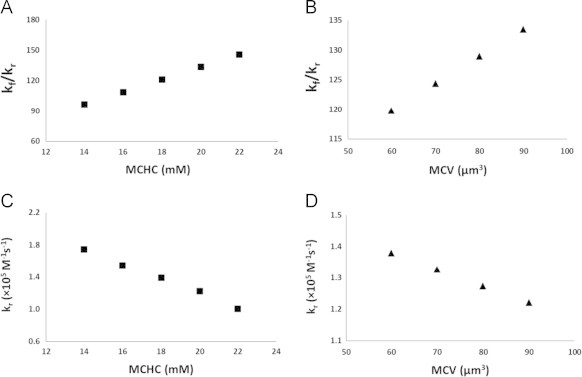
The effects of RBC MCHC and MCV on NO scavenging by RBCs studied using the 20×20 degree square cone model. The ratio of bimolecular rate constants kf/kr is calculated by simulating competition experiments and plotted as a function of MCHC (A) or MCV (B) of the RBC. Biomolecular rate costant kr is calcuated by simulating stopped-flow experiments and plotted as a function of MCHC (C) or MCV (D) of the RBC.
Membrane permeability plays a role in the increased NO scavenging by older stored RBCs
The effect of RBC membrane permeability on NO scavenging rates was investigated by simulating competition and stopped-flow experiments using the 20×20 degree square cone model. In the simulation, permeability was varied from Pm (5000 µm s−1) to 100 times this base value of Pm (5×105 µm s−1). Simulations of fresh RBCs used a volume of 90 µm3 and hemoglobin concentration of 20 mM while 60 µm3and 14 mM were used for old stored RBCs. Since a decreased MCHC or MCV leads to increased NO scavenging, a volume of 60 µm3 and a hemoglobin concentration of 14 mM should give us the minimum value of permeability that explains the experimentally observed increased NO scavenging by older stored RBCs. In addition, we used 90 µm3 and 20 mM to obtain an estimate of the maximum value of permeability needed to explain our experimental results. Although some reports show that MCV increased during storage in certain additive solutions [23], [24], we used a substantially lower value in simulations of older RBCs in order to maxmize effects of volume changes and thereby obtain the minimum necessary changes in permeability.
For competition experiments, experimental data show that old stored RBCs scavenge NO 1.7 times faster than fresh stored RBCs and simulations show that the old stored RBCs with a spherical geometry scavenge NO about 2.2 times slower than the fresh stored RBCs with a biconcave geometry. To explain the experimental data and compensate for the effect of geomerty, increased permeability would have to result in a 3.8 fold increased NO scavenging for old red cells compared to fresh ones. This magnitude increase corresponds to a kf/kr ratio of 35, which is 3.8 times smaller than the ratio kf/kr of 133 we obtained using the 20×20 degree square cone model with a volume of 90 µm3 and a hemoglobin concentration of 20 mM. The results show that the permeability needs to increase 5–30 fold in order to explain the increased NO scavenging by older stored RBCs we observed from competition experiments (Fig. 7A).
Fig. 7.
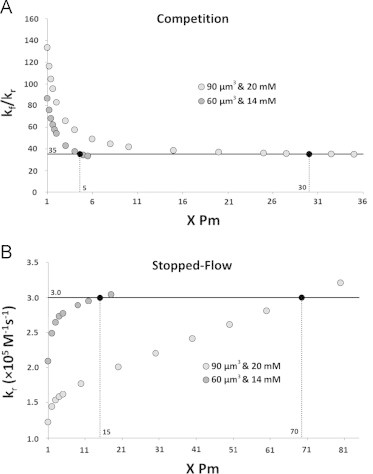
The effects of RBC membrane permeability to NO studied using the 20×20 degree square cone model with two extreme scenarios (volume: 90 µm3, hemoglobin concentration: 20 mM; volume: 60 µm3, hemoglobin concentration: 14 mM). The horizontal axis is the membrane permeability which is plotted in terms of a factor multiplied by the base value Pm=5000 µm s−1. (A) The ratio kf/kr is plotted as a function of RBC permeability varied in simulations of competition experiments. The goal ratio kf/kr of 35 appears as a horizontal black line. The simulated ratios that are the same as the goal ratio are shown as black circles and the corresponding membrane permeabilities are indicated on the x-axis above. (B) The bimolecular rate constant kr was calculated from simulations of stopped-flow experiments with varied permeabilities. The goal kr of 3.0×10⁵ M−1 s−1 appears as a horizontal black line. The simulated values of kr that are the same as the goal are shown as black circles and the corresponding membrane permeabilities are indicated on the x-axis above.
We observed that old stored RBCs scavenge NO 1.8 times faster than fresh stored RBCs in stopped-flow experiments and the spherical geometry scavenges NO 1.4 times slower than the biconcave geometry in simulations of stopped-flow experiments. In order to explain the experimental data and compenstate for the effect of geometry, the effect of permeability would have to result in a 2.5-fold increase in the bimolecular rate constant. This increase corresponds to a bimolecular rate constant of 3.0×10⁵ M−1 s−1 which is 2.5 times larger than the bimolecular rate constant of 1.2×10⁵ M−1 s−1 we obtained from simulations using the 20×20 degree square cone model with a volume of 90 µm3 and a hemoglobin concentration of 20 mM. The results show that an increase of 15–70 fold in the permeability is needed to explain the increased NO scavenging by older stored RBCs we observed from stopped-flow experiments (Fig. 7B).
Even five fold increase of membrane permeability to NO can significantly reduce NO bioavailability
Simulations were conducted using the two-dimensional computational model (Fig. 2) when RBCs membrane permeability to NO was varied. Fig. 8A shows NO concentrations plotted as a function of the distance to the vessel center. The NO concentration is almost zero in the lumen but increases rapidly at endothelium. As the distance to the vessel center increases, the NO concentration decreases. We conducted simulations using Pm (5000 µm s−1)×1, 5, and 70 to represent the potential increases in permeability due to blood storage we suggested in this study. In Fig. 8A, we find that as the membrane permeability to NO increases, the NO concentration decreases which is consistent with our previous results [53]. NO concentrations at 54.9 µm (in or near the smooth muscle layer) for different red cell membrane permeabilities to NO are plotted in Fig. 8B. NO concentration is reduced 8% and 10% from the base concentration when Pm was increased 5 and 70 fold, respectively.
Fig. 8.
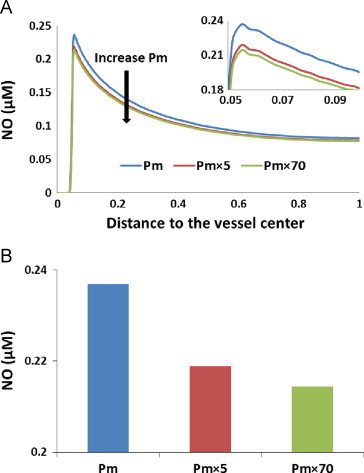
Effect of RBC membrane permeability on NO concentration. (A) NO concentrations for Pm, Pm×5, and Pm×70 are plotted versus the distance to the vessel center. The direction of Pm increasing is indicated by the black arrow. The peaks of the curves are magnified in the inset. (B) NO concentrations at 54.9 µm (in or near the smooth muscle layer) with different permeabilities are plotted. NO concentrations at 54.9 µm are 0.237 µM, 0.219 µM, and 0.214 µM when membrane permeabilities are Pm, Pm×5, and Pm×70, respectively.
Discussion
In this study, we performed experiments using EPR and stopped-flow instruments to further examine the increased NO scavenging by older stored RBCs. We found that older stored RBCs react with NO 1.7–1.8 times faster than fresh stored RBCs. This is consistent with recent published data showing that there is a two-fold difference between the rates of old and fresh stored RBCs scavenging NO [43].
During storage, the geometry of the red blood cell tends to become more spherical, MCHC decreases, MCV varies, and the structure of RBC membrane changes significantly [21], [22]. We explored the effects of these changes on NO scavenging to see if they could account for increased NO scavenging by older stored RBCs.
A spherical geometry has less surface area than a biconcave geometry and a larger surface area is expected to increase the rate of NO scavenging. As expected, the simulations using full 3D models demonstrate that the old stored RBC with a spherical geometry scavenges NO about 1.7 to 2.2 times slower than the fresh stored RBC with a biconcave geometry. Thus, other factors must exist to compensate for the effects of geometry and increase NO scavenging by older RBCs as observed experimentally.
We further examined the effects of RBC MCHC and MCV, on NO scavenging by RBCs using the 20×20 degree square cone model. In the simulations that varied RBC MCHC, we found that a decreased MCHC leads to an increased NO scavenging by the RBC with a hemoglobin concentration of 14 mM resulting in a 1.4 times faster rate compared to a hemoglobin concentration of 20 mM. Although the MCHC of stored RBCs does not decrease to as low as 14 mM, we simulated this extreme value to explore the limits of MCHC effects. Similarly, we found that a smaller MCV leads to faster NO scavenging by RBCs. The RBC with a volume of 60 um3 reacts with NO about 1.1 times faster than the RBC with a volume of 90 µm3.
Another factor we studied was RBC membrane permeability to NO. In these simulations, we used the 20×20 degree square cone model to examine two extreme scenarios with a range of permeability: (1) a RBC with a volume of 90 μm3 and a hemoglobin concentration of 20 mM and (2) a RBC with a volume of 60 μm3 and a hemoglobin concentration of 14 mM. The first scenario represents normal fresh stored RBCs and the second scenario represents the worst case of old stored RBCs. According to our simulations, even the most extreme possible changes in MCHC and MCV that favor increased NO scavenging are insufficient to account for what is observed experimentally. Therefore, RBC membrane permeability must increase during storage. We find that the permeability is likely to increase between 5 and 70 fold. Our previous computational simulations of competition experiments at different oxygen saturations using similar parameters show that the RBC membrane permeability to NO needs to increase 20–40 fold in order to achieve an increase of 3–4 fold in the ratio kf/kr [55]. Thus, our current result focused on blood storage effects is consistent with our previous one comparing oxygenated and deoxygenated cells.
The effect of increased membrane permeability to NO on NO bioavailability was elucidated using a two-dimensional blood vessel model. Our simulations show that NO concentrations are decreased as the permeability increases. Even a 5-fold increase in membrane permeability to NO can reduce NO bioavailability significantly. Nitric oxide acts as an important signaling molecule in vivo that regulates blood flow, decreases adhesion molecule expression and platelet activation. Stored RBCs break down during blood storage which results in release of cell-free hemoglobin from RBCs, microparticle formation, and intrinsic erythrocyte changes. The role of cell-free hemoglobin release in the blood storage lesion in terms of NO scavenging, inflammation and other effects has been previously elucidated [34], [56]. The extent and mechanisms of cell-free hemoglobin and microparticles scavenging NO have been well established [33], [34]. Both cell-free hemoglobin and microparticles react with NO very fast, about 1000 times faster than RBCs and enter the cell-free zone where RBCs are absent due to flow pressure gradient [35]. Although the rate of NO scavenging by RBCs is less than cell-free hemoglobin and microparticles, the concentration of erythrocytic Hb is much greater than cell-free Hb (~12 mM RBC-Hb vs. ~80 µM cell-free Hb under some conditions). Stored RBCs contribute to NO scavenging when chemical and morphological changes in RBCs occur during blood storage, especially when RBC membrane permeability to NO increases 5–70 fold as we suggest in this work. This increase in permeability can be explained in terms of damage to the red cell cytoskeleton during blood storage [50], [51]. Previous work has shown that chemical or mechanical alteration of the red cell cytoskeleton results in increased red cell NO scavenging attributed to increased permeability to NO [52]. A recent publication argues that the changes in intrinsic RBC NO scavenging ability that occur during blood storage are more important in reducing NO bioavailability upon transfusion than effects from cell-free hemoglobin and microparticles [44]. Based on our previous work [34], [53], [57], we think it is more likely that cell-free Hb and microparticles play a larger role. However, more work will need to be conducted to examine the relative roles of older red cells and cell-free hemoglobin in limiting NO bioavailability upon transfusion. We hypothesize that the combination of red cell breakdown associated hemolysis and microparticle formation together with increased intrinsic RBC NO scavenging can lead to an “NO shock” upon transfusion of substantial amounts of older stored blood. This “NO shock” can lead to reduced oxygen delivery in the microcirculation increased platelet activation and inflammation, and other deleterious effects that contribute to pathological consequences of the storage lesion.
Acknowledgments
This work was supported by NIH Grants HL098032 (D.K.-S. and M.T.G.) and HL095468 (R.P.), and the Graduate Fellowship from the Center for Molecular Communication and Signaling at Wake Forest University. R.S. is supported by Cardiovascular T32 Pre-doctoral Training Grant.
Footnotes
This is an open-access article distributed under the terms of the Creative Commons Attribution-NonCommercial-ShareAlike License, which permits non-commercial use, distribution, and reproduction in any medium, provided the original author and source are credited.
References
- 1.The 2007 National Blood Collection and Utilization Survey Report. Washington, DC: US Department of Health and Human Services; 2009.
- 2.Koch C.G., Li L., Sessler D.I., Figueroa P., Hoeltge G.A., Mihaljevic T., Blackstone E.H. N. Engl. J. Med. 2008;358:1229–1239. doi: 10.1056/NEJMoa070403. [DOI] [PubMed] [Google Scholar]
- 3.de Watering L.V., Lorinser J., Versteegh M., Westendord R., Brand A. Transfusion. 2006;46:1712–1718. doi: 10.1111/j.1537-2995.2006.00958.x. [DOI] [PubMed] [Google Scholar]
- 4.Vandromme M.J., McGwin G., Jr., Marques M.B., Kerby J.D., Rue L.W., 3rd, Weinberg J.A. J Trauma. 2009;67:97–101. doi: 10.1097/TA.0b013e3181a5a8f9. [DOI] [PubMed] [Google Scholar]
- 5.Weinberg J.A., McGwin G., Jr., Marques M.B., Cherry S.A., 3rd., Reiff D.A., Kerby J.D., Rue L.W., 3rd J. Trauma. 2008;65:794–798. doi: 10.1097/TA.0b013e318184aa11. [DOI] [PubMed] [Google Scholar]
- 6.Leal-Noval S.R., Rincon-Ferrari M.D., Garcia-Curiel A., Herruzo-Aviles A., Camacho-Larana P., Garnacho-Montero J., Amaya-Villar R. Chest. 2001;119:1461–1468. doi: 10.1378/chest.119.5.1461. [DOI] [PubMed] [Google Scholar]
- 7.Zallen G., Offner P.J., Moore E.E., Blackwell J., Ciesla D.J., Gabriel J., Denny C., Silliman C.C. Am. J. Surg. 1999;178:570–572. doi: 10.1016/s0002-9610(99)00239-1. [DOI] [PubMed] [Google Scholar]
- 8.Edgren G., Kamper-Jorgensen M., Eloranta S., Rostgaard K., Custer B., Ullum H., Murphy E.L., Busch M.P., Reilly M., Melbye M., Hjalgrim H., Nyren O. Transfusion. 2010;50:1185–1195. doi: 10.1111/j.1537-2995.2010.02583.x. [DOI] [PMC free article] [PubMed] [Google Scholar]
- 9.Triulzi D.J., Yazer M.H. Transfus. Apher. Sci. 2010;43:95–106. doi: 10.1016/j.transci.2010.05.013. [DOI] [PubMed] [Google Scholar]
- 10.van de Watering L. Vox Sang. 2011;100:36–45. doi: 10.1111/j.1423-0410.2010.01441.x. [DOI] [PubMed] [Google Scholar]
- 11.Dumaswala U.J., Dumaswala R.U., Levin D.S., Greenwalt T.J. Blood. 1996;87:1612–1616. [PubMed] [Google Scholar]
- 12.Tinmouth A., Chin-Yee I. Transfus. Med. Rev. 2001;15:91–107. doi: 10.1053/tmrv.2001.22613. [DOI] [PubMed] [Google Scholar]
- 13.Tinmouth A., Fergusson D., Yee I.C., Hebert P.C. Transfusion. 2006;46:2014–2027. doi: 10.1111/j.1537-2995.2006.01026.x. [DOI] [PubMed] [Google Scholar]
- 14.Greenwalt T.J., Bryan D.J., Dumaswala U.J. Vox Sang. 1984;47:261–270. doi: 10.1111/j.1423-0410.1984.tb01596.x. [DOI] [PubMed] [Google Scholar]
- 15.Latham J.T., Bove J.R., Weirich F.L. Transfusion. 1982;22:158–159. doi: 10.1046/j.1537-2995.1982.22282177126.x. [DOI] [PubMed] [Google Scholar]
- 16.Aubuchon J.P., Estep T.N., Davey R.J. Blood. 1988;71:448–452. [PubMed] [Google Scholar]
- 17.Salzer U., Zhu R., Luten M., Isobe H., Pastushenko V., Perkmann T., Hinterdorfer P., Bosman G. Transfusion. 2008;48:451–462. doi: 10.1111/j.1537-2995.2007.01549.x. [DOI] [PubMed] [Google Scholar]
- 18.Nakao M., Nakao T., Yamazoe S. Nature. 1960;187:945–946. doi: 10.1038/187945a0. [DOI] [PubMed] [Google Scholar]
- 19.Raval J.S., Waters J.H., Seltsam A., Scharberg E.A., Richter E., Kameneva M.V., Yazer M.H. Vox Sang. 2011;100:418–421. doi: 10.1111/j.1423-0410.2010.01439.x. [DOI] [PubMed] [Google Scholar]
- 20.Stapley R., Owusu B.Y., Brandon A., Cusick M., Rodriguez C., Marques M.B., Kerby J.D., Barnum S.R., Weinberg J.A., Lancaster J.R., Jr., Patel R.P. Biochem. J. 2012;446:499–508. doi: 10.1042/BJ20120675. [DOI] [PMC free article] [PubMed] [Google Scholar]
- 21.Almizraq R., Tchir J.D., Holovati J.L., Acker J.P. Transfusion. 2013;53:2258–2267. doi: 10.1111/trf.12080. [DOI] [PubMed] [Google Scholar]
- 22.Liu X., Miller M.J., Joshi M.S., Sadowska-Krowicka H., Clark D.A., Lancaster J.R., Jr. J. Biol. Chem. 1998;273:18709–18713. doi: 10.1074/jbc.273.30.18709. [DOI] [PubMed] [Google Scholar]
- 23.Arduini A., Minetti G., Ciana A., Seppi C., Brovelli A., Profumo A., Vercellati C., Zappa M., Zanella A., Dottori S., Bonomini M. Am. J. Hematol. 2007;82:31–40. doi: 10.1002/ajh.20753. [DOI] [PubMed] [Google Scholar]
- 24.Veale M.F., Healey G., Sparrow R.L. Transfusion. 2011;51:25s–33s. doi: 10.1111/j.1537-2995.2010.02960.x. [DOI] [PubMed] [Google Scholar]
- 25.Furchgott R.F., Zawadzki J.V. Nature. 1980;288:373–376. doi: 10.1038/288373a0. [DOI] [PubMed] [Google Scholar]
- 26.Ignarro L.J., Byrns R.E., Buga G.M., Wood K.S. Circ. Res. 1987;61:866–879. doi: 10.1161/01.res.61.6.866. [DOI] [PubMed] [Google Scholar]
- 27.Katsuki S., Arnold W., Mittal C., Murad F. J. Cycl. Nucleotide Res. 1977;3:23–35. [PubMed] [Google Scholar]
- 28.Palmer R.M.J., Ferrige A.G., Moncada S. Nature. 1987;327:524–526. doi: 10.1038/327524a0. [DOI] [PubMed] [Google Scholar]
- 29.Ignarro L.J. Academic press; San Diego: 2000. Nitric Oxide Biology and Pathobiology. [Google Scholar]
- 30.Doyle M.P., Hoekstra J.W. J. Inorg. Biochem. 1981;14:351–358. doi: 10.1016/s0162-0134(00)80291-3. [DOI] [PubMed] [Google Scholar]
- 31.Eich R.F., Li T.S., Lemon D.D., Doherty D.H., Curry S.R., Aitken J.F., Mathews A.J., Johnson K.A., Smith R.D., Phillips G.N., Olson J.S. Biochemistry. 1996;35:6976–6983. doi: 10.1021/bi960442g. [DOI] [PubMed] [Google Scholar]
- 32.Herold S., Exner M., Nauser T. Biochemistry. 2001;40:3385–3395. doi: 10.1021/bi002407m. [DOI] [PubMed] [Google Scholar]
- 33.Azarov I., Liu C., Reynolds H., Tsekouras Z., Lee J.S., Gladwin M.T., Kim-Shapiro D.B. J. Biol. Chem. 2011;286:33567–33579. doi: 10.1074/jbc.M111.228650. [DOI] [PMC free article] [PubMed] [Google Scholar]
- 34.Donadee C., Raat N.J.H., Kanias T., Tejero J., Lee J.S., Kelley E.E., Zhao X.J., Liu C., Reynolds H., Azarov I., Frizzell S., Meyer E.M., Donnenberg A.D., Qu L.R., Triulzi D., Kim-Shapiro D.B., Gladwin M.T. Circulation. 2011;124:465–476. doi: 10.1161/CIRCULATIONAHA.110.008698. [DOI] [PMC free article] [PubMed] [Google Scholar]
- 35.Liu C., Zhao W., Christ G.J., Gladwin M.T., Kim-Shapiro D.B. Free Radic. Biol. Med. 2013;65C:1164–1173. doi: 10.1016/j.freeradbiomed.2013.09.002. [DOI] [PMC free article] [PubMed] [Google Scholar]
- 36.Coin J.T., Olson J.S. J. Biol. Chem. 1979;254:1178–1190. [PubMed] [Google Scholar]
- 37.Liu X.P., Miller M.J.S., Joshi M.S., Sadowska-Krowicka H., Clark D.A., Lancaster J.R. J. Biol. Chem. 1998;273:18709–18713. doi: 10.1074/jbc.273.30.18709. [DOI] [PubMed] [Google Scholar]
- 38.Vaughn M.W., Huang K.T., Kuo L., Liao J.C. J. Biol. Chem. 2000;275:2342–2348. doi: 10.1074/jbc.275.4.2342. [DOI] [PubMed] [Google Scholar]
- 39.Azarov I., Huang K.T., Basu S., Gladwin M.T., Hogg N., Kim-Shapiro D.B. J. Biol. Chem. 2005;280:39024–39032. doi: 10.1074/jbc.M509045200. [DOI] [PubMed] [Google Scholar]
- 40.Butler A.R., Megson I.L., Wright P.G. Biochim. Biophys. Acta Gen. Subj. 1998;1425:168–176. doi: 10.1016/s0304-4165(98)00065-8. [DOI] [PubMed] [Google Scholar]
- 41.Liao J.C., Hein T.W., Vaughn M.W., Huang K.T., Kuo L. Proc. Natl. Acad. Sci. USA. 1999;96:8757–8761. doi: 10.1073/pnas.96.15.8757. [DOI] [PMC free article] [PubMed] [Google Scholar]
- 42.Vaughn M.W., Huang K.T., Kuo L., Liao J.C. Nitric Oxide Biol. Chem. 2001;5:18–31. doi: 10.1006/niox.2000.0328. [DOI] [PubMed] [Google Scholar]
- 43.Owusu B.Y., Stapley R., Honavar J., Patel R.P. Antioxid. Redox Signal. 2013;19:1198–1208. doi: 10.1089/ars.2012.4884. [DOI] [PMC free article] [PubMed] [Google Scholar]
- 44.Alexander J.T., El-Ali A.M., Newman J.L., Karatela S., Predmore B.L., Lefer D.J., Sutliff R.L., Roback J.D. Transfusion. 2013;53:2619–2628. doi: 10.1111/trf.12111. [DOI] [PMC free article] [PubMed] [Google Scholar]
- 45.Huang Z., Louderback J.G., Goyal M., Azizi F., King S.B., Kim-Shapiro D.B. Biochim. Biophys. Acta. 2001;1568:252–260. doi: 10.1016/s0304-4165(01)00227-6. [DOI] [PubMed] [Google Scholar]
- 46.Kim-Shapiro D.B. Free Radic. Biol. Med. 2004;36:402–412. doi: 10.1016/j.freeradbiomed.2003.10.030. [DOI] [PubMed] [Google Scholar]
- 47.Geisser M.E., Wang W.F., Smuck M., Koch L.G., Britton S.L., Lydic R. Neurosci. Lett. 2008;443:37–40. doi: 10.1016/j.neulet.2008.07.040. [DOI] [PMC free article] [PubMed] [Google Scholar]
- 48.Koch L.G., Britton S.L. Obesity. 2008;16:S28–S32. doi: 10.1038/oby.2008.513. [DOI] [PMC free article] [PubMed] [Google Scholar]
- 49.Huang K.T., Huang Z., Kim-Shapiro D.B. Nitric Oxide. 2007;16:209–216. doi: 10.1016/j.niox.2006.11.002. [DOI] [PMC free article] [PubMed] [Google Scholar]
- 50.Wolfe L.C., Byrne A.M., Lux S.E. J. Clin. Investig. 1986;78:1681–1686. doi: 10.1172/JCI112762. [DOI] [PMC free article] [PubMed] [Google Scholar]
- 51.Berezina T.L., Zaets S.B., Morgan C., Spillert C.R., Kamiyama M., Spolarics Z., Deitch E.A., Machiedo G.W. J. Surg. Res. 2002;102:6–12. doi: 10.1006/jsre.2001.6306. [DOI] [PubMed] [Google Scholar]
- 52.Han T.H., Liao J.C. Biochim. Biophys. Acta Gen. Subj. 2005;1723:135–142. doi: 10.1016/j.bbagen.2005.01.013. [DOI] [PubMed] [Google Scholar]
- 53.Jeffers A., Gladwin M.T., Kim-Shapiro D.B. Free Radic. Biol. Med. 2006;41:1557–1565. doi: 10.1016/j.freeradbiomed.2006.08.017. [DOI] [PMC free article] [PubMed] [Google Scholar]
- 54.Sakai H., Sato A., Masuda K., Takeoka S., Tsuchida E. J. Biol. Chem. 2008;283:1508–1517. doi: 10.1074/jbc.M707660200. [DOI] [PubMed] [Google Scholar]
- 55.Huang K.T., Huang Z., Kim-Shapiro D.B. Nitric Oxide. 2007;16:209–216. doi: 10.1016/j.niox.2006.11.002. [DOI] [PMC free article] [PubMed] [Google Scholar]
- 56.Baek J.H., D'Agnillo F., Vallelian F., Pereira C.P., Williams M.C., Jia Y., Schaer D.J., Buehler P.W. J. Clin. Investig. 2012;122:1444–1458. doi: 10.1172/JCI59770. [DOI] [PMC free article] [PubMed] [Google Scholar]
- 57.Liu C., Zhao W., Christ G.J., Gladwin M.T., Kim-Shapiro D.B. Free Radic. Biol. Med. 2013;65:1164–1173. doi: 10.1016/j.freeradbiomed.2013.09.002. [DOI] [PMC free article] [PubMed] [Google Scholar]