

Abstract
Purpose
A novel molecular imaging agent has been developed recently which stains tissues of low extracellular pH (pH (low) insertion peptide, pHLIP®). A pH-dependent process of peptide folding and insertion into cell membranes has been found in vitro. Targeting of acidic solid tumours has been demonstrated in vivo using fluorescence and PET labels. Here we present proof of feasibility studies of pHLIP with a SPECT label, 99mTc-AH114567, with focus on preclinical efficacy and imageability.
Procedures
LLC, LNCaP and PC-3 tumour xenografts were grown in mice and characterised by the angiogenesis marker 99mTc-NC100692 and by extracellular pH measurements with 31P-MRS of 3-aminopropyl phosphonate. Biodistribution was assessed and CT/SPECT imaging performed. Oral administration of bicarbonate served as control.
Results and Conclusion
99mTc-AH114567 can be obtained via a robust synthesis with good radiolabelling profile and improved formulation. The tracer retains the pH-dependent ability to insert into membranes and to target tumours with similar pharmacokinetics and efficacy that had been demonstrated earlier for pHLIP with optical or 64Cu PET labels. Despite the inherent challenges of SPECT compared to optical and PET imaging e.g. in terms of lower sensitivity, 99mTc-AH114567 shows adequate image quality and contrast. The main development need for transitioning SPECT labelled pHLIP into the clinic is more rapid background signal reduction which will be the focus of a subsequent optimization study.
Keywords: Molecular Imaging, pHLIP, Tc-99m, SPECT, extracellular pH, AH114567, 3-APP, maraciclatide, preclinical
INTRODUCTION
Pathological conditions such as cancer, ischemic stroke and inflammation are associated with increased metabolic activity, hypoxia and other factors resulting in an acidified extracellular microenvironment. [1] Acidosis is considered a cancer hallmark [2]. In solid tumours, the commonly low extracellular pH (pHe) is caused primarily by poor/irregular perfusion and increased lactic acid secretion even in the presence of oxygen due to a shift towards aerobic glycolysis (Warburg effect [3]), but also e.g. by increased pCO2 [4]. Moreover, extracellular acidity is suggested to correlate with metastatic potential [5–7]. This makes assessing and monitoring tumour pHe an interesting alternative diagnostic approach compared to cancer cell receptor targeting with the potential of improving therapy [8,9]. Recently, pHLIP (pH (low) insertion peptide) has been shown to target tissues of low pH [10–12]. This peptide has been derived from the bacteriorhodopsin C-helix [13]. Three states have been identified for pHLIP: free/monomeric and unstructured in aqueous solution at neutral/basic pH (state I); unstructured and bound to a lipid bilayer surface at neutral/basic pH (state II); with α-helical structure and inserted across a lipid bilayer at acidic conditions as in figure 1 (state III) [12]. State I is present at physiological pH and <7 µmol/L. Presence of liposomes in vitro leads to a dynamic equilibrium with binding to the bilayer. Lowering the pH below 7 causes protonation of carboxyl groups increasing peptide hydrophobicity and affinity to the membrane. This promotes the unidirectional, fast (on the order of seconds) and reversible insertion into the membrane with the C-terminus pushed through and the N-terminus staying outside [10]. This process is accompanied by formation of secondary structure.
FIGURE 1.
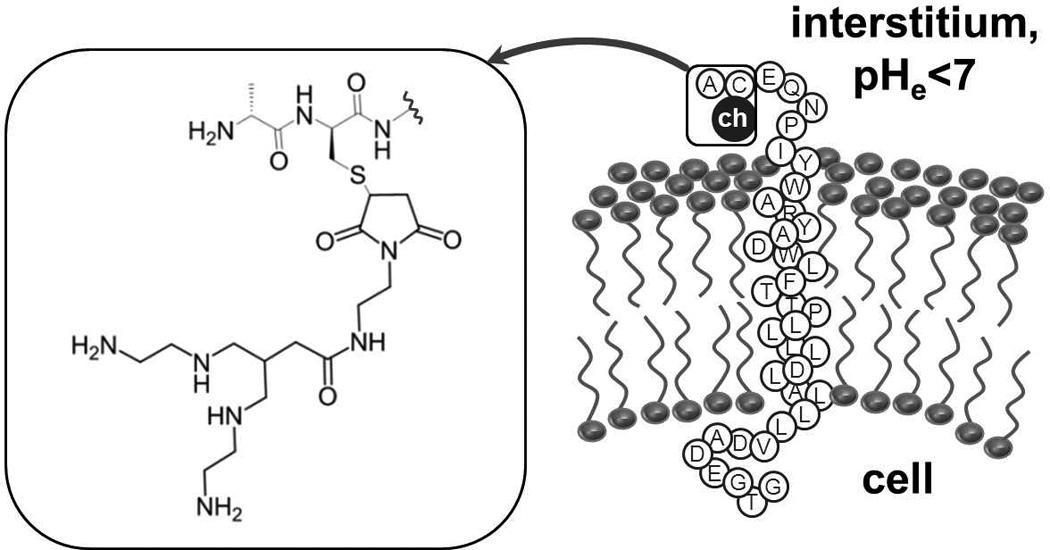
AH114567 is the 37-amino acid pHLIP sequence with a tetraamine chelator (“ch”) coupled to the cysteine sidechain near the N-terminus, see inset. At low extracellular pH, the peptide inserts into the cell membrane with the C-terminus pushed into the cytoplasm, the central part of pHLIP forming an α-helix residing in the membrane, and the N-terminus remaining in the interstitium.
Previously, optical labels [10–12] and a 64Cu-DOTA PET label [8] (DOTA=1,4,7,10-tetraazacyclododecane-1,4,7,10-tetraacetic acid, PET=Positron Emission Tomography) had been conjugated to the N-terminus of pHLIP to study the agents potential for use in molecular imaging. Two areas of improvement have been identified and are addressed in this paper: transition to SPECT (Single-Photon Emission Computed Tomography), and improving the formulation (further detailed below). In subsequent optimization and proof-of-concept studies we aim at addressing two more aspects: improving the pharmacokinetics in order to allow a clinically acceptable imaging time window, and (2) supporting further the proof-of-concept through improved experimental designs.
The current study primarily explores feasibility of SPECT imaging with pHLIP. Previous studies were based on optical imaging for convenient and low-cost preclinical evaluation and on PET imaging with the potential to transfer to the clinic. Employing a SPECT nuclide like 99mTc takes advantage of the much wider availability of SPECT scanners in clinics compared to PET. However, the intrinsically lower sensitivity of SPECT needs to be addressed in the imaging agent development. This study reports the proof-of-feasibility study of a 99mTc-labelled pHLIP comprising synthesis, improved formulation, characterization in vitro, stability studies in vivo, biodistribution in 3 tumour xenograft models (normal and with pHe modulation), and preclinical SPECT imaging. PC-3 (prostate adenocarcinoma) and LNCaP (Lymph Node Carcinoma of the Prostate) tumours were chosen based on the reported extracellular pH in those tumours and for comparison with the preceding 64Cu-DOTA-pHLIP work [8]. This was extended by LLC (Lewis Lung Carcinoma) tumours which are a well-established model in-house. All tumour models have been assessed for vascularity via the in vivo angiogenesis marker 99mTc-NC100692 (maraciclatide) and for pHe via in vivo 31P magnetic resonance spectroscopy (MRS) with 3-aminopropyl phosphonate (3-APP).
MATERIALS AND METHODS
Peptide chemistry and radiochemistry
The following 37-residue pHLIP variant [11] has been synthesized from D-amino acids: ACEQNPIY{WARYADWLFTTPLLLLDLALLV}DADEGTG (approximate membrane inserting part in curly brackets [9], see figure 1), by solid-phase peptide chemistry employing a microwave assisted peptide synthesizer (CEM Liberty) and NovaSyn TGT resin. Yield was satisfactory at 22% overall, and purity was >95% as estimated by LC-MS analysis. Next, a tetraamine chelator [14] was conjugated to the cysteine side-chain at position 2 yielding precursor AH114567, see figure 1. This chelator allows for rapid 99mTc-labelling at room temperature with a one-step kit, here comprising the reducing agent SnCl2 with methylene diphosphonic acid, the radiostabilizer sodium para-aminobenzoate and carbonate buffer. [99mTc]pertechnetate from a DRYTEC™ generator (GE Healthcare) was added. The radioactive product 99mTc-AH114567 contains trans-TcO2+1 coordinated to the 4 chelator amino groups. Purification from excess pertechnetate was done by preparative high-performance liquid chromatography (HPLC; Thames Restek Viva C4 column, 100 mm·4.6 mm, 5 µm, 300 Å; mobile phase given in the in vivo stability section below). Retention of the labelled product on the HPLC column and adhesion to silanized glass vials was identified as main reason for initially low yields. These preparations were nevertheless used for the first biology experiments (“formulation 1”). Higher yields were obtained by adding more precursor to the product fraction (“formulation 2”) giving a final concentration c(AH114567)≈25 nmol/mL in phosphate buffered saline with ≈10% (v/v) ethanol. For experiments involving a scintillation counter, the radioactivity concentration (RAC) was adjusted to ≈50 MBq/mL corresponding to c(99mTc-AH114567)≈2.6 pmol/mL. For imaging experiments, a larger RAC of 300 to 500 MBq/mL was prepared to compensate for subsequent physical decay during transport to the imaging lab (2 to 3 h) and to alleviate the loss of sensitivity with a gamma camera compared to scintillation counters (additional compensation is through a longer acquisition time and a larger injected volume of radioactive formulation). Thin layer chromatography with saline as mobile phase was used to analyse preparations within minutes after preparation and 2 to 4 h later. These showed typically ≤2% [99mTc]pertechnetate, see Electronic Supplementary Material.
Circular Dichroism measurements
Samples were prepared with c(peptide)=7 µmol/L and c(POPC liposomes)=2 mmol/L (POPC=1-palmitoyl-2-oleoyl-sn-glycero-3-phosphocholine; diameter≤50 nm) in phosphate buffer of 10 mmol/L and pH=8, followed by a ≥10 h equilibration period at room temperature before measurements. An aliquot of each sample was titrated with 0.1 mol/L hydrochloric acid to pH=3 to 4. Circular Dichroism (CD) spectra of the samples were recorded on a Jasco J-715 spectropolarimeter (0.1 cm quartz cell, 25 °C, 260 nm to 185 nm).
Preparation of mouse models
All animal studies were performed in compliance with the UK Home Office Animals (Scientific Procedures) Act 1986. Male C57BL/6 and male SCID (Severally Compromised Immuno-Deficient) mice with a typical body weight of 18 g to 25 g were obtained from Charles River, UK. Ca. 106 LLC cells (Lewis Lung Carcinoma [15], mouse lung, ECACC 90020104) were implanted subcutaneously in the inner right thigh of C57BL/6 mice, ca. 106 PC-3 cells (prostate adenocarcinoma [16], human prostate, ATCC CRL-1435) in the nape of the neck of SCID mice, and ca. 4·106 LNCaP cells (Lymph Node Carcinoma of the Prostate [17], human prostate, ATCC CRL-1740) in the nape of the neck of SCID mice. Both PC-3 and LNCaP cell suspensions were prepared with 50% (v/v) Matrigel™ for the inoculations. Tumours were allowed to grow to a size of typically 0.2 g to 0.5 g (some tumours up to ≈1 g), corresponding to growth periods of ≈12 days for LLC, ≈30 days for PC-3 and ≈45 days for LNCaP.
Tumour characterization I: vascularisation
The level of vascularisation was estimated from biodistribution of the in vivo angiogenesis marker 99mTc-NC100692 [18] in tumoured mice at 2 or 5 min p.i. to assess initial delivery and at 24 or 2 h p.i. to assess retention of the agent. This method is explained in more detail in the discussion.
Tumour characterization II: pHe
The mean extracellular pH across the whole tumour was measured via 31P-MRS experiments at 4.7 T with a 10 mm single loop surface coil placed above the tumour of the anaesthetized animal (≈2% (v/v) isoflurane in oxygen). Diethyl (2-methylpyrrolidin-2-yl)phosphate (Toronto Research Chemicals, Canada; used as received) as pHe marker provides high pHe resolution in vitro [19], but it was found to be toxic for mice at 7 mmol/kg i.p. Therefore the established marker 3-aminopropyl phosphonate (3-APP, [20]) in phosphate buffered saline (PBS) was used (11 to 14 mmol/kg i.p.). During scanning, respiration was regulated to usually 70 to 110 bpm and temperature to usually 35 to 37 °C. Shimming was done on the 1H water signal observed through the 31P surface coil. Optimal signal-to-noise ratio (SNR) and minimal contamination from background (muscle, skin, fat) signal were found by variation of (1) the tumour position within the surface coil sensitive region, (2) the length/power of the rectangular RF pulse of the simple pulse/acquire scheme, (3) the repetition time (eventually 0.35 s chosen). About 10 min after 3-APP injection, 31P-MR spectrum acquisition commenced with usually 8 to 16 min per averaged spectrum. Data were Gauss-Lorentzian filtered, L(t) · G(t)=eπ·LB·t·e−(t/GB)2with typically LB=−50 Hz and GB=0.01 s, for smoothing and to sufficiently attenuate the common baseline distortion. The chemical shift difference between 3-APP and α-nucleoside triphosphate (α-NTP) signals was then transformed into pHe via a phantom titration curve [21]. Since the 3-APP signal line width was similar to that of α-NTP, a correction for a potential pHe distribution in tissue [22] was considered unnecessary. Few spectra with larger or asymmetric 3-APP lines were excluded as were spectra where the signal intensity ratio of phosphocreatine (PCr) to α-NTP was >0.8 (see e.g. spectra in refs. [8,20,23–25]). Assuming that the actual PCr concentration in tumour tissue is negligible, the observed ratio of 0.8 is estimated to correspond to a tumour signal purity of ≈75%. Additionally a considerable phosphomonoester (PME) signal intensity relative to α-NTP was viewed as indicator of a typical tumour spectrum, cf. e.g. [25]. The inorganic phosphate (Pi) signal often was insufficiently resolved and therefore not used to estimate intracellular pH and bioenergetic status [26].
In vivo stability in rat plasma
99mTc-AH114567 formulation (≈20 MBq) was injected i.v. into the tail vein of naïve, anaesthetized (isoflurane) rats. Blood was sampled from the vena cava (one rat each at 2 and 30 min p.i., two rats at 60 min p.i.). The plasma fraction was processed via solid phase extraction, followed by dissolution in the starting mobile phase of 30% (v/v) acetonitrile in water with 0.1% trifluoroacetic acid. This was injected into the radio-HPLC system with a Hichrom ACE 5 C4 column (150 mm·4.6 mm, 300 Å). The linear solvent gradient reached 90% (v/v) acetonitrile after 25 min, the flow rate was 1 ml/min, and signals were detected via UV at 254 nm and subsequently by a scintillation counter. Mean and standard deviation (SD) values are from 2 independent studies.
Biodistribution
Each conscious mouse was injected with 99mTc-AH114567 formulation (0.1 ml, 1–5 MBq, towards higher injected radioactivity in case of formulation 2) as an intravenous bolus into a tail vein. At predefined time points post injection (p.i.) animals were euthanized and the following organs and tissues taken: bladder (including urine), blood, bone, brain, faeces, fat, heart, intestines (small and large, including contents), kidneys, liver (together with gall bladder), lungs, muscle, skin, spleen, stomach, thyroid, tumour, and voided urine. These organs and tissues, the injection site and the remaining carcass were then assayed for radioactivity in an automatic scintillation counter. Results are presented as “% ID” (fraction of the injected dose) and “% ID/g” (% ID normalized to the sampled organ or tissue weight) as function of time p.i.
Biodistribution/pHe modulation study
Specificity was tested in biodistribution studies via pHe modulation. Standard drinking water was supplemented with 200 mmol/L NaHCO3 provided ad libitum for 5 days prior to administration of 99mTc-AH114567 and dissection. This regimen is likely to raise the pHe of tumours by ≈0.25 to 0.3 pH units [27]. However, one study reports no significant difference [8], and another one a difference of 0.9 pH units [23].
Small-animal SPECT/CT imaging
Preclinical SPECT/CT (Computed Tomography) whole-body imaging of LLC tumoured mice was performed after the same preparation as for biodistribution studies, except that the 99mTc-AH114567 dose was larger (0.3 mL, 80–130 MBq) and administration was done as 2 min infusion 2 to 6 h after radiosynthesis and formulation (improved formulation 2 only). Anaesthesia, respiration and temperature control were the same as in the MRS experiments. Acquisition of images was performed on an Inveon multimodality scanner [28] (Siemens Healthcare) and reconstruction with Cobra (Exxim Computing Corporation). Spiral CT images (40 kVp, 0.5 mA, fan beam, 2 bed positions, 220 rotation steps) were acquired within 4.2 min. In some cases a standard iodine contrast agent was applied combined with a tube voltage of 80 kVp. Filtered backprojection reconstruction gave images with 480·922 (transaxial·axial) cubic pixels with 0.1037 mm edge length. SPECT images were acquired 22 to 24 h post i.v. injection of 99mTc-AH114567 within a 91 min frame with 60 projections using 2 detector heads equipped with 5-pinhole (1 mm diameter) collimators. 3D-MAP (maximum a posteriori) reconstruction (10 subsets, 8 iterations) without attenuation and scatter correction provided images with 120·380 (transaxial·axial) cubic pixels with 0.5 mm edge length. Image analysis was done with Amide 0.9.2 [29], including trilinear interpolation and 3D median filtering with a 5·5·5 kernel. Tumour uptake was estimated from an ROI covering the tumour and an ROI covering the whole body except the injection site (w.b.). Image analysis software packages typically output the mean activity concentration 〈cA〉 and the volume V of an ROI. Accordingly, the image derived measure comparable to “% ID/g” from biodistribution studies is . Respectively “% ID/g” (biodistribution) and 〈cA〉 (imaging) uptake values were used to calculate tumour-to-muscle uptake ratios.
RESULTS
CD spectra of tetraamine-conjugated pHLIP in the presence of POPC liposomes indicate secondary structure formation at low pH only which agrees with published data for wild type pHLIP of the same amino acid sequence but without chelator [12]. Following this in vitro work, several in vivo studies had been performed using the 3 described tumour mouse models. Angiogenesis was explored via initial and late tumour uptake of 99mTc-NC100692. The corresponding retention values are given in table 1. The uptake decreases with time as expected. When comparing PC-3 and LNCaP, the initial tumour uptake is not different statistically, but at 24 h p.i. it decreases much more in PC-3 than in LNCaP (Student’s t-test, P=0.002).
TABLE 1. Uptake of 99mTc-NC100692 in tumour and retention (=ratio of late to initial uptake).
Explanations: Confidence intervals (CI) of the ratios calculated via Fieller method [36].
| LLC (N=6) |
PC-3 (N=4, 3) |
LNCaP (N=3) |
|
|---|---|---|---|
| [% ID/g] at 2 min p.i. (LLC: 5 min p.i.) | 3.3±0.5 | 3.4±0.5 | 4.6±1.1 |
| [% ID/g] at 24 h p.i. (LLC: 2 h p.i.) | 1.8±0.2 | 0.61±0.11 | 2.3±0.4 |
| retention (95% CI bounds) [%] | 54 (46; 65) | 18 (12; 25) | 49 (32; 85) |
Figure 2A displays the 31P-MR spectrum of an LLC tumour of 10 mm diameter after 3-APP injection. Note the relatively strong PME and Pi peaks and the weak PCr peak typical for tumour tissue. The chemical shift difference between 3-APP and α-NTP translates to pHe=6.89 in the example. The scatter plot in figure 2B shows all pHe results. Mean and SD values are summarized in table 2 together with P values of Student’s t-tests.
FIGURE 2.
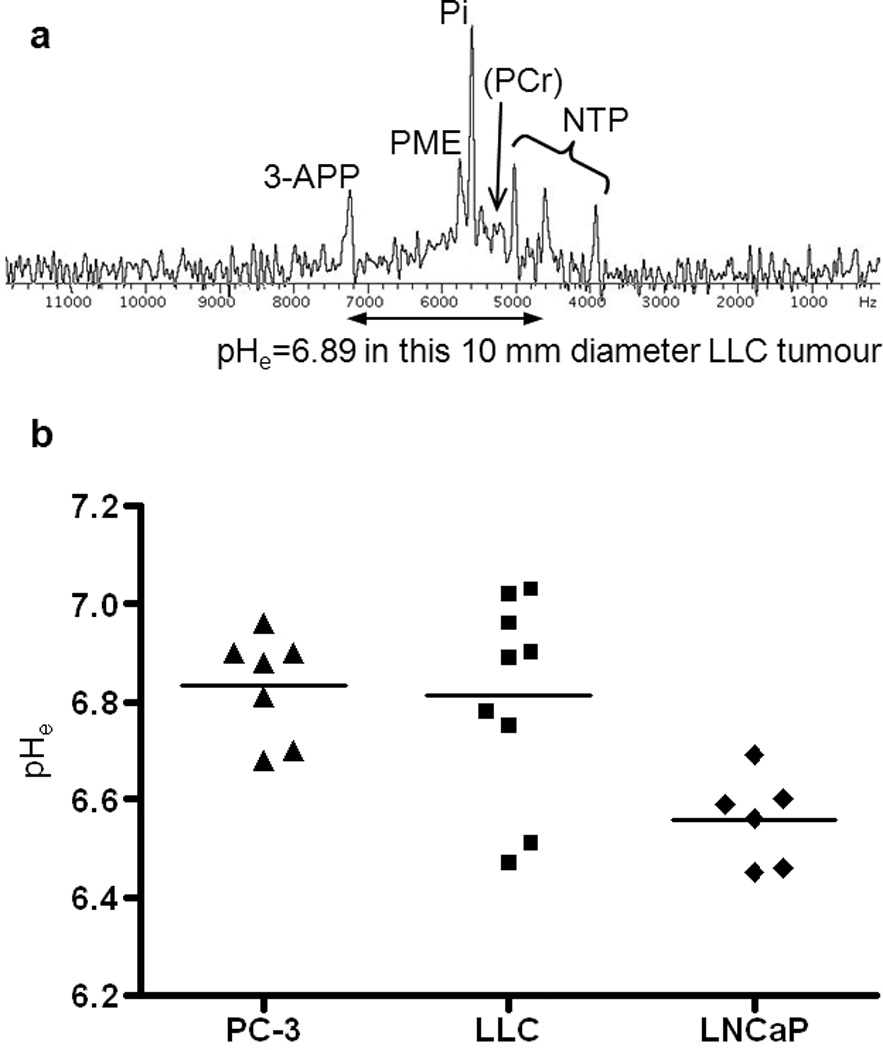
(A) In vivo 31P-MR spectrum of a 10 mm diameter LLC tumour with assignments to metabolites and to the pHe marker 3-APP. The frequency axis in hertz is relative to the transmitter frequency of 80.900 MHz. (B) Scatter plot of tumour bulk pHe measurements and mean values.
TABLE 2. Summary of pHe results in tumours and of statistical tests.
| tumour type | this study | literature [8] |
|---|---|---|
| LLC | 6.81±0.21 (N=9) | – |
| PC-3 | 6.83±0.11 (N=7) | 7.23±0.10 (N=3) |
| LNCaP | 6.56±0.09 (N=6) | 6.78±0.29 (N=6, batch 1) 6.62±0.35 (N=6, batch 2) |
| ANOVA for LNCaP, LLC, PC-3 (column “this study”); Student’s t-tests for PC-3 vs. LNCaP (column “literature”) | P<0.01 | P=0.040 (batch 1) P=0.026 (batch 2) |
| Tukey-Kramer test: LLC vs. PC-3 (similar 99mTc-AH114567 uptake) | P>0.05 | not applicable |
| Tukey-Kramer test: LLC vs. LNCaP (similar vascularity) | P<0.05 | not applicable |
Rat plasma radio-HPLC traces show integrated signals of the parent compound of (85±7)% at 2 min p.i., (87±2)% at 20 min p.i., and (86±6)% at 60 min p.i. compared to (91±7)% for the spiked phantom sample. The remaining signal intensity is predominantly from a peak at the retention time of pertechnetate.
Tables with 99mTc-AH114567 biodistribution results (uptake in blood, liver+gall bladder, lung, muscle, and tumour in % ID/g; uptake in bladder+all excreted urine, faeces, kidneys, large intestines, liver+gall bladder, spleen, stomach, and small intestines in %ID; tumour and body weights) are provided as Electronic Supplementary Material. Key data are plotted as follows. Figure 3 displays the pharmacokinetics in blood and tumour in all three evaluated models from 2 min to 24 h p.i. Initial blood uptake is typically 45% ID/g decreasing steadily to ≈1 to 2% ID/g at 24 h p.i. Tumour uptake is fairly constant from 1 or 2 h p.i. up to 24 h p.i. This is also shown in figure 4 which illustrates that tumour uptake data aggregated from 4 to 24 h p.i. are similar to the 24 h p.i. (imaging time point) subset. In particular for LLC tumours, the tumour size varied within studies (all 36 LLC tumours from 4 to 24 h p.i. dissections: mean=0.64 g, SD=0.40 g), but no correlation was observed between 99mTc-AH114567 uptake in tumours and tumour weight for any of the three tumour types from 4 to 24 h p.i. (Pearson, two-tailed). Furthermore, 99mTc-AH114567 uptake in LLC and in PC-3 and 64Cu-DOTA-pHLIP uptake in PC-3 are similar. The LLC tumour/blood uptake ratio is significantly higher due to a lower measured uptake in blood, possibly due to the different mouse strain of this in-house established model compared to the PC-3 and LNCaP models which were set up with SCID mice as in [8]. When comparing the LNCaP to the PC-3 model, the 64Cu-DOTA-pHLIP data do not show a statistically significant tumour uptake or tumour/blood uptake ratio difference, whereas the 99mTc-AH114567 data show significantly higher values for LNCaP tumours.
FIGURE 3.
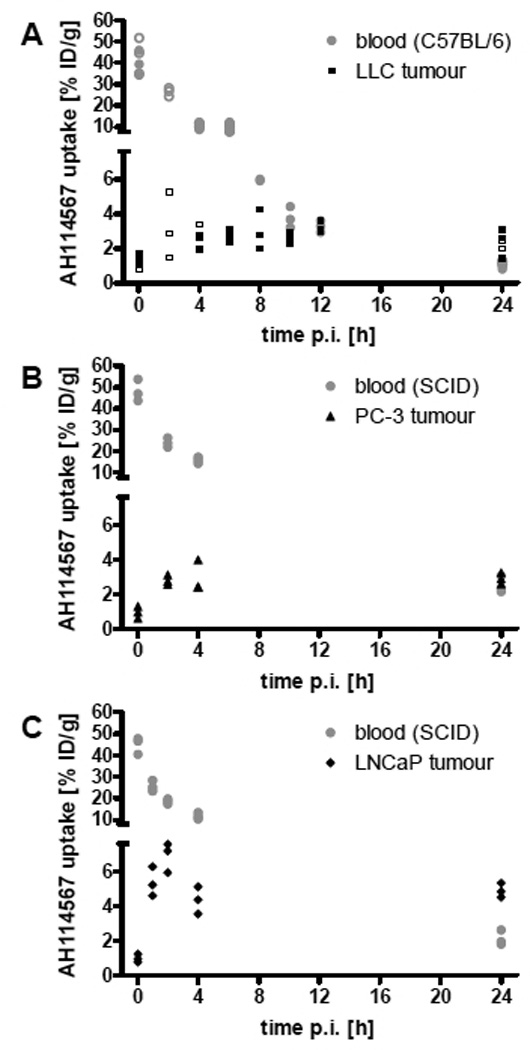
99mTc-AH114567 uptake in % ID/g in (A) LLC, (B) PC-3, (C) LNCaP model. Circles: uptake in blood, triangles: uptake in tumour, open symbols: repeat study of selected time points. N=3 per study. Displayed are individual animal data (2 outliers removed). The two segments of the ordinate end and start at 7.6% ID/g, respectively.
FIGURE 4.
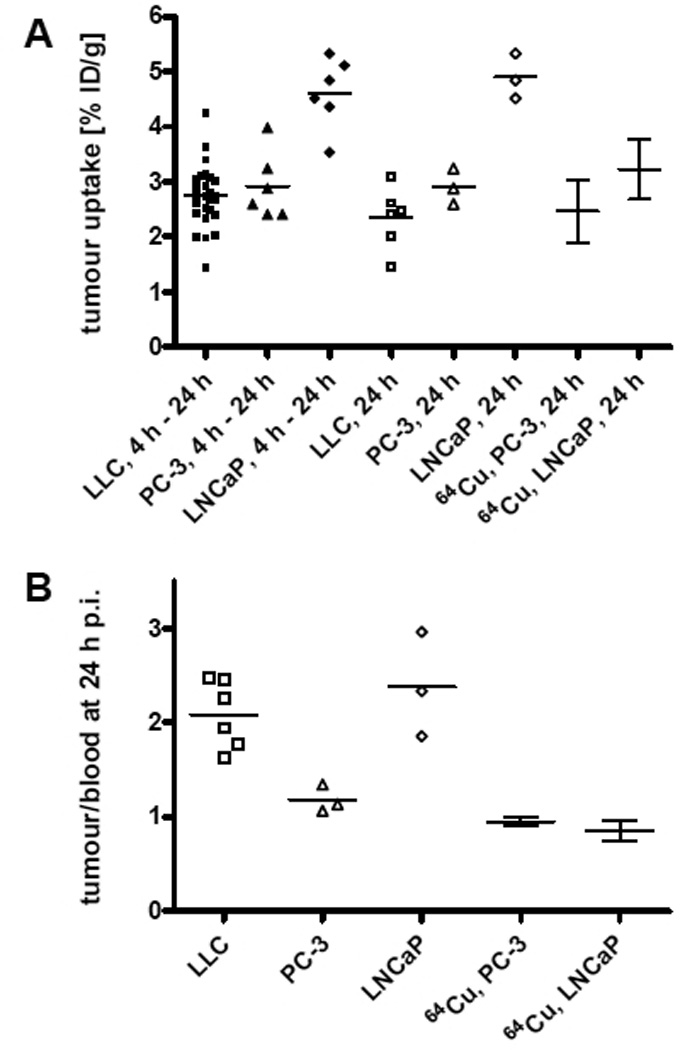
(A) Tumour uptake in % ID/g and (B) tumour/blood uptake ratio of 99mTc-AH114567 and 64Cu-DOTA-pHLIP (data from [8], N=4 to 5) in all evaluated tumour models. All data from 24 h p.i. except first 3 columns in (A) with aggregated data from 4 h to 24 h p.i. Mean values are displayed with individual animal data for this study and with SD error bars as reported in the literature [8].
Figure 5 shows retention and clearance of 99mTc-AH114567 (and potential metabolites) through liver and kidney in C57BL/6 mice. The same pattern is observed in SCID mice (see Electronic Supplementary Material). Renal excretion is most pronounced, but hepatobiliary excretion is also significant. Uptake in liver is high at a 25 to 15% ID level over the first 24 h p.i. Kidney uptake levels peak at 4 to 8 h p.i. at 10% ID followed by a more rapid wash-out than in liver towards 3% ID at 24 h p.i.
FIGURE 5.
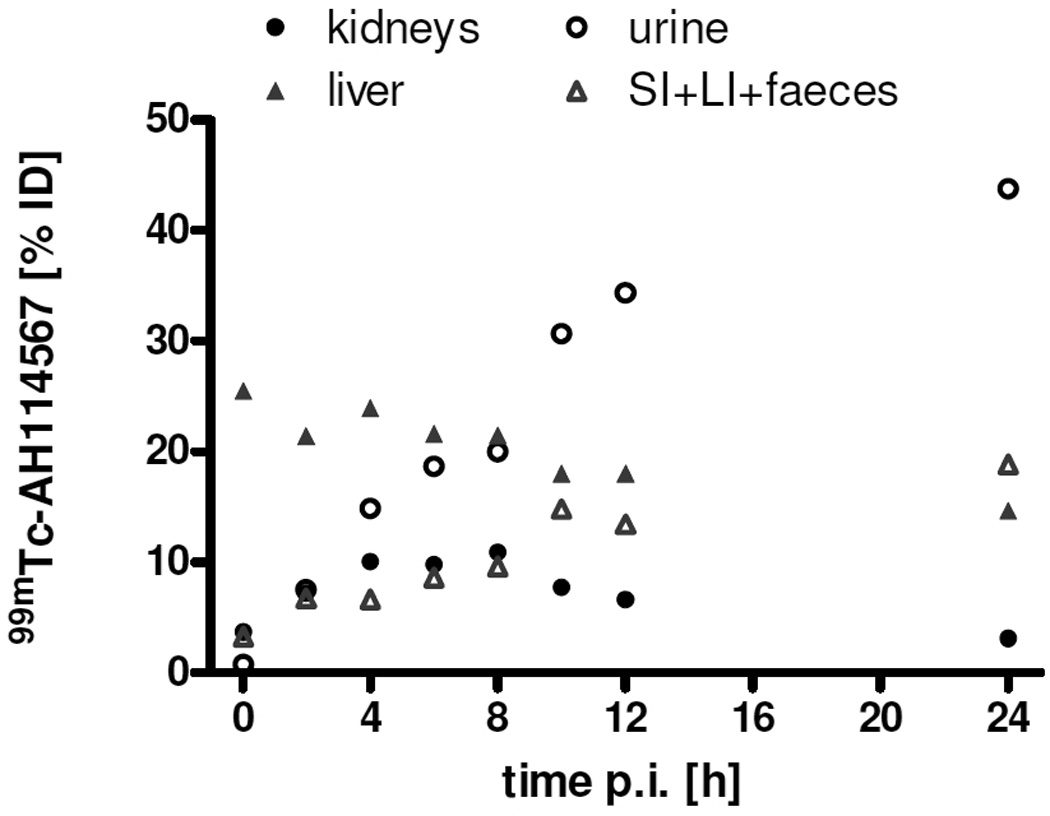
Retention in liver(+gall bladder) and kidneys and corresponding excretion of 99mTc-AH114567 (and potential metabolites). Mean values of 3 or 6 LLC tumoured C57BL/6 mice as in figure 3A, error bars being omitted for clarity.
Uptake in other organs and tissues (see Electronic Supplementary Material for details) can be summarized as follows. Muscle uptake is initially ca. 1% ID/g decreasing to ≈0.5% ID/g at 24 h p.i. The lung/blood uptake ratio is initially ≈3, then ≈2 at 4 h p.i. and ≈1 at 24 h p.i. Spleen and stomach uptake is always <2 % ID each, and skin uptake is in the range 3 to 8% ID. Uptake in bone is found at typically 2 to 3% ID, in thyroids usually <0.4% ID, in brain initially ≈0.5% ID decreasing gradually to ≈0.1% ID at 24 h p.i.
Formulations 1 and 2 (the latter with cold precursor added after purification) were compared in biodistributions in the LLC model and no statistically significant differences were observed.
Biodistribution results at 24 h p.i. with pHe modulation by bicarbonate per os are given in table 3. This is compared to data from [8] at 4 h p.i. The difference in time is of no concern with regards to tumour tissue since the uptake is apparently stable during that period of time, vide supra. For LNCaP and PC-3, a reduced uptake is observed upon bicarbonate treatment, while the difference was not statistically significant for the two LLC studies.
TABLE 3. Summary of pHe modulation study results in tumours at 24 h (or 4 h were indicated) p.i.
Explanations: The uptake ratio (=tumour uptake difference relative to the standard measurement) is calculated as (ustandard−ubicarbonate)/ustandard=1− ubicarbonate/ustandard with uptake values u. in case the P value of Student’s t-test (two-tailed, unpaired) is <0.05 or very close to 0.05. Otherwise, only the P value is shown. 95% confidence intervals (CI) of the ratios are calculated employing the Fieller method [36]. See Electronic Supplementary Material for the detailed uptake data used to calculate the tumour uptake ratios listed here.
| experiment | tumour uptake ratio |
|---|---|
| LLC, study 1 | not statistically significant (P=0.3) |
| LLC, study 2 | not statistically significant (P=0.98) |
| PC-3 | 29% (P=0.053; CI: 0%, 51%) |
| LNCaP | 29% (P=0.020; CI: 10%, 42%) |
| LNCaP, 64Cu-DOTA-pHLIP, 4 h p.i. [8] | 71% (P<0.005; CI: 38%, 88%) |
The SPECT/CT images of 99mTc-AH114567 in figure 6 confirm predominant uptake in liver, kidneys and bladder at ≈1 day p.i. Within kidneys, activity clearly accumulates in the cortex (see figures in Electronic Supplementary Material). Considerable uptake is found in LLC tumours with (3.8±0.9)% ID/mL and a tumour-to-muscle ratio of 4.2±2.8 as estimated from images (N=5). The three views of the tumour in figure 6 suggest a somewhat heterogeneous distribution profile with reduced uptake in the tumour centre. Furthermore, no significant uptake is found in brain but there is some in the region of salivary and thyroid glands and near nose and mouth. Due to a technical problem, the radiochemical purity (RCP) for this preparation was measured only ≈24 h p.i., butit was still high at ≥85%.
FIGURE 6.
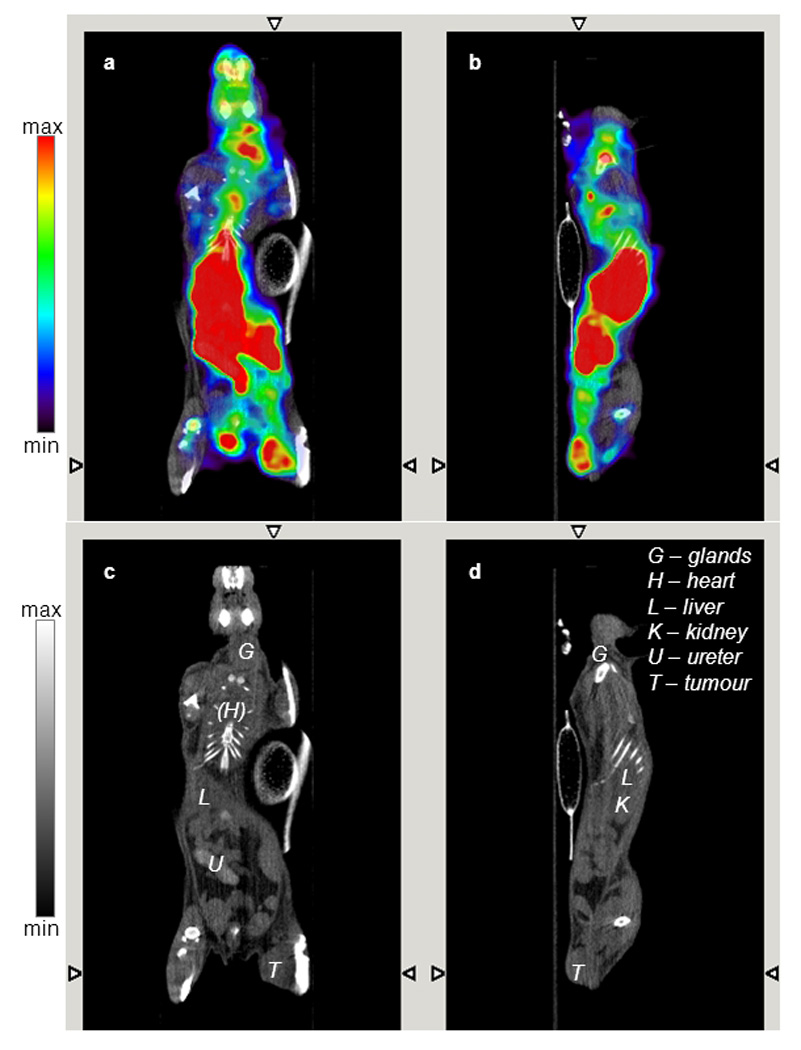
Fused SPECT/CT (panels A, B) and CT only images (panels C, D) acquired 22 h post i.v. injection of 128 MBq 99mTc-AH114567 in a C57BL/6 mouse with LLC tumour in the right thigh (ca. 6 mm · 5 mm · 4 mm). Coronal (panels A, C) and sagittal view (panels B, D). CT images are contrast enhanced (late phase, see hyperintense ureter/bladder).
DISCUSSION
In vitro CD spectra and in vivo metabolism were used to characterize the imaging agent. The CD spectra confirm that pH dependent conformational changes and bilayer insertion properties of the pHLIP agent are maintained after conjugation with the tetraamine chelator. Labelling with 99mTc ions further affects the molecular charge, but since the chelate is conjugated to the non-inserting N-terminus, the Tc labelling might have little effect on the membrane insertion.
The metabolism data demonstrate that 99mTc-AH114567 remains intact in the blood of living rats up to at least 1 h p.i. This covers the main period of delivery of pHLIP from blood to tumour tissue in mice, see also discussion of tumour uptake below.
Next, the characterization of the biological models is discussed which were used in the in vivo studies. The initial (“initial equilibrium”) tumour uptake observed for the angiogenesis marker 99mTc-NC100692 is similar for all tumour types. The increased 99mTc-NC100692 retention in LNCaP compared to PC-3 indicates higher vascularity for LNCaP. The LLC data also suggest a high level of vascularity, although this conclusion is less robust due to the earlier sampling time point (4 h p.i.). Furthermore, the pHe data show that LNCaP tumours are more acidic than PC-3 tumours in agreement with published results [8]. Novel pHe data on LLC tumours are similar to those of PC-3 tumours, both data sets being significantly different to that of LNCaP tumours, see figure 2. In conclusion, LLC and PC-3 may be grouped as “less acidic (less aggressive)” tumour types and LNCaP as “more acidic (more aggressive)” while both LNCaP and LLC are more vascularised. The two potential LLC pHe outliers at pH≈6.5 (see figure 2B) do not affect this overall picture. But they indicate that the study design could be improved by performing SPECT imaging, pHe and biodistribution measurements in the same animals instead of employing separate batches (in [8], pHe and biodistribution were indeed measured in the same animals). Also note that the spatial resolution for the pHe measurements via the 31P MRS method is practically limited to the whole tumour with the technology employed. Thus the 31P MRS measured pHe is only an indicator of the pH at the site of pHLIP membrane insertion on cell membranes. The local pHe near cell membranes may be expected to be even more acidic than the bulk pHe measured here.
The main focus of this study is on 99mTc-AH114567 biodistribution and SPECT imaging which is discussed next. Tumour uptake of 99mTc-AH114567 is fairly constant from 1 or 2 h p.i. to 24 h p.i. while 99mTc (in parent and potential metabolites) is steadily cleared from blood. Similar uptake values are obtained from SPECT images. In some images, an apparently heterogeneous uptake of AH114567 within a relatively large tumour (see figure 6) indicates necrotic regions. This needs to be explored further in subsequent studies employing e.g. histology and autoradiography.
Systemic clearance through and retention in both the hepatobiliary and renal systems is observed, and it might be possible to shift the excretion route towards a more favourable clearance profile through modification of 99mTc-AH114567. This would be one of the objectives for optimization of this tracer. For all other organs and tissues like muscle and lung, the biodistribution data suggest imageability of tumours with 99mTc-AH114567 at 24 h p.i.
Bicarbonate treatment resulted in the expected decrease of 99mTc-AH114567 uptake in tumour in case of LNCaP (the more acidic tumour type) and possibly PC-3 (P from t-test is close to 0.05). The observation with LNCaP tumours is consistent with that reported for 64Cu-DOTA-pHLIP [8], while PC-3/bicarbonate data are reported for the first time for pHLIP. In contrast to LNCaP and PC-3, a decrease in pHLIP uptake was not observed in LLC tumours. A possible explanation is the decreasing pH sensitivity of pHLIP membrane insertion with increasing tumour pHe. Note that the average pHe is >6.5 in the employed tumour models and the bicarbonate treatment is expected to increase the pHe further. On the other hand, the pK of membrane insertion of wild type pHLIP (same amino acid sequence) is ca. 6.0 [13,30]). Thus, bicarbonate treatment is expected to have the greatest effect at pH=6, declining somewhat towards acidic LNCaP tumours, and being rather small for for less acidic PC-3 and LLC tumours. Note that the pHLIP retention curve as function of pHe is non-linear and that a similar absolute bicarbonate-induced pHe shift is assumed in all tumours. Thus the statistical power with N=3 may be insufficient to monitor changes in pHLIP retention for less acidic LLC and PC-3 tumours.
With regards to bicarbonate treatment and MRS pHe measurements, it is conceivable that these measured pHe values show a larger relative variability than the biodistribution uptake results. Note also that there is no statistically significant pHe difference in LNCaP tumours with/without bicarbonate treatment in the previously published PET study, see data tables in [8]. Again the number of animals may have been insufficient to show the expected difference in pHe while it was sufficient for the presumably more precise pHLIP uptake measurements showing significant differences with/without bicarbonate treatment for both 64Cu-DOTA-pHLIP and 99mTc-AH114567. Finally note that there are conflicting reports on the measured pHe change with oral bicarbonate treatment (see Methods section) suggesting that there might be unknown influencing factors and the method may not be very robust despite the simple concept.
The above results on pHe and pHLIP uptake excluding the bicarbonate related results are combined in figure 7 using group mean and SD. Evaluating 99mTc-AH114567 in these three models (i.e. without control measurements) can be regarded sufficient to verify that the concept of this imaging agent proven in vitro also holds true in vivo. The 99mTc-AH114567 data points in figure 7 are based on the abscissa and ordinate values from different animal batches. In contrast both pHe and pHLIP uptake are from the same animals in case of the previously published 64Cu-DOTA-pHLIP data [8]. Regardless of these technical differences, this plot illustrates correlation between tumour extracellular acidity and pHLIP uptake for both tracers (P=0.039 for all data shown, Pearson, one-tailed). Differences for each parameter within the LNCaP tumour subset (3 points) and the PC-3 tumour subset (2 points) could be due to several reasons, including e.g. different passage numbers of the inoculated tumour cells for all studies including the two LNCaP batches in the PET study (personal communication). Nevertheless, the overall trend of positive correlation between pHLIP tumour uptake and extracellular acidity is consistently observed for (a) the 64Cu-DOTA-pHLIP data alone, (b) the 99mTc-AH114567 data alone, and (c) all displayed data combined.
FIGURE 7.
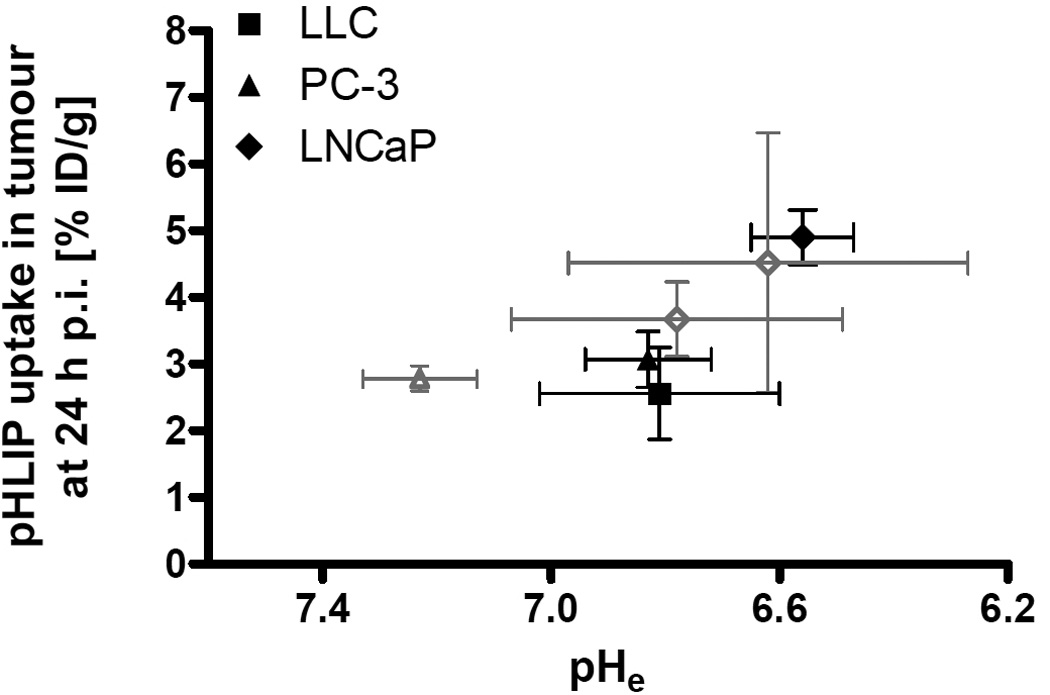
Mean pHLIP uptake in tumour [% ID/g] versus mean pHe for 99mTc-AH114567 (different animal batches for both measures; closed symbols in black) and for 64Cu-DOTA-pHLIP (same animals for both measures; open symbols in grey; triangle: PC-3, diamonds: LNCaP; [8]).
The second most important factor governing in vivo imageability of labelled pHLIP is blood clearance of pHLIP and its labelled metabolites. The observed clearance is slow which probably reflects strong binding of pHLIP to red blood cells and/or plasma proteins. With 99mTc-AH114567, clearance appears to be somewhat slower than for 64Cu-DOTA-pHLIP (about 2 times higher level in blood at 4 h p.i. and 3 to 8 times higher levels in liver at 4 h and 24 h p.i. for 99mTc-AH114567) [8]. Liver uptake is also much lower for optically labelled pHLIP [11] compared to 99mTc-AH114567. The reason might be (a) stronger binding of 99mTc-AH114567 to red blood cells and/or plasma proteins, and (b) slightly different metabolic stability profiles.
As a measure of imageability and guide towards a suitable imaging time window, the tumour uptake and clearance from blood may be combined as tumour/blood ratio. Requiring e.g. a ratio ≥1.2 means that imaging would have to commence ≥12 h p.i. for mildly acidic tumours like LLC. For logistical reasons, ≈22 h p.i. was chosen in this study.
The biodistribution data furthermore show that although there is very strong SPECT background signal to be expected in the abdomen, the uptake in muscle and skin is negligible at practically all times compared to tumour tissues. Therefore a tumour in the neck or in the extremities should be easily discernible in SPECT images according to the biodistribution profile. This is indeed found in pHLIP SPECT images acquired in this study with tumour hotspots clearly visible.
SPECT signal near nose and mouth can be attributed to contamination by excreted activity during the 1 day between 99mTc-AH114567 administration and imaging. A more pronounced signal is observed in the throat region of some animals, probably in the salivary or thyroid glands. Pertechnetate (i.v.) accumulates in glands (and could also cause signal near nose and mouth), but it clears from thyroid glands within 24 h p.i. (unpublished data in Wistar rat, also e.g. [31,32]). Therefore, the observed SPECT signal in those small regions might be from pertechnetate being continuously released from blood at low levels.
When comparing images obtained with the PET and SPECT versions of pHLIP, the main aspects of interest are the administered radioactivity dose, imaging time, and image quality (SNR and contrast for the tumour). Considering the differences in half-lives (64Cu/99mTc≈2), yield of measured decay events (64Cu/99mTc≈0.2) and camera sensitivity (µPET/µSPECT≈10, see [33]), the injected dose in the 64Cu-PET study of typically 7.4 MBq [8] corresponds to ≈30 MBq 99mTc to obtain a similar image SNR. This is a simplified estimate [34], but one can conclude that the overall imaging sensitivity is of the same order of magnitude for both the SPECT and the PET pHLIP studies. This is confirmed qualitatively when inspecting the published PET and SPECT images. In all those images, tumour hotspots can be clearly identified.
An agent with considerably faster clearance from blood enabling an earlier imaging time window is desirable for the application in the clinic for several reasons like improvements in workflow, dosimetry and image quality.
CONCLUSION
A robust synthesis and labelling method for production of 99mTc-pHLIP has been developed, resulting in a good radiolabelling profile including an RCP>98% after purification and a high RCP even after one day. Furthermore a new formulation has been devised which produces a less sticky solution so that less radioactivity remains at injector or injection site after injection. Metabolism data demonstrate a high level of stability of 99mTc-AH114567 in vivo (rat blood) ensuring sufficient delivery of the parent compound to tumours. The three employed tumour types are different in their angiogenesis potential and in their extracellular pH which likely reflects different levels of aggressiveness. Biodistribution and imaging data of 99mTc-AH114567 in preclinical tumour models show imageability of tumours outside the abdominal region with adequate radioactivity dose and image quality in mice. The data also support the expectation from preceding studies that pHLIP uptake correlates with tumour extracellular acidity in vivo. This shows feasibility of this new kind of SPECT imaging, possibly also for other applications outside oncology like inflammation. The main development need for this agent is to optimize blood clearance and membrane insertion properties [30] in order to meet requirements for the clinical application (clinical workflow, dosimetry). Furthermore, it is desirable (a) to increase the number of tumour models and/or devise a more robust control experiment in future studies, and (b) to explore the mechanisms of pHLIP distribution and pharmacokinetics in the tumour tissue more closely by histopathology using advanced methods as described in [35]. Some of these aspects are intended to be explored in a subsequent study on the optimization of this diagnostic imaging agent.
Supplementary Material
ACKNOWLEDGEMENTS
We thank Willy Gsell, David Herlihy, Magdy Mohamed Khalil, Jordi Lopez-Tremoleda and Marzena Wylezinska-Arridge (Biological Imaging Centre at Imperial College, London) for excellent imaging support, and colleagues at GEHC for their technical support and fruitful discussions. Thanks to Clifford Smith (GEHC) for suggesting and supporting this project.
Footnotes
CONFLICT OF INTEREST DISCLOSURE
Conflicts of Interest: S.M., P.I., M.S.M., B.E.A., and E.J. are paid employees of GE Healthcare. O.A.A., Y.K.R., and D.M.E. are consultants for GE Healthcare.
REFERENCES
- 1.Gatenby RA, Gillies RJ. Why do cancers have high aerobic glycolysis? Nat. Rev. Cancer. 2004;4:891–899. doi: 10.1038/nrc1478. [DOI] [PubMed] [Google Scholar]
- 2.Hanahan D, Weinberg R. Hallmarks of cancer: the next generation. Cell. 2011;144:646–674. doi: 10.1016/j.cell.2011.02.013. [DOI] [PubMed] [Google Scholar]
- 3.Warburg O. On the origin of cancer cells. Science. 1956;123:309–314. doi: 10.1126/science.123.3191.309. [DOI] [PubMed] [Google Scholar]
- 4.Helmlinger G, Sckell A, Dellian M, Forbes NS, Jain RK. Acid production in glycolysis-impaired tumors provides new insights into tumor metabolism. Clinical Cancer Research. 2002;8:1284–1291. [PubMed] [Google Scholar]
- 5.Rofstad EK, Mathiesen B, Kindem K, Galappathi K. Acidic extracellular pH promotes experimental metastasis of human melanoma cells in athymic nude mice. Cancer Res. 2006;66:6699–6707. doi: 10.1158/0008-5472.CAN-06-0983. [DOI] [PubMed] [Google Scholar]
- 6.Gillies RJ, Robey I, Gatenby RA. Causes and consequences of increased glucose metabolism of cancers. J Nucl Med. 2008;49:24S–42S. doi: 10.2967/jnumed.107.047258. [DOI] [PubMed] [Google Scholar]
- 7.Reshetnyak Y, Yao L, Zheng S, Kuznetsov S, Engelman D, Andreev O. Measuring tumor aggressiveness and targeting metastatic lesions with fluorescent pHLIP. Mol Imaging Biol. 2011;13:1146–1156. doi: 10.1007/s11307-010-0457-z. [DOI] [PMC free article] [PubMed] [Google Scholar]
- 8.Vavere AL, Biddlecombe GB, Spees WM, Garbow JR, Wijesinghe D, Andreev OA, et al. A novel technology for the imaging of acidic prostate tumors by positron emission tomography. Cancer Res. 2009;69:4510–4516. doi: 10.1158/0008-5472.CAN-08-3781. [DOI] [PMC free article] [PubMed] [Google Scholar]
- 9.Andreev OA, Engelman DM, Reshetnyak YK. pH-sensitive membrane peptides (pHLIPs) as a novel class of delivery agents. Mol Membr Biol. 2010;27:341–352. doi: 10.3109/09687688.2010.509285. [DOI] [PMC free article] [PubMed] [Google Scholar]
- 10.Reshetnyak YK, Andreev OA, Lehnert U, Engelman DM. Translocation of molecules into cells by pH-dependent insertion of a transmembrane helix. Proc Natl Acad Sci U S A. 2006;103:6460–6465. doi: 10.1073/pnas.0601463103. [DOI] [PMC free article] [PubMed] [Google Scholar]
- 11.Andreev OA, Dupuy AD, Segala M, Sandugu S, Serra DA, Chichester CO, et al. Mechanism and uses of a membrane peptide that targets tumors and other acidic tissues in vivo. Proc Natl Acad Sci U S A. 2007;104:7893–7898. doi: 10.1073/pnas.0702439104. [DOI] [PMC free article] [PubMed] [Google Scholar]
- 12.Reshetnyak YK, Segala M, Andreev OA, Engelman DM. A monomeric membrane peptide that lives in three worlds: in solution, attached to inserted across lipid bilayers. Biophys. J. 2007;93:2363–2372. doi: 10.1529/biophysj.107.109967. [DOI] [PMC free article] [PubMed] [Google Scholar]
- 13.Hunt JF, Rath P, Rothschild KJ, Engelman DM. Spontaneous, pH-dependent membrane insertion of a transbilayer alpha-helix. Biochemistry. 1997;36:15177–15192. doi: 10.1021/bi970147b. [DOI] [PubMed] [Google Scholar]
- 14.Duncanson P, Griffiths DV, Bhalla R, Iveson P, Powell NA, O’Shea D, et al. Synthesis of bifunctional tetraamine chelates. In: Mazzi U, editor. Technetium, Rhenium and other metals in Chemistry and Nuclear Medicine. Vol. 7. Padova, Italy: Servizi Grafico Editoriali; 2006. p. 161. [Google Scholar]
- 15.Bertram JS, Janik P. Establishment of a cloned line of Lewis lung carcinoma cells adapted to cell culture. Cancer Lett. 1980;11:63–73. doi: 10.1016/0304-3835(80)90130-5. [DOI] [PubMed] [Google Scholar]
- 16.Ohnuki Y, Marnell MM, Babcock MS, Lechner JF, Kaighn ME. Chromosomal analysis of human prostatic adenocarcinoma cell lines. Cancer Res. 1980;40:524–534. [PubMed] [Google Scholar]
- 17.Horoszewicz JS, Leong SS, Kawinski E, Karr JP, Rosenthal H, Chu TM, et al. LNCaP model of human prostatic carcinoma. Cancer Res. 1983;43:1809–1818. [PubMed] [Google Scholar]
- 18.Edwards D, Jones P, Haramis H, Battle M, Lear R, Barnett DJ, et al. 99mTc-NC100692 - a tracer for imaging vitronectin receptors associated with angiogenesis: a preclinical investigation. Nucl Med Biol. 2008;35:365–375. doi: 10.1016/j.nucmedbio.2007.11.010. [DOI] [PubMed] [Google Scholar]
- 19.Pietri S, Miollan M, Martel S, Le Moigne F, Blaive B, Culcasi M. α- and β-phosphorylated amines and pyrrolidines, a new class of low toxic highly sensitive 31P NMR pH indicators. J Biol Chem. 2000;275:19505–19512. doi: 10.1074/jbc.M001784200. [DOI] [PubMed] [Google Scholar]
- 20.Gillies RJ, Liu Z, Bhujwalla Z. 31P-MRS measurements of extracellular pH of tumors using 3-aminomophosphonate. Am J Physiol. 1994;267:C195–C203. doi: 10.1152/ajpcell.1994.267.1.C195. [DOI] [PubMed] [Google Scholar]
- 21.Ojugo ASE, McSheehy PMJ, McIntyre DJO, McCoy C, Stubbs M, Leach MO, et al. Measurement of the extracellular pH of solid tumours in mice by magnetic resonance spectroscopy: a comparison of exogenous 19F and 31P probes. NMR Biomed. 1999;12:495–504. doi: 10.1002/(sici)1099-1492(199912)12:8<495::aid-nbm594>3.0.co;2-k. [DOI] [PubMed] [Google Scholar]
- 22.Graham RA, Taylor AH, Brown TR. A method for calculating the distribution of pH in tissues and a new source of pH error from the 31P-NMR spectrum. Am J Physiol. 1994;266:638–645. doi: 10.1152/ajpregu.1994.266.2.R638. [DOI] [PubMed] [Google Scholar]
- 23.Raghunand N, He X, van Sluis R, Mahoney B, Baggett B, Taylor CW, et al. Enhancement of chemotherapy by manipulation of tumour pH. Br J Cancer. 1999;80:1005–1011. doi: 10.1038/sj.bjc.6690455. [DOI] [PMC free article] [PubMed] [Google Scholar]
- 24.Reiser M. In: Magnetic Resonance Tomography. Reiser M, Semmler W, Hricak H, editors. Berlin/Heidelberg: Springer-Verlag; 2007. [Google Scholar]
- 25.Krishnamachary B, Glunde K, Wildes F, Mori N, Takagi T, Raman V, et al. Noninvasive detection of lentiviral-mediated choline kinase targeting in a human breast cancer xenograft. Cancer Res. 2009;69:3464–3471. doi: 10.1158/0008-5472.CAN-08-4120. [DOI] [PMC free article] [PubMed] [Google Scholar]
- 26.Stubbs M, Bhujwalla Z, Tozer G, Rodrigues L, Maxwell R, Morgan R, et al. An assessment of 31P MRS of measureing pH in rat tumours. NMR Biomed. 1992;5:351–359. doi: 10.1002/nbm.1940050606. [DOI] [PubMed] [Google Scholar]
- 27.Gallagher FA, Kettunen MI, Day SE, Hu D-E, Ardenkjaer-Larsen JH, in’t Zandt R, et al. Magnetic resonance imaging of pH in vivo using hyperpolarized 13C-labelled bicarbonate. Nature. 2008;453:940–943. doi: 10.1038/nature07017. [DOI] [PubMed] [Google Scholar]
- 28.Austin DW, Paulus MJ, Gleason SS, Mintzer RA, Siegel SB, Figueroa SD, et al. Design and performance of a new SPECT detector for multimodality small animal imaging platforms. IEEE Nuclear Science Symposium Conference Record. 2007;5:3008–3011. [Google Scholar]
- 29.Loening AM, Gambhir SS. AMIDE: A free software tool for multimodality medical image analysis. Mol Imaging. 2003;2:131–137. doi: 10.1162/15353500200303133. [DOI] [PubMed] [Google Scholar]
- 30.Musial-Siwek M, Karabadzhak A, Andreev OA, Reshetnyak YK, Engelman DM. Tuning the insertion properties of pHLIP. Biochim Biophys Acta. 2010;1798:1041–1046. doi: 10.1016/j.bbamem.2009.08.023. [DOI] [PMC free article] [PubMed] [Google Scholar]
- 31.Mata JE, Dyal LA, Slauson ME, Summerton JE, Loehr C, Tyson AR, et al. Tumor imaging using technetium-99m bound to pH-sensitive peptides. Nanomedicine. 2007;3:297–305. doi: 10.1016/j.nano.2007.08.001. [DOI] [PubMed] [Google Scholar]
- 32.Andros G, Harper PV, Lathrop KA, McCardle RJ. Pertechnetate-99m localisation in man with application to thyroid scanning and the study of thyroid physiology. J Clin Endocrinol Metab. 1965;25:1067–1076. doi: 10.1210/jcem-25-8-1067. [DOI] [PubMed] [Google Scholar]
- 33.Jansen FP, Vanderheyden J-L. The future of SPECT in a time of PET. Nucl Med Biol. 2007;34:733–735. doi: 10.1016/j.nucmedbio.2007.06.013. [DOI] [PubMed] [Google Scholar]
- 34.Vallabhajosula S. Molecular Imaging: Radiopharmaceuticals for PET and SPECT. Berlin/Heidelberg: Springer-Verlag; 2009. PET and SPECT Scanners; pp. 59–82. [Google Scholar]
- 35.Li X-F, Carlin S, Urano M, Russell J, Ling CC, O’Donoghue JA. Visualization of Hypoxia in Microscopic Tumors by Immunofluorescent Microscopy. Cancer Research. 2007;67:7646–7653. doi: 10.1158/0008-5472.CAN-06-4353. [DOI] [PubMed] [Google Scholar]
- 36.Fieller EC. The biological standardization of insulin. Suppl. JR. Stat. Soc. 1940;7:1–64. [Google Scholar]
Associated Data
This section collects any data citations, data availability statements, or supplementary materials included in this article.