Abstract
A new subcutaneous (s.c.) trastuzumab formulation provides savings in terms of time and is preferred by patients and health care professionals relative to standard intravenous (i.v.) administration due to simpler and more rapid administration (2–5 minutes). Selection of the s.c. dose was based on a pharmacokinetic bridging approach that aimed to achieve noninferior trastuzumab serum trough concentrations (Ctrough) vs. reference i.v. administration. Using population modeling and simulation, we showed that a fixed 600-mg trastuzumab s.c. dose, administered thrice-weekly (Q3W) without a loading dose, would provide Ctrough (predose Cycle 8) and area under the time–concentration curve (AUC0–21 days, Cycle 7) at least as high as Q3W i.v. administration. The model was retrospectively validated using observed pharmacokinetic data from an independent phase III study of (neo)adjuvant trastuzumab (HannaH). These results provide a strong pharmacokinetic rationale for the trastuzumab s.c. 600-mg fixed dose, supported by the noninferior efficacy of this regimen vs. reference i.v. administration.
Trastuzumab (HERCEPTIN, F. Hoffmann-La Roche, Basel, Switzerland) is the standard of care for human epidermal growth factor receptor 2 (HER2)–positive breast cancer across all disease stages.1,2,3 The currently available formulation is administered by intravenous (i.v.) infusion on thrice-weekly (Q3W) or weekly schedules, with body-weight-adjusted dosing and a loading dose in the first cycle.4 The loading dose should be administered over a period of 90 minutes, and maintenance doses are given over 30 minutes, if the loading dose is well tolerated. A new subcutaneous (s.c.) formulation of trastuzumab has been developed as an alternative to i.v. administration.5 This formulation contains recombinant human hyaluronidase (rHuPH20), which temporarily degrades hyaluronan at the injection site to facilitate injection of the 5-ml dosing volume.6 With a total recommended administration time of between 2 and 5 minutes, the s.c. formulation provides substantial time savings in the clinic and is preferred by both patients and health care professionals.7,8 Administration by the s.c. route is also expected to improve compliance and reduce administration costs.
Selection of the s.c. dose was based on a pharmacokinetic bridging strategy, assuming that an s.c. dose that maintains trastuzumab serum trough concentrations (Ctrough) at least as high as those with i.v. administration would be expected to achieve saturation of target receptors and result in comparable efficacy. Support for this hypothesis is provided by the absence of significant difference in response rate in metastatic breast cancer (MBC) between the approved weekly regimen (4 mg/kg loading dose; 2 mg/kg maintenance doses) and an unapproved weekly regimen (8 mg/kg loading dose; 4 mg/kg maintenance doses), suggesting a plateau in the dose–efficacy relationship.9 Potentially higher Ctrough values than those observed with the i.v. regimen were considered acceptable due to the results from a previous phase I/II study in women with HER2-positive MBC. An intensive loading regimen of trastuzumab (6 mg/kg i.v. on days 1, 8, and 15, followed by 6 mg/kg every 3 weeks from day 22) resulted in a median estimated Ctrough of 119 mg/l, which is higher than the steady-state trough concentrations with a conventional weekly or Q3W regimen (64.9 or 47.3 mg/l, respectively). No new or unexpected adverse events or increased cardiotoxicity were reported during the study. The dosing regimen was well tolerated and had a good efficacy profile.10
The appropriateness of the fixed dose of s.c. trastuzumab selected using the above approach has subsequently been confirmed in the phase III HannaH study (BO22227), which used a noninferiority design to compare the pharmacokinetics, efficacy, and safety of fixed s.c. dosing vs. the reference i.v. regimen in the (neo)adjuvant setting.11
Pharmacokinetic studies of s.c. trastuzumab have been performed in a two-part, phase I/Ib, dose-finding/dose-confirmation trial.12 This study used body-weight-adjusted dosing of trastuzumab s.c. to facilitate comparison with reference (i.e., body weight-based) i.v. dosing and to support assessment of the safety of s.c. administration. To avoid potential underdosing of patients with breast cancer, initial s.c. dose finding in part 1 was conducted in healthy male volunteers. Doses of 6, 8, and 10 mg/kg s.c. and 6 mg/kg i.v. regimens were evaluated, and, based on these results, two trastuzumab s.c. doses (8 and 12 mg/kg) were tested in part 2 (dose confirmation) in patients previously treated for HER2-positive early breast cancer (EBC). The 8 mg/kg s.c. dose was expected to result in trastuzumab serum levels in the range of those achieved with the 6 mg/kg i.v. maintenance dose. The higher 12-mg/kg s.c. dose was tested to generate safety and tolerability data for higher serum levels and to provide further pharmacokinetic data that would facilitate selection of a fixed dose for the subsequent phase III trial.
These preliminary results demonstrated the good tolerability of s.c. administration and encouraged further development of the formulation, including investigation of the feasibility of non–body-weight-adjusted fixed dosing. Administration of a fixed dose of s.c. trastuzumab would permit less complex handling, avoid the need for dose calculation, reduce the potential for dosing errors, and allow development of a single-use injection device. Omission of a loading dose would further simplify dose preparation and administration. We therefore used population pharmacokinetic (PopPK) modeling and simulation to predict a fixed dose of trastuzumab that could be administered without a loading dose.
Here, we summarize the PopPK modeling of data from the phase I/Ib trial and subsequent implementation of this model in simulations to predict the appropriate fixed-dose regimen for s.c. trastuzumab. We also report the retrospective validation of the model using observed pharmacokinetic data from the phase III HannaH trial.
Results
Pharmacokinetic data set
Pharmacokinetic modeling was based on data from the phase I/Ib trial. This included 24 healthy male volunteers who received a single dose of trastuzumab, through either s.c. (6–10 mg/kg, n = 18) or i.v. (6 mg/kg, n = 6), and 42 women with HER2-positive EBC who received a single dose of trastuzumab, s.c. (8 or 12 mg/kg; n = 40) or i.v. (6 mg/kg; n = 6). Because four women participated in both the 6 mg/kg i.v. and 8 mg/kg s.c. cohorts, the dataset comprised serum concentrations from 66 individuals, who received a total of 70 trastuzumab doses. Demographic characteristics have been reported previously.12 Of 789 available serum concentrations, three (0.4%) were excluded because they proved quantifiable despite being theoretically sampled before drug administration.
Exploratory graphical analysis
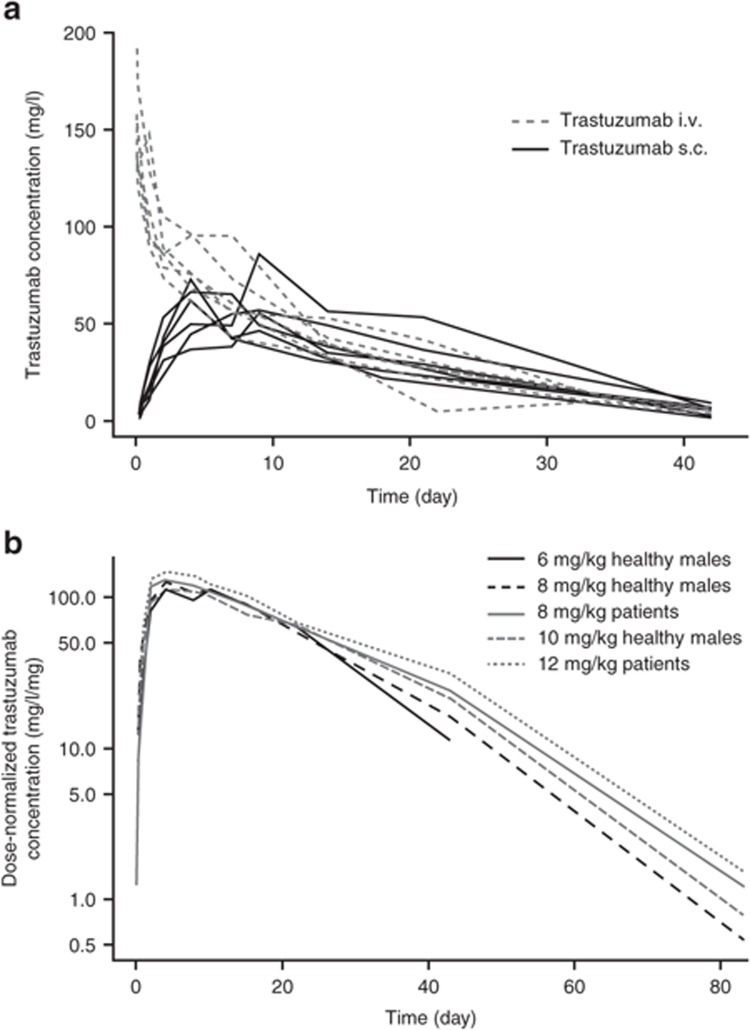
Time courses of trastuzumab serum concentrations following i.v. or s.c. administration of a 6 mg/kg dose to healthy male volunteers suggested high bioavailability (>80%), with a rather slow absorption process after s.c. administration (Figure 1a). Dose-normalized serum concentration–time profiles for s.c. administration indicated that the rate and extent of trastuzumab absorption were dose independent and further provided evidence of nonlinear pharmacokinetics in the terminal elimination phase, with increased clearance (CL) at low serum concentrations (Figure 1b).12
Figure 1.
Serum trastuzumab concentration–time profiles after subcutaneous (s.c.) or intravenous (i.v.) administration. (a) Individual serum trastuzumab concentration–time profiles after s.c. or i.v. administration of a 6 mg/kg dose to healthy subjects. (b) Median serum trastuzumab concentration–time profiles normalized by dose after s.c. administration of various doses in healthy subjects or patients with early breast cancer (EBC).
PopPK modeling
As a starting point, we used a PopPK model previously developed in a population predominantly composed of patients with MBC, who received i.v. trastuzumab.13,14 This was a two-compartment structural model with linear elimination, which included body weight as a covariate for CL and central volume (V2). The exponents of the power functions describing the covariate–parameter relationships were fixed to the original estimates to prevent biased reestimation due to the small sample size of this study.15 A first-order process was used to describe the absorption phase following s.c. administration. Although this model described the data adequately, it showed a small trend for overpredicting trastuzumab serum levels at low concentrations. Inclusion of dual linear and nonlinear elimination processes, in which the nonlinear elimination pathway was described by a Michaelis–Menten model, improved the goodness of fit and reduced the objective function (δ = 97.43).
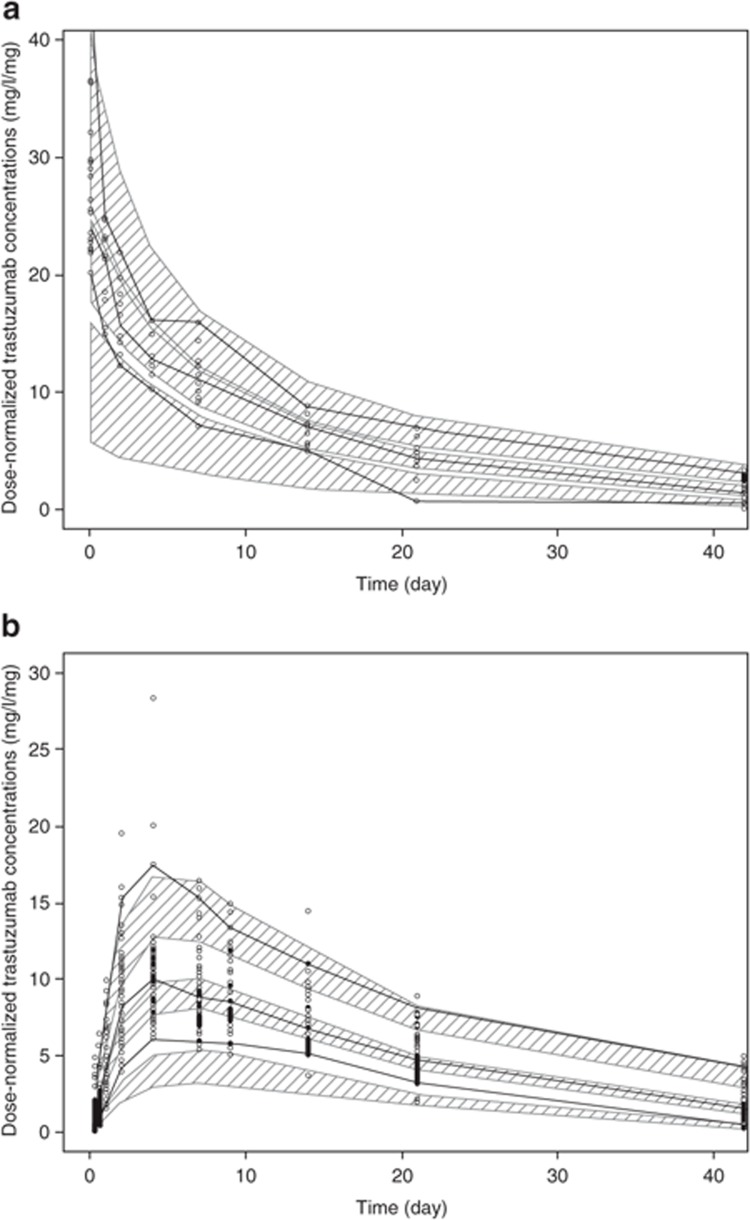
Trastuzumab when administered as s.c. dose is characterized by a bioavailability of 87% and a slow absorption rate (absorption half-life: 2.5 days). The Michaelis constant (Km) was estimated as 6.12 mg/l; therefore, the nonlinear elimination pathway is expected to be saturated at concentrations higher than 50 mg/l. The final model included interindividual variability for CL, V2, absolute bioavailability (F1), and the first-order absorption rate constant (Ka). A proportional error model accounted for residual variability. As shown in Table 1, with the exception of the random effect on the central volume (V2; coefficient of variation: 44.3%), model parameters were estimated with a good precision. Diagnostic plots indicate that the model describes the time course of trastuzumab serum concentrations well across the entire concentration range without substantial bias (Supplementary Figure S1). A visual predictive check confirmed that the model could reliably reproduce trastuzumab serum concentration-time profiles after i.v. or s.c. administration (Figure 2).
Table 1. Population pharmacokinetic model: parameter and variability estimates.
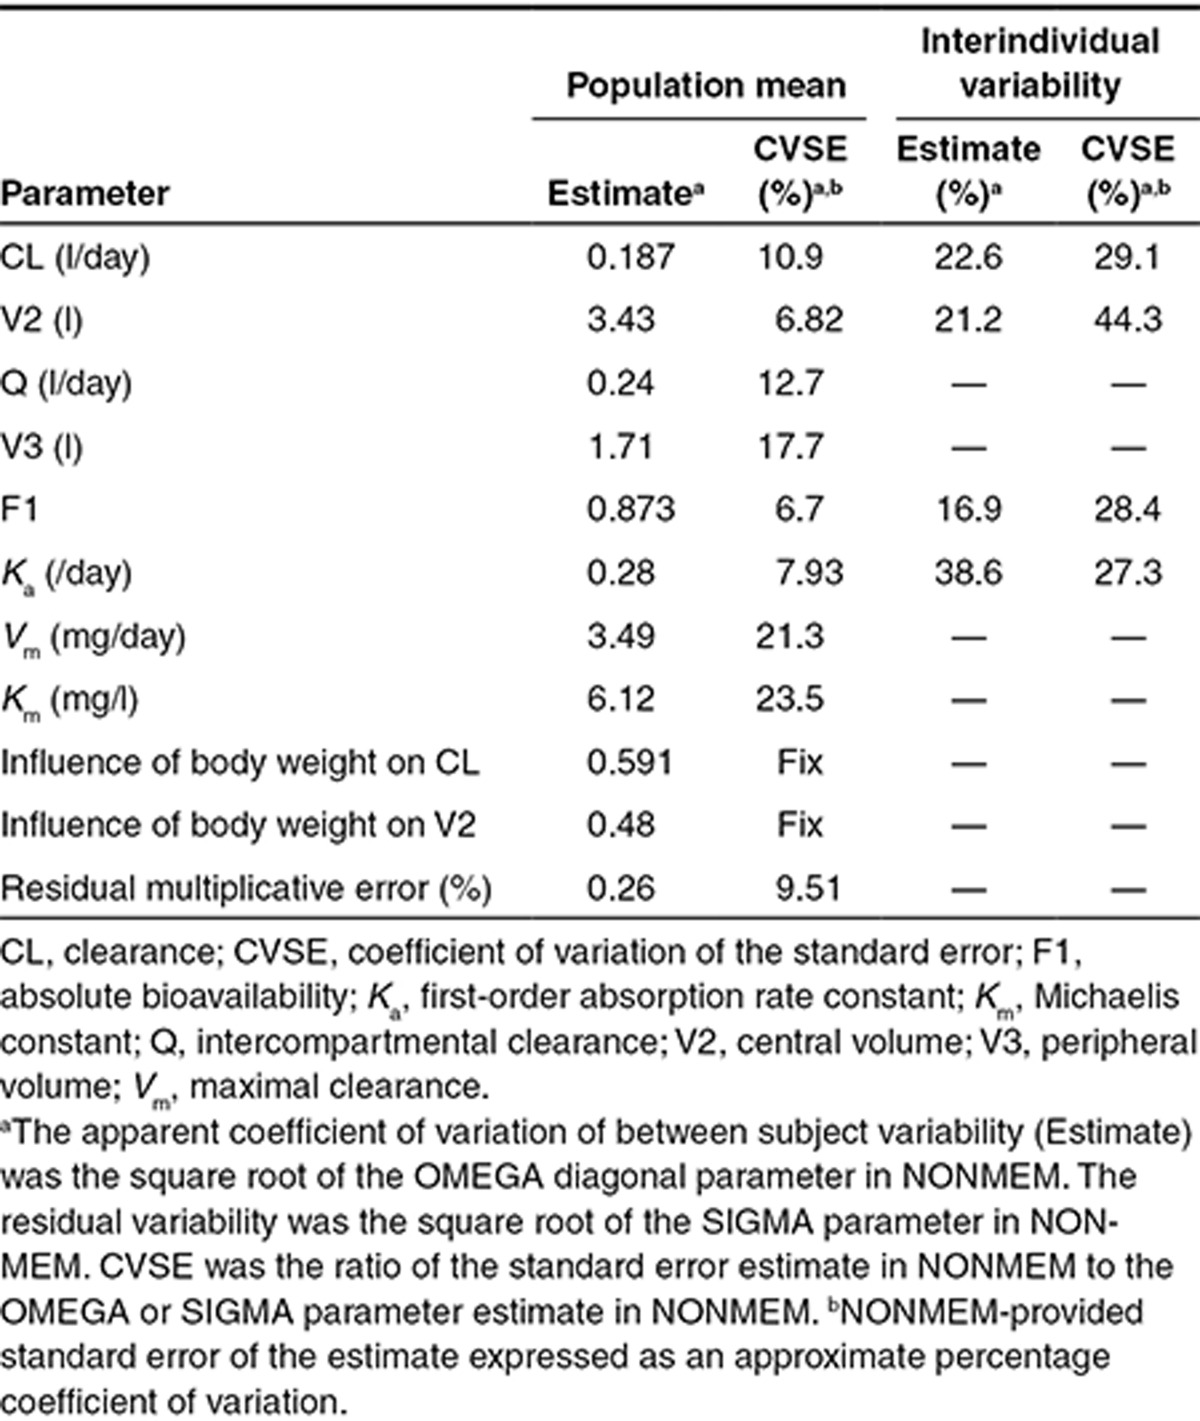
Figure 2.
Visual predictive check (VPC) of the population pharmacokinetic model. (a) Intravenous (i.v.) data. (b) Subcutaneous (s.c.) data. The thick black lines represent the median, 5th percentile, and 95th percentile of observed profiles; the shaded areas indicate the 95% confidence intervals for the median, 5th percentile, and 95th percentile for the predicted profiles; circles indicate observed concentrations.
Pharmacokinetic simulations to identify the appropriate fixed-dose regimen for s.c. trastuzumab
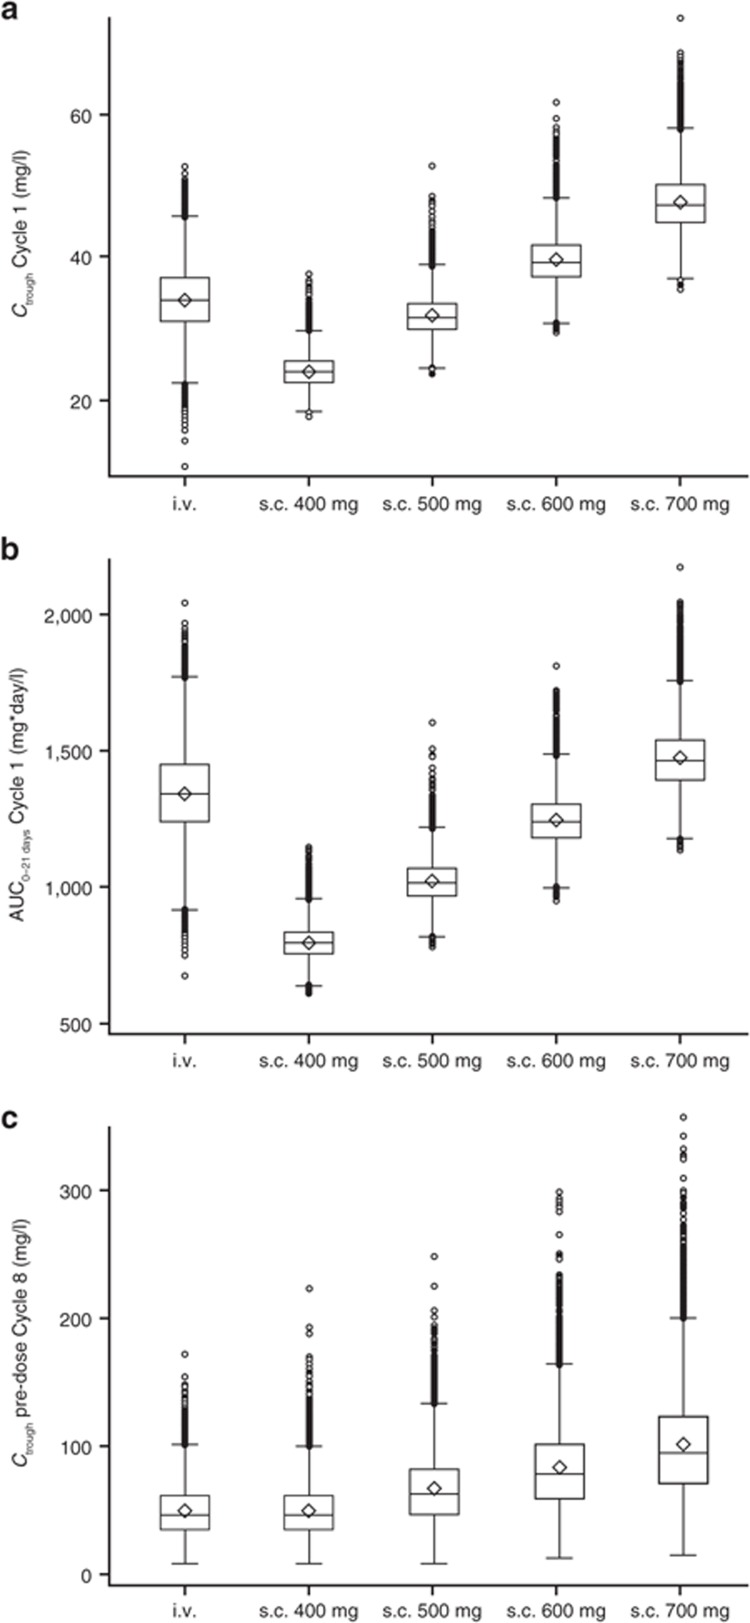
To identify a fixed dose of s.c. trastuzumab that could be administered without a loading dose, the PopPK model was used to simulate the pharmacokinetic profile for four different fixed s.c. doses (400, 500, 600, and 700 mg, all Q3W), which were compared with those obtained from simulations for the reference i.v. regimen (8 mg/kg loading dose, 6 mg/kg maintenance doses, Q3W). Of the simulated s.c. profiles, 600 mg was the lowest dose for which the 5th percentile, median, and 95th percentile for Cycle 1, Cycle 7 Ctrough, and Cycle 7 area under the time–concentration curve from time zero to time 21 (AUC0–21 days) were all at least as high as those with i.v. dosing (Table 2, Figure 3). Simulated median (5th–95th percentile) Ctrough was 39 mg/l (35–46 mg/l) for 600 mg s.c. vs. 34 mg/l (27–40 mg/l) for i.v. dosing at Cycle 1. At Cycle 7, simulated Ctrough values were 79 mg/l (38–143 mg/l) for 600-mg s.c. and 46 mg/l (23–84 mg/l) for the reference i.v. regimen. Simulated median AUC0–21 days for 600-mg s.c. dose was in the range of simulation value for i.v. dosing at Cycle 1 (1,241 and 1,349 mg*day/l, respectively) and was ~40% higher with this s.c. dose vs. that with i.v. administration at Cycle 7 (2,408 and 1,796 mg*day/l, respectively). Collectively, these simulations predict that a fixed 600-mg dose of s.c. trastuzumab would provide Ctrough at least as high as that obtained with the registered i.v. regimen, in addition to similar AUC0–21 days, in both Cycle 1 and Cycle 7 (Table 2), thus ensuring that patients on average would not be underdosed with this novel s.c. regimen.
Table 2. Summary of pharmacokinetic parameters with weight-based i.v. dosing (8/6 mg/kg Q3W) and fixed-dose s.c. dosing (600 mg Q3W) based on 100 replicates.
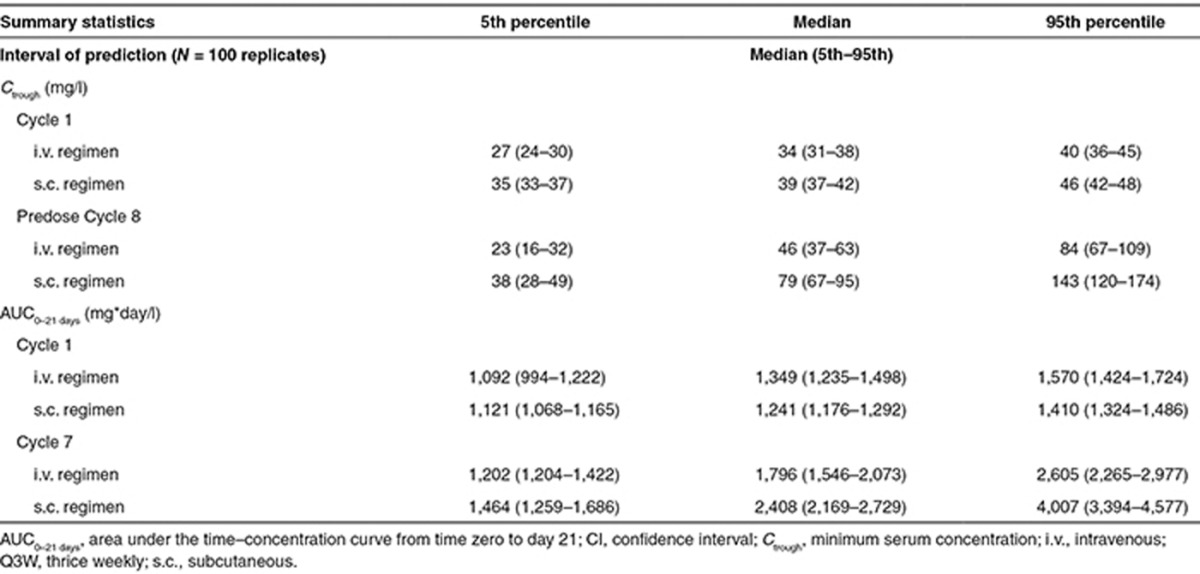
Figure 3.
Distributions of simulated pharmacokinetic parameters. (a) Ctrough at Cycle 1. (b) AUC0–21 days at Cycle 1. (c) Ctrough at predose Cycle 8. Boxes indicate the interquartile range, and the whiskers indicate the range, excluding any outliers. Circles represent outliers, defined by distance >1.5 times the interquartile range below the first quartile or above the third quartile. Within each box, the horizontal line represents the median, and the diamond represents the mean. AUC0–21 days, area under the time–concentration curve from time zero to day 21; Ctrough, minimum serum concentration.
Simulated pharmacokinetic parameters in patients with higher body weight
The PopPK model included body weight as a significant covariate and predicted decreasing drug exposure with increasing body weight.14 Therefore, to ensure that the fixed-dose s.c. regimen did not lead to underdosing of heavier patients, the model was used to compare the simulated pharmacokinetics of trastuzumab when administered as either the 600-mg fixed s.c. dose or the reference i.v. regimen in patients with a body weight of >75 kg (>75th percentile of the virtual population). In this subpopulation, simulated median Cycle 1 Ctrough (5th–95th percentile) was 36 mg/l (33–39 mg/l) with s.c. administration vs. 38 mg/l (34–44 mg/l) with i.v. administration. Corresponding values at predose Cycle 8 were 69 mg/l (33–130 mg/l) and 53 mg/l (25–99 mg/l), respectively. Supplementary Figure S2 shows the distributions of predicted Ctrough for these heavier patients, comparing the selected fixed s.c. dose and the i.v. reference regimen at Cycle 1 and predose Cycle 8. Therefore, the range of exposure in these heavier patients was comparable between fixed-dose s.c. and body-weight-based i.v. regimens.
Retrospective validation of the pharmacokinetic model
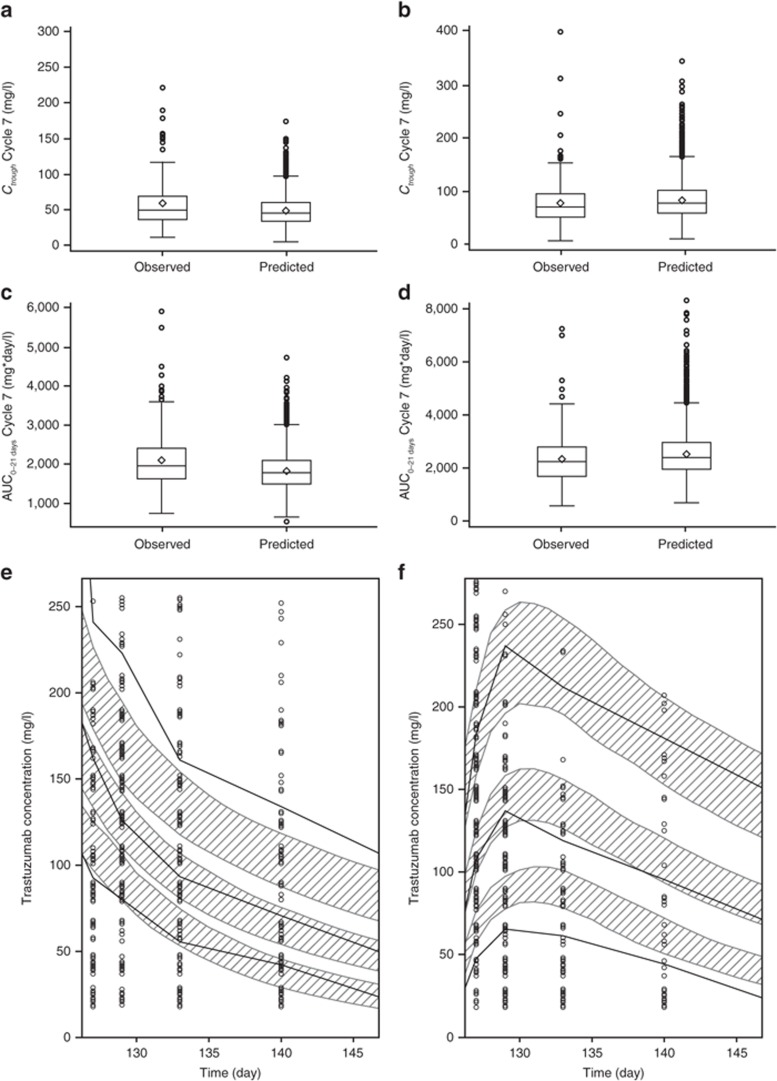
Simulations from the PopPK model based on the phase I/Ib data were consistent with observed pharmacokinetic data from the phase III HannaH study,11 which compared the trastuzumab s.c. fixed 600 mg dose vs. i.v. administration in neoadjuvant treatment of HER2-positive EBC (Figure 4a–d). At Cycle 1, simulated median (5th–95th percentile) Ctrough for the s.c. regimen was 39 mg/l (35–46 mg/l), which was within the range of observed values in the s.c. arm of the HannaH study (median, 29 mg/l; 5th–95th percentile, 12–66 mg/l). For predose Cycle 8 Ctrough with i.v. administration, the simulated median (5th–95th percentile) was 46 mg/l (23–84 mg/l), compared with observed values of 49 mg/l (23–106 mg/l). Simulated and observed median predose Cycle 8 Ctrough values for the s.c. regimen were 79 mg/l (38–143 mg/l) and 70 mg/l (23–150 mg/l), respectively. With i.v. administration, simulated median Cycle 7 AUC0–21 days was 1,796 mg*day/l (1,202–2,605 mg*day/l), compared with observed values of 1,970 mg*day/l (1,320–3,310 mg*day/l). For Cycle 7 AUC0–21 days with s.c. dosing, simulated and observed median values were 2,408 mg*day/l (1,464–4,007 mg*day/l) and 2,260 (1,090–4,010 mg*day/l), respectively. For the majority of the prediction range, observed serum trastuzumab concentrations were consistent with simulations for both arms of the study (Figure 4e,f). There was an overprediction of the 5th percentile and the median at intermediate time points for the s.c. administration. Additionally, the i.v. data were underpredicted for the 90th percentile. We hypothesize that the sample size of 70 patients, which was used to develop the model, may be too small to adequately reflect the pharmacokinetic parameter distribution for the extreme values.
Figure 4.
Model predictions and observed trastuzumab pharmacokinetics in the phase III HannaH study. (a) Cycle 7 Ctrough, intravenous (i.v.) arm. (b) Cycle 7 Ctrough, subcutaneous (s.c.) arm. (c) Cycle 7 AUC0–21 days, i.v. arm. (d) Cycle 7 AUC0–21 days, s.c. arm. (e) Serum trastuzumab concentrations, i.v. arm. (f) Serum trastuzumab concentrations, s.c. arm. In a–d, boxes indicate the interquartile range, whiskers indicate the range (excluding any outliers), horizontal lines represent the median, and diamonds represent the mean. Circles represent outliers, defined by distance >1.5 times the interquartile range below the first quartile or above the third quartile. In e and f, the shaded areas indicate the 95% confidence intervals for the median, 5th percentile, and 95th percentile for the predicted profiles; the thick black lines represent the median, 5th percentile, and 95th percentile of observed profiles; and circles indicate observed concentrations. One extreme outlier for Ctrough in the i.v. arm (800 mg/l) is omitted from the plot in a. AUC0–21 days, area under the time–concentration curve from time zero to day 21; Ctrough, minimum serum concentration.
Discussion
We adopted a PopPK modeling and simulation approach to predict a fixed (non–body-weight-adjusted) dose of s.c. trastuzumab that could be administered without a loading dose, using predefined criteria for dose selection. This strategy enabled dose selection from a weight-based dose-finding study conducted in a moderately small sample size of a mixed population of healthy male volunteers and female patients, who received a single dose of trastuzumab, and made use of the existing PopPK model developed for i.v. trastuzumab to derive the appropriate s.c. fixed dose in the target population. Simulations indicated that the 600-mg s.c. fixed dose (Q3W) would provide noninferior Ctrough to that attained with the body-weight-based, reference i.v. regimen at both Cycle 1 and predose Cycle 8. This fixed s.c. dose should therefore ensure at least the same extent of receptor saturation as i.v. dosing and so provide therapeutic efficacy from the first cycle. The fixed 600 mg s.c. dose was also predicted to provide trastuzumab exposure, expressed as AUC0–21 days, which is similar to that attained with i.v. dosing. Collectively, these simulations provide a strong pharmacokinetic rationale for administration of s.c. trastuzumab at a fixed 600-mg dose, with no requirement for a loading dose.
The appropriateness of the pharmacokinetic bridging strategy and the selected fixed dose was subsequently confirmed in the randomized phase III HannaH study.11 Compared with the reference i.v. regimen, s.c. trastuzumab (600 mg Q3W) demonstrated both noninferior Ctrough and pathologic complete response (pCR) rate when administered in combination with chemotherapy in a large population of patients with HER2-positive EBC in the neoadjuvant setting. The geometric mean ratio Ctrough s.c./Ctrough i.v. value was 1.33, with a lower bound of the two-sided 90% confidence interval (CI) of 1.24, which was larger than the prespecified noninferiority margin of 0.8. Hence, noninferiority for the coprimary pharmacokinetic end point was met. The coefficients of variation for Ctrough at predose Cycle 8 were 52.5% in the i.v. arm and 55.8% in the s.c. arm, showing comparable variability between the two treatment arms.11 A pCR was achieved by 107 (40.7%) of 263 patients in the i.v. group and 118 (45.4%) of 260 in the s.c. group. The difference in pCR between the groups was 4.7% (95% CI:−4.0 to 13.4).11
Consistent with other monoclonal antibodies, and the previous trastuzumab PopPK model developed using data from HER2-positive MBC, trastuzumab pharmacokinetics were described by a two-compartment structural model, with central volume similar to plasma volume and linear distribution to the peripheral compartment.13,16 A tendency for the linear model to overpredict low concentrations in the present data set was observed. The final model therefore included dual linear elimination and a nonlinear, saturable CL pathway with Michaelis–Menten kinetics. Nonlinear CL has been reported for other monoclonal antibodies and is thought to reflect target-mediated drug disposition.16 The final model performed well both in a visual predictive check against the original pharmacokinetic data set and in a retrospective validation experiment that compared model simulations with observed pharmacokinetic data from an independent patient cohort (i.e., the HannaH study population). This validation confirms the appropriateness of the model both for the original dose selection process and for the secondary pharmacokinetic analyses in the HannaH study, which are based on simulated pharmacokinetic parameters.
The PopPK model included body weight as a significant covariate for CL and V2 and, for the fixed s.c. dose, predicts decreasing exposure as body weight increases. However, the range of exposures among patients with higher body weight (>75 kg) is comparable between fixed s.c. dosing and body-weight-based i.v. dosing. Further evidence that the fixed-dose s.c. regimen does not lead to underdosing of heavier patients is provided by the similarity of pCR rates across body weight quartiles in the s.c. arm of the HannaH study.17 Additionally, pCR rates in heavier patients were similar between the s.c. and the i.v. arms. Conversely, although fixed s.c. dosing leads to increasing exposure in patients with lower body weight, safety analyses from HannaH showed no significant correlation between body weight and the rates of severe or serious adverse events in the s.c. trastuzumab arm. Furthermore, s.c. and i.v. administration showed similar safety profiles both in patients weighing <51 kg and in the overall study population.18
These results are concordant with previous PopPK analyses of several therapeutic antibodies.19,20 Contrary to the conventional assumption for small molecules, and given its large therapeutic window coupled with many practical advantages, fixed dosing would be the first option in first-in-human studies.
To conclude, PopPK modeling and simulation identified 600 mg Q3W as an appropriate fixed-dose regimen for s.c. trastuzumab that would achieve the desired pharmacokinetic profile. Together with the results of the phase III HannaH study,11 these data strongly support the administration of s.c. trastuzumab as a fixed-dose regimen, irrespective of patient body weight without a loading dose.
With comparable efficacy and safety profiles, fixed dosing offers many practical advantages. Expected benefits include increased convenience for patients and health care professionals, shorter administration time, independence from i.v. catheterization, improved compliance, lack of requirement for dose calculation, reduced potential for dosing errors, and optimized medical resource utilization. The recent development of a single-use injection device for administration of the fixed s.c. dose may further enhance convenience and consistency of dosing, in addition to offering the potential for self-administration.21 Indeed, recent results from the PrefHer study demonstrated that single-use injection device–based s.c. injection of adjuvant trastuzumab was strongly preferred by patients relative to i.v. infusion and led to substantial time savings.7,8
Methods
Pharmacokinetic data sets. The data set for pharmacokinetic modeling was taken from an open-label, two-part, multicenter, phase I/Ib dose-finding and dose-confirmation study (clinicaltrials.gov identifier: NCT00800436). The design of this study has been reported previously.12 Briefly, in part 1 (dose finding), healthy male volunteers received a single dose of either i.v. trastuzumab at 6 mg/kg (n = 6) or s.c. trastuzumab at 6 (n = 6), 8 (n = 6), or 10 mg/kg (n = 6). In addition, six female patients with HER2-positive EBC received 6 mg/kg i.v. trastuzumab. In part 2 (dose confirmation), female patients with HER2-positive EBC received a single dose of s.c. trastuzumab at 8 (n = 20) or 12 mg/kg (n = 20). Serum samples were collected at the following time points for patients receiving an i.v. dose: predose: 1.5 and 3 hours; postdose: days 2, 3, 5, 8, 15, 22, 35, 43, and 85 and at 5 months. For s.c. dosing, the following time points were sampled: predose: 6, 8, and, 12 hours; postdose: days 2, 3, 5, 8, 10, 15, 22, 43, and 85 and at 5 months. Trastuzumab serum concentrations were assayed using an enzyme-linked immunosorbent assay with a lower limit of quantitation of 0.156 mg/l (Covance Laboratories, Chantilly, VA).
External model validation was based on the randomized, open-label, phase III HannaH study (clinicaltrials.gov identifier: NCT00950300). This study compared s.c. and i.v. administration of trastuzumab in the (neo)adjuvant setting in patients with HER2-positive, operable, locally advanced, or inflammatory breast cancer.11 Participants were randomized to receive neoadjuvant trastuzumab, administered either as the approved i.v. regimen (8/6 mg/kg, Q3W) or as a fixed dose of 600 mg s.c., in combination with four cycles of docetaxel followed by four cycles of 5-fluorouracil, epirubicin, and cyclophosphamide. After surgery, patients continued s.c. or i.v. trastuzumab to complete 1 year of treatment. In the s.c. arm, blood samples were collected for pharmacokinetic analysis during predose stage on day 1 of Cycles 1, 3, 4, 6, 7, and 8. Additional samples were taken on days 2 and 15 of Cycle 1 and on days 2, 4, 8, and 15 of Cycle 7. In the i.v. arm, predose pharmacokinetic samples were collected on day 1 of Cycles 1, 3, 4, 6, 7, and 8 and at the end of infusion on day 1 of Cycles 1–8. Additional sampling was performed during Cycles 1 and 7, as per the s.c. arm. Results from HannaH confirmed the noninferiority of s.c. trastuzumab to i.v. trastuzumab with reference to phamacokinetics.11
Both studies were conducted in accordance with the Declaration of Helsinki and the principles of Good Clinical Practice. Study protocols and amendments were approved by Independent Ethics Committees. All participants provided written informed consent.
Model building and simulations. Analyses were performed using nonlinear mixed-effects modeling in NONMEM (Supplementary Data) (v.6.0, ICON, Ellicott City, MD). Data sets were built using Statistical Analysis Software (SAS v.9.2; SAS Institute, Cary, NC), and graphical analyses were conducted with TIBCO Spotfire S+ (v.8.2, TIBCO Spotfire, Somerville, MA) or SAS. Simulations were performed in Trial Simulator (v.2.2.1, Pharsight, Cary, NC).
PopPK modeling. The analysis was initiated using a reference model established in a population consisting predominantly of patients with MBC, in which a two-compartment model was required to characterize concentration–time profiles following i.v. dosing.13,14 Because trastuzumab targets a cell surface protein, the present data set was examined for manifestations of target-mediated drug disposition behavior. Absorption models with hypotheses of first-order, first-order with lag time, or sequential zero followed by first-order absorption processes were tested for their ability to describe the absorption profile following s.c. administration. Interindividual variability was estimated using an exponential error model. Separate additive, proportional, or combined additive-plus-proportional models were used to describe random residual variability. PopPK parameters and variances were derived using the first-order conditional estimation method with interaction. Model development was guided principally by diagnostic plots and CIs of the mixed-effects parameters using the standard error of the estimates (derived via the covariance option in NONMEM), with the minimum objective function value as a secondary measure.
Prospective model validation. Visual predictive checks. Five hundred replicates of the original design of the phase I/Ib study were simulated using the final model parameter estimates, including residual variability, and the simulated distribution was compared with that from observed data. Median concentrations over time and their 95% CIs were calculated from all replicates and displayed graphically, along with the 5th and 95th percentiles. These plots were then overlaid with observed concentrations. The observed median is expected to lie within the CI of the simulated median profiles, and 80% of the observed concentrations are expected to fall within the 5th and 95th percentiles of the simulated time course profiles.
Dose selection. Selection of the fixed s.c. dose was guided by the basic requirement to ensure at least the same degree of receptor saturation with s.c. and i.v. administration that would ensure comparable therapeutic efficacy. Therefore, Ctrough following s.c. administration should be at least as high as that attained with the reference i.v. regimen and was chosen as the primary pharmacokinetic end point. This criterion should be met from Cycle 1 onward to avoid the need for a loading dose.21 Finally, exposure to trastuzumab, evaluated by AUC0–21 days at Cycle 1 and after repeated doses, was chosen as the secondary pharmacokinetic parameter that should be similar to that seen with i.v. administration. The PopPK model was implemented to simulate Ctrough (Cycle 1 and predose Cycle 8) and AUC0–21 days (Cycles 1, 7, and 8) for the reference i.v. regimen (8 mg/kg loading dose, 6 mg/kg maintenance doses, Q3W) and four fixed s.c. doses (400, 500, 600, or 700 mg, all Q3W). Concentrations were simulated for a virtual population of 260 patients (130 i.v.; 130 s.c.). This corresponds to the pharmacokinetic sample size calculated for the HannaH study, which is required to demonstrate noninferior Ctrough (noninferiority margin for the geometric mean ratio of 0.8) with a power of 80%, assuming an interpatient coefficient of variation of 60% and true means for s.c. vs. i.v. administration that differ by ≤5%. The virtual population had a mean body weight of 68 kg (corresponding to the body weight of a typical patient)22 and standard deviation of 11 kg, which is similar to that expected in the EBC population (Roche, data on file). One hundred simulations were performed for each regimen, and distributions of simulated pharmacokinetic parameters were plotted graphically.
Retrospective model validation. Once the phase III HannaH trial was completed, observed pharmacokinetic data from HannaH were compared with the simulation intervals at Cycle 7 Ctrough (i.e., predose Cycle 8), Cycle 7 AUC0–21 days, and time course concentrations, which were computed from the simulations conducted during dose selection. Observed Cycle 7 Ctrough (predose Cycle 8) was chosen as the coprimary pharmacokinetic end point for HannaH to permit correlation of presurgery pharmacokinetics with pCR. Ctrough value was the actual observed data, and AUC0–21 days was derived via noncompartmental analysis using WinNonlin Enterprise software (v.5.2.1, Pharsight). All patients with a predose Cycle 8 pharmacokinetic measurement were included in the analysis of observed pharmacokinetics in HannaH (i.v.: n = 276; s.c.: n = 278).
Author contributions
F.H.P., C.M., M.B., and B.B. designed the research. F.H.P., C.M., M.B., A.L.D., B.L., and B.B. performed the research. F.H.P., A.L.D., and B.L. analyzed the data.
Conflict of interest
F.H.P., C.M., M.B., A.L.D., and B.B. are employees of F. Hoffmann-La Roche Ltd. B.L. is an employee of Genentech Inc. M.B., B.B., and B.L. own stock in Roche.
Study Highlights
Acknowledgments
Support for third-party writing assistance for this manuscript was provided by F. Hoffmann-La Roche Ltd.
Supplementary Material
References
- National Comprehensive Cancer Network (NCCN). Clinical Practice Guidelines in Oncology: Breast Cancer V1. < http://www.nccn.org > ( 2013
- Aebi S., Davidson T., Gruber G., Cardoso F. ESMO Guidelines Working Group Primary breast cancer: ESMO Clinical Practice Guidelines for diagnosis, treatment and follow-up. Ann. Oncol. 2011;22 suppl. 6:vi12–vi24. doi: 10.1093/annonc/mdr371. [DOI] [PubMed] [Google Scholar]
- Cardoso F., Harbeck N., Fallowfield L., Kyriakides S., Senkus E. ESMO Guidelines Working Group Locally recurrent or metastatic breast cancer: ESMO Clinical Practice Guidelines for diagnosis, treatment and follow-up. Ann. Oncol. 2012;23 suppl. 7:vii11–vii19. doi: 10.1093/annonc/mds232. [DOI] [PubMed] [Google Scholar]
- Herceptin®(trastuzumab) Summary of product characteristics. Roche Registration Ltd < http://ec.europa.eu/health/documents/community-register/2012/20120217118450/anx_118450_en.pdf > ( 2012. Accessed March 2013.
- Bittner B., et al. Development of a subcutaneous formulation for trastuzumab - nonclinical and clinical bridging approach to the approved intravenous dosing regimen. Arzneimittelforschung. 2012;62:401–409. doi: 10.1055/s-0032-1321831. [DOI] [PubMed] [Google Scholar]
- Bookbinder L.H., et al. A recombinant human enzyme for enhanced interstitial transport of therapeutics. J. Control. Release. 2006;114:230–241. doi: 10.1016/j.jconrel.2006.05.027. [DOI] [PubMed] [Google Scholar]
- Pivot X., et al. Patient preference for subcutaneous versus intravenous adjuvant trastuzumab: results of the PrefHer study. 13th St Gallen International Breast Cancer Conference, St Gallen, Switzerland, 13–16 March 2013.
- De Cock E., et al. Time savings with trastuzumab subcutaneous vs. intravenous administration: a time and motion study. 13th St Gallen International Breast Cancer Conference, St Gallen, Switzerland, 13–16 March 2013.
- Vogel C.L., et al. Efficacy and safety of trastuzumab as a single agent in first-line treatment of HER2-overexpressing metastatic breast cancer. J. Clin. Oncol. 2002;20:719–726. doi: 10.1200/JCO.2002.20.3.719. [DOI] [PubMed] [Google Scholar]
- Leyland-Jones B., et al. Intensive loading dose of trastuzumab achieves higher-than-steady-state serum concentrations and is well tolerated. J. Clin. Oncol. 2010;28:960–966. doi: 10.1200/JCO.2009.23.1910. [DOI] [PubMed] [Google Scholar]
- Ismael G., et al. Subcutaneous versus intravenous administration of (neo)adjuvant trastuzumab in patients with HER2-positive, clinical stage I-III breast cancer (HannaH study): a phase 3, open-label, multicentre, randomised trial. Lancet Oncol. 2012;13:869–878. doi: 10.1016/S1470-2045(12)70329-7. [DOI] [PubMed] [Google Scholar]
- Wynne C., Harvey V., Schwabe C., Waaka D., McIntyre C., Bittner B. Comparison of subcutaneous and intravenous administration of trastuzumab: a phase I/Ib trial in healthy male volunteers and patients with HER2-positive breast cancer. J. Clin. Pharmacol. 2013;53:192–201. doi: 10.1177/0091270012436560. [DOI] [PubMed] [Google Scholar]
- Bruno R., Washington C.B., Lu J.F., Lieberman G., Banken L., Klein P. Population pharmacokinetics of trastuzumab in patients with HER2+ metastatic breast cancer. Cancer Chemother. Pharmacol. 2005;56:361–369. doi: 10.1007/s00280-005-1026-z. [DOI] [PubMed] [Google Scholar]
- Fukushima Y., Charoin J.-E., Brewster M., Jonsson E.N. Population pharmacokinetic analysis of trastuzumab (Herceptin©) based on three different dosing regimens. 16th Annual Meeting of the Population Approach Group in Europe, Copenhagen, Denmark, 13–15 June 2007.
- Ribbing J., Jonsson E.N. Power, selection bias and predictive performance of the Population Pharmacokinetic Covariate Model. J. Pharmacokinet. Pharmacodyn. 2004;31:109–134. doi: 10.1023/b:jopa.0000034404.86036.72. [DOI] [PubMed] [Google Scholar]
- Keizer R.J., Huitema A.D., Schellens J.H., Beijnen J.H. Clinical pharmacokinetics of therapeutic monoclonal antibodies. Clin. Pharmacokinet. 2010;49:493–507. doi: 10.2165/11531280-000000000-00000. [DOI] [PubMed] [Google Scholar]
- Melichar B., et al. Pathological complete response to trastuzumab subcutaneous fixeddose formulation in the HannaH study: Subgroup analysis of patient demographics and tumour characteristics and influence of body weight and serum trough concentration of trastuzumab. 37th European Society for Medical Oncology Conference, Vienna, Austria, 28 September–2 October 2012.
- Jackisch C., et al. Additional safety results of HannaH: A Phase III randomised, open-label, international study of the subcutaneous formulation of trastuzumab (H) in HER2-positive early breast cancer patients. 37th European Society for Medical Oncology Conference, Vienna, Austria, 28 September–2 October 2012.
- Wang D.D., Zhang S., Zhao H., Men A.Y., Parivar K. Fixed dosing versus body size-based dosing of monoclonal antibodies in adult clinical trials. J. Clin. Pharmacol. 2009;49:1012–1024. doi: 10.1177/0091270009337512. [DOI] [PubMed] [Google Scholar]
- Bai S., et al. A guide to rational dosing of monoclonal antibodies. Clin. Pharmacokinet. 2012;51:119–135. doi: 10.2165/11596370-000000000-00000. [DOI] [PubMed] [Google Scholar]
- Pegram M., et al. Inhibitory effects of combinations of HER-2/neu antibody and chemotherapeutic agents used for treatment of human breast cancers. Oncogene. 1999;18:2241–2251. doi: 10.1038/sj.onc.1202526. [DOI] [PubMed] [Google Scholar]
- Wynne C.J., et al. Comparative pharmacokinetics of trastuzumab subcutaneous formulation administered using a proprietary single-use injection device, or manually using a syringe. 37th European Society for Medical Oncology Conference, Vienna, Austria, 28 September–2 October 2012.
Associated Data
This section collects any data citations, data availability statements, or supplementary materials included in this article.


