

Abstract
Druggability of a protein is its potential to be modulated by drug-like molecules. It is important in the target selection phase. We hypothesize that: (i) known drug-binding sites contain advantageous physicochemical properties for drug binding, or “druggable microenvironments” and (ii) given a target, the presence of multiple druggable microenvironments similar to those seen previously is associated with a high likelihood of druggability. We developed DrugFEATURE to quantify druggability by assessing the microenvironments in potential small-molecule binding sites. We benchmarked DrugFEATURE using two data sets. One data set measures druggability using NMR-based screening. DrugFEATURE correlates well with this metric. The second data set is based on historical drug discovery outcomes. Using the DrugFEATURE cutoffs derived from the first, we accurately discriminated druggable and difficult targets in the second. We further identified novel druggable transcription factors with implications for cancer therapy. DrugFEATURE provides useful insight for drug discovery, by evaluating druggability and suggesting specific regions for interacting with drug-like molecules.
Drug targets and druggable targets
Currently, marketed drugs mediate their effects through a relatively small number of potential human target proteins. Published estimates of the number of current human drug targets range from 200 to 500.1,2,3 Drews2 estimate 483 target proteins in humans and pathogens. Hopkins and Groom3 identified 399 nonredundant molecular targets in 130 protein families that bind ligands with drug-like properties. Overington et al.1 estimated that the human genome contained 266 proteins that could be targeted by pharmacological agents. They assigned a total of 324 molecular targets (pathogen and human) to 1,065 approved drugs. Rask-Andersen et al.4 analyzed the complete data set of pharmacological agents from DrugBank, and they identified 435 effect-mediating drug targets in the human genome, which are modulated by 980 unique drugs, through 2,242 drug–target interactions.
The concept of druggable targets proposed in 2002 by Hopkins and Groom3 has become crucial in drug discovery, and there has been much discussion of orphan targets within the human genome. Approximately 60% of small-molecule drug discovery projects fail because the target is found to not be druggable.5,6 To exert therapeutic actions, drugs typically have to achieve high-affinity binding to their targets and exercise physiologically relevant effects. The ability of a protein to bind small, drug-like molecules with a high affinity is referred to as “druggability” (ligandability often refers to the more general ability of binding to small molecules). Druggability is related to many factors, including the size of targets, the presence of pockets, and the overall charge and hydrophobicity of the interaction surface. In the end, druggability is an empirical issue, and targets that seem undruggable at one time may yield drugs later. So druggability may best be considered a continuous quality from “very difficult” to “very easy.”
Druggability is difficult to prove as attempts to find drugs asymptotically fail. Nonetheless, it is important to evaluate a protein's potential to be modulated by drug-like molecules in the early stages of drug discovery. Given a disease relevant protein, we aim to estimate its druggability, or the likelihood to be a drug target. In this work, we do not attempt to design drugs to fit into the pocket and focus only on druggability.
Druggability measurement
The most common approach for estimating druggability is to classify targets by whether they belong to gene families known to be druggable, such as G-protein–coupled receptors.3 For the human proteome, there are ~25,000 genes coding for thousands of proteins. In 2002, Hopkins and Groom3 estimated that drug targets belong to ~130 protein families, which covers 10% of all genes in the genome. However, not all members of a given gene family are equally druggable, and more importantly, gene families not currently known to be druggable may still yield novel targets.
We hypothesize that known small-molecule drugs occupy a very limited area of chemical space, and their binding sites share common features. Structural analysis offers the possibility of evaluating the likelihood that a protein will bind drug-like molecules. Although the location of many protein-binding sites can be defined by using comparative sequence analyses, virtual docking studies, or simple geometric factors, much less is known about what determines whether a target will be modulated by drug-like molecules. There are a few studies addressing methods for evaluating target druggability.7,8,9,10,11,12,13,14,15
Drug-like molecules typically achieve high binding affinity to exert their action. Only those targets with pockets of the right shape and chemical composition may be susceptible to pharmacological intervention. Cheng et al.7 developed a method (MAPPOD) to quantify the maximal affinity achievable by drug-like molecules by using a physics-based model that extracts physicochemical properties of binding sites. Their calculated affinity correlates with drug discovery outcomes. Similarly, SiteMap measures druggability by integrating geometry and physicochemical properties of binding sites.8 These two physics-based methods suggest the following main characteristics of undruggable sites: (i) they are strongly hydrophilic with little or no hydrophobic character, (ii) require covalent binding, and (iii) are very small or very shallow.
The first experimental assessment of protein druggability, by Hajduk et al.,16 relies on the two-dimensional NMR screen of a small-molecule fragment library in which hit rates correlate with the protein's ability to bind drug-like ligands with high affinity and were thus proposed to be reliable indicators of druggability. As an alternative to executing a NMR-based screening against drug fragment libraries, we developed a novel computational method, named DrugFEATURE, to calculate target druggability and predict candidate drug or fragments leads. Our method borrows from the lesson of the physics-based methods and the fragment-based approach using a data-driven framework. We compare it directly with those other methods and find it to match the performance of the NMR-based method and compare favorably to the other methods.
Druggable microenvironments
Most drugs bind pockets in targets whose physiological function involves binding endogenous small molecules. These pockets create microenvironments, or physicochemical and structural features that accommodate the small-molecule chemical groups to establish tight binding. Drugs must also, however, achieve high bioavailability and often obey the “rule of five” (RO5) heuristics in order to be absorbed and reliably achieve high blood levels.17 Endogenous ligands often do not obey the RO5, and so successful drugs must combine RO5 features and sufficient chemical properties required to take advantage of the microenvironments conferring binding specificity. For example, adenosine triphosphate (ATP) (an endogenous ligand for kinases) is not drug like and does not obey the RO5 because of the triphosphate moiety. Most known kinase inhibitors are ATP mimetic compounds that have good bioavailability. They binds kinases by forming one to three hydrogen bonds to the amino acids located in the hinge region of the target kinases, mimicking the hydrogen bonds that are normally formed by the adenine ring of ATP.18 That is, these inhibitors take advantage of the microenvironments (hinge region in kinase) responsible for interacting with the adenosine part of ATP.
We have previously described a system, FEATURE, for representing protein “microenvironments,” as statistical descriptions of physicochemical and structural features in a sphere volume of 7.5 Å radius.19,20,21 Importantly, a single drug-binding site comprises several of these microenvironments, often between 10 and 20. We hypothesized that the microenvironments within known drug-binding sites are likely to recur in newly discovered binding sites. Thus, we sought evidence that druggability would correspond to the degree to which a new pocket contains microenvironments previously observed in known drug-binding pockets. In a nutshell, new druggable sites should look like those have been assembled from the components of other druggable sites. Thus, because a drug is typically surrounded by several FEATURE microenvironments, we believe these microenvironments can be mixed and matched to generate binding sites for novel drug-like compounds.
Accordingly, we collected drug-binding sites from known three-dimensional structures, representing a set of good “druggable” microenvironments for drug binding. We show that the number and density of druggable microenvironments is associated with the druggability of a given target. We have created a method, DrugFEATURE, to assess the presence of druggable microenvironments in new pockets and evaluate their overall druggability (Figure 1). We tested DrugFEATURE using published experimental evidence and drug discovery outcomes.
Figure 1.

DrugFEATURE method. The top panel: site representation. A defined site is represented by using multiple FEATURE microenvironments (white spheres). FEATURE microenvironment refers a set of 80 physicochemical properties collected over six concentric spherical shells centered on the predefined functional center. The middle panel: identification of druggable subsites. DrugFEATURE compares a query site to a set of drug-binding sites and identifies similar druggable microenvironments (same colored spheres). A group of druggable microenvironments that match counterparts in one drug-binding site is labeled a druggable subsite. The frequency of druggable subsites found by comparing with drug-binding data set (DBD) is recorded and normalized by the size of query site and defined as the score of druggability. The bottom panel: identification of the most druggable microenvironments. DrugFEATURE searches for the most druggable microenvironment by counting the frequency of a microenvironment matched in druggable subsites (red and black spheres).
Results
Computational predicted druggability correlates with the NMR-based screening
The NMR data set derived from the original publication by Hajduk et al. 16 consists of 10 druggable and 14 undruggable sites, where “druggable” is defined as having a known high-affinity (Kd < 300 nmol/l), nonpeptide, noncovalent inhibitor. Hajduk et al. observed a high correlation between the experimental NMR hit rate and the ability to bind drug-like small molecules with high affinity. They suggested that an NMR screen of a fragment library can be used as a reliable indicator of druggability of a given protein. In our tests, DrugFEATURE's estimates correlate well (R2 = 0.47 for a linear regression) with the NMR-based hit rate (the probability of randomly obtaining an R2 higher than 0.47 is 4 × 10⁻⁴; see Supplementary Figure S1). Using a score cutoff of 1.9, DrugFEATURE identified all 10 druggable and 13 of the 14 the undruggable sites, with one false-positive prediction (Figure 2).
Figure 2.

DrugFEATURE's prediction correlates with experimental NMR-based hit rates. The NMR data set consists of 10 druggable and 14 undruggable sites of which NMR-based screen hit rates are available. Hajduk et al. observed a high correlation between the experimental NMR hit rate (x-axis) and the ability to bind drug-like small molecules with high affinity. Using a score cutoff of 1.9, DrugFEATURE (y-axis) identified all 10 druggable and 13 of the 14 the undruggable sites, with one false-positive prediction.
Computational predicted druggability correlates with drug discovery outcomes
The drug discovery data set derived from the original publication by Cheng et al. 7 contains sites for 24 druggable targets with marketed drugs and three undruggable targets. Figure 3 shows the discriminative power of DrugFEATURE on the drug discovery data set. Eighteen out of the 24 druggable targets have drugs that follow RO5. The druggability scores calculated by DrugFEATURE of these 18 targets, except HIV-1 protease, are higher than 1.9, with the highest scoring of 4.7. The other six druggable targets for which known drugs are exceptions of RO5 are difficult targets, and we analyzed them separately. They are neuraminidase, inosine monophosphate dehydrogenase, angiotensin-converting enzyme 1, the nucleotide sites of HIV reverse transcriptase, thrombin, and penicillin-binding protein. These drugs are highly polar and not passively absorbed. They often require administration as prodrugs or the use of active transporter mechanisms.7 The druggability scores of these targets are generally lower than 1.9, with the lowest scoring of 0.2. There are three undruggable targets that have been pursued extensively by multiple pharmaceutical companies with little success. The scores of these undruggable targets are all below the cutoff of 1.9. It is reassuring that the effective cutoff (1.9) derived from the NMR data set is useful on the drug discovery data set that is based on drug discovery outcomes. That is, DrugFEATURE associates computational predictions with experimental results and with drug discovery outcomes.
Figure 3.

DrugFEATURE prediction correlates with drug discovery outcomes. The drug discovery data set consists of 18 druggable (left vertical), 9 difficult targets, including 3 undruggable sites (right vertical), and 6 sites for prodrugs (middle vertical). Using the same score cutoff of 1.9 (Figure 2), DrugFEATURE identifies the 17 (out of 18) druggable sites, with one false-negative prediction. It also discriminates all three undruggable sites and five of the six sites for prodrugs, with one false-positive prediction.
An important issue for structure-based methods is the incompleteness of three-dimensional data. This particularly affects the analysis of ligand-binding sites where incomplete structures are often observed (missing domains, loops, and residues). Meanwhile, for a given protein, multiple conformations complexed with various ligands are often available in Protein Data Bank (PDB). We inspected the variability of druggability scores across different conformations of the targets in the drug discovery data set. In most cases, a low druggability score is caused by the incomplete structural information in the target sites. A higher score of druggability suggests that the pocket contains a larger number of druggable microenvironments. For this reason, we use the conformation that produces the highest druggability score when there are multiple crystallized conformations available. This maximizes the probability of recognizing a druggable site and reduces the likelihood of a false negative.
We note that careful inspection of structures is sometimes critical. For example, in Cheng et al.'s7 original publication, HIV integrase was considered a difficult target based on the difficulty in finding inhibitors over many attempts. The authors evaluated the druggability of HIV integrase by using a physics-based maximal affinity model suggesting that it was undruggable. However, the structure used in their evaluation was the core domain of HIV integrase (PDB identifier: 1QS4), missing the N- and C-terminal domains, and the loop (residue 141–143) involved in drug binding. In recent years, several effective HIV integrase inhibitor drugs, including raltegravir, have emerged. For our DrugFEATURE evaluation, we used PDB 3OYA, a full-length prototype foamy virus integrase that is very similar to HIV integrase.22 DrugFEATURE accurately ranked 3OYA as highly druggable (Figure 3). The original conformation of HIV integrase 1QS4 was scored as undruggable because it was an incomplete three-dimensional structure (see Supplementary Table S2).
Comparison with other state-of-the-art methods
Most methods to evaluate target druggability apply machine-learning algorithms on physics-based descriptors that characterize the geometry and physiochemical properties of drug-binding sites (e.g., volume, buriedness, and hydrophobicity). Four well-known methods are Cheng et al.'s MAPPOD,7 Sheridan's Drug-Like Density (DLID),14 Halgren's SiteMap,8 and Schmidtke's F-pocket.9
A critical aspect in evaluating these methods is the choice of data set. Druggable targets are evident by the existence of approved drugs. However, there is no reliable metric to conclusively prove lack of druggability. In Krasowski's data set, a target was defined as undruggable if its bound ligands do not follow RO5.10 In Schmidtke's data set, undruggable targets were classified by visual inspection.9 The most commonly used data set for assessment of druggability prediction methods is that provided by Cheng et al.7 In this data set, specific targets were classified as undruggable if extensive drug discovery efforts were directed over the years with no success. The original publications of DLID, SiteMap, and F-pocket report their performance on Cheng et al.'s data set.8,9,14
We compared the performance of DrugFEATURE to MAPPOD, F-pocket, SiteMap, and DLID using the drug discovery data set, which is derived from Cheng et al.'s original data set (Figure 4). It contains 17 druggable and 10 difficult targets (6 targets for prodrugs/transporters and 4 undruggable ones). We recognize that some of these sites might be classified differently by different methods, but we accept their classification based on drug discovery history, because the specific goal of evaluating druggability is to estimate the probability of finding an actual drug. Cheng et al.'s method MAPPOD shows the best performance (although on data that they used to calibrate their model), whereas DrugFEATURE shows better performance than F-pocket, SiteMap, and DLID and is comparable with MAPPOD.
Figure 4.

Performance of DrugFEATURE, MAPPOD, F-pocket, SiteMap, and DLID on the drug discovery data set (see Supplementary Table S2). The data set contains 17 druggable targets and 10 difficult targets (6 targets for prodrugs/transporters and 4 undruggable ones). In terms of discriminating druggable targets from difficult ones, Cheng's method MAPPOD shows the best performance (but on data used for calibration), whereas DrugFEATURE shows better performance than F-pocket, SiteMap, and DLID. AUC, area under the curve.
DrugFEATURE identifies specific druggable microenvironments that may associate with important drug chemical groups
DrugFEATURE does not evaluate the overall similarity between a query site and the known drug-binding sites. Instead, it looks for local similarity and identifies a set of most druggable microenvironments that combine to create potentially novel recognition units for particular chemical groups (Figure 1).
Figure 5 shows an example, DNA gyrase. A total of 23 microenvironments were defined within the binding site in DNA gyrase. DrugFEATURE compares the 23 microenvironments to those in drug-binding data set (DBD), searching for the mutual best-scoring microenvironment pairs (between the query and every drug-binding site) with high similarity. For each comparison, a group of microenvironments in the query site that match counterparts in one drug-binding site are labeled as a “druggable subsite.” The frequency of finding a druggable subsite in DNA gyrase is further normalized as its druggability score (4.56). For each of the 23 microenvironments, the frequency of its being labeled as a part of a druggable subsite is also recorded. Seven microenvironments are frequently (>10%) being labeled as a part of a druggable subsite, and these are the most druggable microenvironments in the query site. These seven microenvironments form two clusters in the binding site of DNA gyrase. Cluster 1 consists of four microenvironments that are centered at the functional centers of residues B77I (chain B residue 77 which is an isoleucine), B94Y, B117V, and B93I. Cluster 2 consists of three that are centered at B80D, A9A, and A10I. Interestingly, the two clusters of druggable microenvironments occupy only one side, instead of the entire pocket. These two clusters of druggable microenvironments may contain useful insights into structure-based drug discovery.
Figure 5.

DrugFEATURE identifies the most druggable microenvironments in DNA gyrase binding site. DrugFEATURE identified seven most druggable microenvironments that form two clusters in the binding site of DNA gyrase. The red cluster (cluster 1) consists of four microenvironments that are centered at the functional centers of residues B77I (chain B residue 77, which is an isoleucine), B94Y, B117V, and B93I. The blue one (cluster 2) consists of three that are centered at B80D, A9A, and A10I. The two clusters of druggable microenvironments occupy only one side, instead of the entire pocket. The 3D structure of DNA gyrase is complexed with novobiocin. The cluster 2 druggable microenvironments are near the benzamide group of novobiocin. The cluster 1 druggable microenvironments are near the sugar derivative l-noviose.
The three-dimensional structure of DNA gyrase is complexed with novobiocin. The cluster 2 druggable microenvironments are near the benzamide group of novobiocin. The cluster 1 druggable microenvironments are near the sugar derivative l-noviose. The most similar subset of microenvironments in other proteins bind: clorobiocin, methotrexate, nilotinib, imatinib, and nelfinavir. These six molecules are not globally similar, but they share a benzamide group. The l-noviose group is also found in clorobiocin. These chemical groups found in known drug-binding sites selected by DrugFEATURE may be useful for drug discovery, and we are pursuing this in separate work. Our goal is simply to identify the degree to which a product is druggable.
Druggable transcription factors
Transcription factors have structurally and functionally distinct domains, including nuclear-hormone receptor, dimerization, DNA binding, nuclear localization, and regulatory domains. The plethora of genomic alterations in cancer that directly involve transcription factors highlights the potential of transcription factors as anticancer drug targets.23,24 However, with the exception of drugs targeting transcription factors of the nuclear-hormone-receptor receptor family (tamoxifen targeting to estrogen receptor, alitretinoin to retinoic acid receptor α (RAR-α), and thiazolidinedione to peroxisome proliferator–activated receptor γ (PPAR-γ)), most transcription factors are considered undruggable by conventional drug discovery methods. We inspected 13 binding sites in 10 transcription factors and predicted 4 druggable sites (Table 1, data derived from ref. 24). Two druggable sites are in RAR-α and PPAR-γ, consistent with the observation that the nuclear-hormone-receptor receptor family is druggable.25 Surprisingly, the other two druggable sites are found in p53 and core DNA-binding factors (CBFs), described as follows.
Table 1. Predicted druggability of transcription factors involved in cancer-associated events.
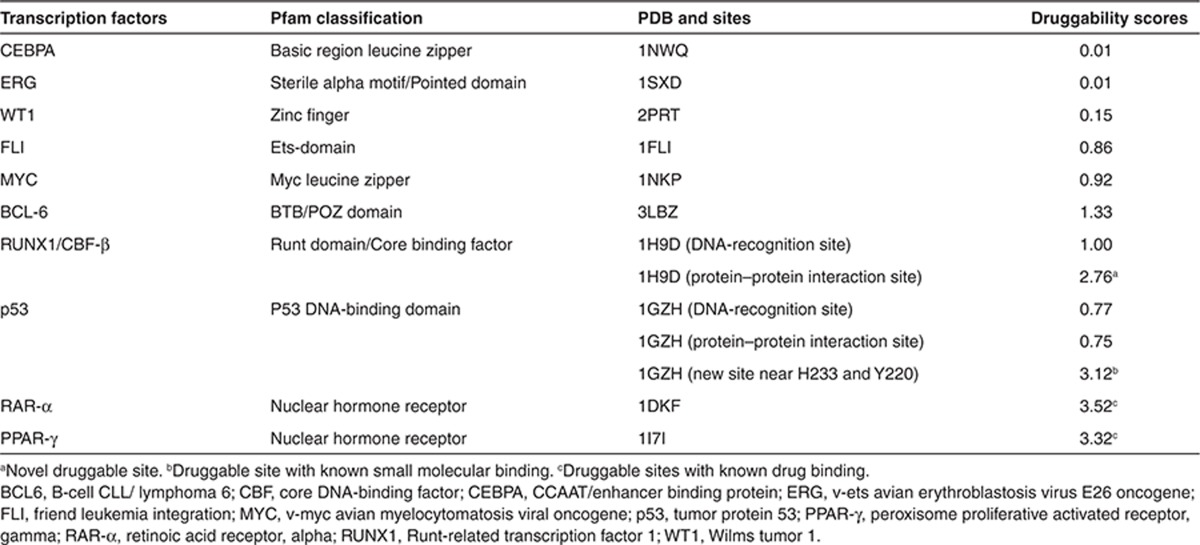
The DNA-binding domain of the tumor suppressor p53 is inactivated by mutations in about half of human cancers. A variety of structural perturbations have been found, including distortion of the DNA-binding surface and creation of large, water-accessible crevices or hydrophobic internal cavities with loss of thermodynamic stability.26,27 These mutations in p53 induce conformational changes that results in the loss of DNA-binding function. Structural analysis of these mutants has profound implications for therapeutic strategies that aim to rescue the function of p53 with small-molecule drugs that stabilize p53.26,28 We evaluated the druggability of three sites in p53: the DNA recognition site, the protein–protein interaction site (e.g., p53-BRCA1 interface), and a new site (near residues H233 and Y220). Our new predicted site is away from DNA recognition and protein–protein interaction sites (Table 1). Interestingly, a recent drug discovery effort by Wilcken et al.28 suggested that small molecules that consist of halogen-enriched fragments can be potential p53 stabilizers. Our predicted druggable site overlaps with the binding site of the halogen compounds, suggesting the opportunities in developing druggable small molecules to stabilize p53.
The CBFs are heterodimeric transcription factors consisting of a DNA-binding subunit (Runx1) and a non–DNA-binding CBF-β subunit. The CBF-β increases the affinity of the Runx1 for DNA. The DNA and CBF-β interacting interfaces are on opposite sides of the Runt domain.29,30 Runx1 is one of the most common targets for mutations in human leukemia, which generally causes impaired differentiation, decreased apoptosis, and growth arrest. Mutations in Runx1 result in the loss of DNA-binding function due to its unstable conformation. Some disease-related mutations affect DNA contacts, and many observed mutations destabilize the overall fold of Runx1 presumably by affecting residues in the hydrophobic core of the structure.29,31 Thus, like p53, small-molecule binding that stabilizes CBF complex may recover its DNA binding. We evaluated the druggability of two sites in CBF and predicted that the interacting site between Runx1 and CBF-β is druggable (Table 1 and Figure 6). Small-molecule drugs or other molecular binding to this site have not been reported. Our discovery may lead to a new strategy for anticancer therapies.
Figure 6.

DrugFEATURE evaluated two sites in RUNX1/CBF-β complex (1H9D): the DNA-recognition site (yellow) has a low druggability score (1.00) and the protein–protein interacting site (blue) between RUNX1 and CBF-β is highly druggable (score 2.76). Druggable microenvironments (blue spheres in the right panel) are centered on the functional centers in chain B residue 53E and chain A residue 153F, 121T, 120A, 117 L, and 116E. CBF, core DNA-binding factor.
Discussion
Drug discovery is complex and difficult, and drug action is much more than binding affinity. DrugFEATURE is a simple and fast procedure that can evaluate druggability computationally. It provides an estimate of the difficulty of targeting a particular molecule and can highlight problematic microenvironments that are not seen in the database of pockets associated with successful drug binding.
The PDB has ~2,000 target drug cocrystals that together provide a rich database of positive examples of druggability; these examples help increase the accuracy of data-driven methods like DrugFEATURE. Given a target protein, DrugFEATURE extracts druggable features or subsites by recognizing microenvironments that are similar to those in known drug-binding sites. The frequency of these subsites is used to estimate druggability of the given target. The druggable microenvironments can also be associated with chemical groups (in known drugs) they help recognize. We also find that hydrophobic microenvironments are preferred in druggable sites, and polarity may be an important factor for drug binding (see Supplementary Figure S2).
DrugFEATURE's predictions correlate well with both experimental results and drug discovery outcomes. We have not evaluated whether the DrugFEATURE score correlates with predicted affinity (because of limited availability of data), but there are reasons to believe that the presence of many high-scoring microenvironments may confer high affinity.
By quantifying the druggability of particular genes in a disease-associated network, DrugFEATURE can be used systematically to estimate the potential of drug and drug-like molecules to modulate the network. It may also assist in developing therapeutic strategies that are more likely to be successful.32 Transcription factors are among the most intriguing targets for treating cancer, yet they (as a group) are considered difficult targets. DrugFEATURE is able to quantify the druggability of individual transcription factors and identify most promising for early stages of drug discovery.
Methods
Data set
NMR data set. We collected 10 druggable and 13 undruggable sites with ligand-binding information published by Hajduk et al.16 They provide experimental assessment of these targets by NMR-based screening against a drug-like fragment library (see Supplementary Table S1).
Drug discovery data set. Based on the data from Cheng et al.,7 we collected 63 sites representing 27 pharmaceutical targets, including 24 druggable targets with marketed drugs and three “undruggable” targets that have been pursued extensively by multiple pharmaceutical companies with little success. Six of the druggable targets have drugs that are highly polar and not passively absorbed and instead require administration as prodrugs or the use of active transporter mechanisms (see Supplementary Table S2).
Drug-binding data set. We downloaded the list of small-molecule drugs from DrugBank.33 Only drugs labeled “approved” or “approved; investigational” were collected. Drugs labeled “nutraceuticals” were removed. We mapped these drugs to the PDB34 by their “InChIKey”, “name”, and “synonym.” Only high-resolution structures were kept for analysis (resolution better than 2.5 Å), yielding 984 high-quality structures representing binding sites of 284 distinctive drugs (see Supplementary Table S3).
Method of DrugFEATURE
Figure 1 shows steps of DrugFEATURE. A detailed description can be found in Supplementary Material. DrugFEATURE code is available at https://simtk.org/home/drugfeature.
Define and represent a binding site. For sites with known ligand binding, the binding sites were defined by protein residues, for which heavy atoms are within 6 Å of the ligand molecules. For sites without known ligand binding, we use the published patch-searching program, CONCAVITY,35 to define sites.
A defined site (a set of residues) is represented by describing the physiochemical and structural environments surrounded around each residue, referred as FEATURE microenvironment. For each residue in a site, we choose a central functional atom and calculate the FEATURE microenvironment around the center (see Supplementary Table S4: 22 types of microenvironments centered on 20 residues types). Specifically, FEATURE system calculates a set of 80 physicochemical properties (see Supplementary Table S5) collected over six concentric spherical shells centered on the predefined functional center.
Identify druggable subsites. We previously reported a scoring system to calculate site similarities by matching microenvironments between two sites.36 DrugFEATURE makes use of the scoring system to compare binding sites. We assume that microenvironments with high similarity allow molecular recognition of important chemical groups in the ligands (e.g., adenine in ATP and flavin adenine dinucleotide).36 Between the defined 22 types of microenvironments, we defined 72 microenvironment pairs that we check for high similarity scores (see Supplementary Table S6).
Given a pair of FEATURE microenvironments from two different sites, we calculate the Tanimoto coefficient based on the presence/absence of similar properties. The score is normalized using background frequencies observations in a representative of ligand-binding sites.
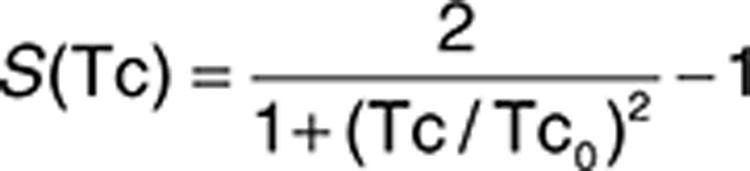 |
where Tc0 is the value at which S(Tc) is zero. The normalized value, S(Tc), measures the similarity between two microenvironments.
Between two binding sites, we match microenvironments by searching for the mutual best-scoring (S(Tc)) microenvironment pairs. A query site is described using multiple microenvironments. DrugFEATURE defines microenvironments for all sites in the DBD. It then compares microenvironments in the query to those in the DBD, searching for the mutual best-scoring microenvironment pairs (between the query and every drug-binding site) with high similarity by using a stringent cutoff (S(Tc) <−0.3). If a group of microenvironments in the query site can be matched to the counterparts of one drug-binding site in the DBD, this group of microenvironments is labeled a druggable subsite.
Calculate druggability and analyze druggable microenvironments. Given one query site, DrugFEATURE compares it with all sites in the DBD and identifies multiple druggable subsites. The frequency, or “hit ratio”, of druggable subsite is recorded and normalized by the size of query site. DrugFEATURE druggability is defined as: DrugFEATURE score = (number of druggable subsite from nonhomologous targets)/(numbers of microenvironments defined in the query site). (If the identity of structural alignment by MAMMOTH37 between the query and the hit is higher than 70%, we remove the hit.) We derive a score cutoff of 1.9 empirically based on DrugFEATURE's performance against the experimental NMR hit rate. A query target with DrugFEATURE score higher than 1.9 is considered druggable.
Once a highly ranked druggable target is identified, DrugFEATURE searches for the most druggable microenvironment by counting the frequency of a microenvironment matched in druggable subsites.
Conflict of Interest
The authors declared no conflicts of interest.
Author contributions
R.B.A. and T.L. wrote the manuscript and designed the research. T.L. performed the research, analyzed the data, and contributed new reagents/analytical tools.
Study Highlights
Acknowledgments
This work was supported by NIH GM102365, LM005652, and GM072970. We thank E. Capriotti for helpful discussion.
Supplementary Material
References
- Overington J.P., Al-Lazikani B., Hopkins A.L. How many drug targets are there. Nat. Rev. Drug Discov. 2006;5:993–996. doi: 10.1038/nrd2199. [DOI] [PubMed] [Google Scholar]
- Drews J. Genomic sciences and the medicine of tomorrow. Nat. Biotechnol. 1996;14:1516–1518. doi: 10.1038/nbt1196-1516. [DOI] [PubMed] [Google Scholar]
- Hopkins A.L., Groom C.R. The druggable genome. Nat. Rev. Drug Discov. 2002;1:727–730. doi: 10.1038/nrd892. [DOI] [PubMed] [Google Scholar]
- Rask-Andersen M., Almén M.S., Schiöth H.B. Trends in the exploitation of novel drug targets. Nat. Rev. Drug Discov. 2011;10:579–590. doi: 10.1038/nrd3478. [DOI] [PubMed] [Google Scholar]
- Sakharkar M.K., Sakharkar K.R. Targetability of human disease genes. Curr. Drug Discov. Technol. 2007;4:48–58. doi: 10.2174/157016307781115494. [DOI] [PubMed] [Google Scholar]
- Sakharkar M.K., Sakharkar K.R., Pervaiz S. Druggability of human disease genes. Int. J. Biochem. Cell Biol. 2007;39:1156–1164. doi: 10.1016/j.biocel.2007.02.018. [DOI] [PubMed] [Google Scholar]
- Cheng A.C., et al. Structure-based maximal affinity model predicts small-molecule druggability. Nat. Biotechnol. 2007;25:71–75. doi: 10.1038/nbt1273. [DOI] [PubMed] [Google Scholar]
- Halgren T.A. Identifying and characterizing binding sites and assessing druggability. J. Chem. Inf. Model. 2009;49:377–389. doi: 10.1021/ci800324m. [DOI] [PubMed] [Google Scholar]
- Schmidtke P., Barril X. Understanding and predicting druggability. A high-throughput method for detection of drug binding sites. J. Med. Chem. 2010;53:5858–5867. doi: 10.1021/jm100574m. [DOI] [PubMed] [Google Scholar]
- Krasowski A., Muthas D., Sarkar A., Schmitt S., Brenk R. DrugPred: a structure-based approach to predict protein druggability developed using an extensive nonredundant data set. J. Chem. Inf. Model. 2011;51:2829–2842. doi: 10.1021/ci200266d. [DOI] [PubMed] [Google Scholar]
- Volkamer A., Kuhn D., Grombacher T., Rippmann F., Rarey M. Combining global and local measures for structure-based druggability predictions. J. Chem. Inf. Model. 2012;52:360–372. doi: 10.1021/ci200454v. [DOI] [PubMed] [Google Scholar]
- Perola E., Herman L., Weiss J. Development of a rule-based method for the assessment of protein druggability. J. Chem. Inf. Model. 2012;52:1027–1038. doi: 10.1021/ci200613b. [DOI] [PubMed] [Google Scholar]
- Seco J., Luque F.J., Barril X. Binding site detection and druggability index from first principles. J. Med. Chem. 2009;52:2363–2371. doi: 10.1021/jm801385d. [DOI] [PubMed] [Google Scholar]
- Sheridan R.P., Maiorov V.N., Holloway M.K., Cornell W.D., Gao Y.D. Drug-like density: a method of quantifying the “bindability” of a protein target based on a very large set of pockets and drug-like ligands from the Protein Data Bank. J. Chem. Inf. Model. 2010;50:2029–2040. doi: 10.1021/ci100312t. [DOI] [PubMed] [Google Scholar]
- Desaphy J., Azdimousa K., Kellenberger E., Rognan D. Comparison and druggability prediction of protein-ligand binding sites from pharmacophore-annotated cavity shapes. J. Chem. Inf. Model. 2012;52:2287–2299. doi: 10.1021/ci300184x. [DOI] [PubMed] [Google Scholar]
- Hajduk P.J., Huth J.R., Tse C. Predicting protein druggability. Drug Discov. Today. 2005;10:1675–1682. doi: 10.1016/S1359-6446(05)03624-X. [DOI] [PubMed] [Google Scholar]
- Fauman E.B., Rai B.K., Huang E.S. Structure-based druggability assessment–identifying suitable targets for small molecule therapeutics. Curr. Opin. Chem. Biol. 2011;15:463–468. doi: 10.1016/j.cbpa.2011.05.020. [DOI] [PubMed] [Google Scholar]
- Zhang J., Yang P.L., Gray N.S. Targeting cancer with small molecule kinase inhibitors. Nat. Rev. Cancer. 2009;9:28–39. doi: 10.1038/nrc2559. [DOI] [PMC free article] [PubMed] [Google Scholar]
- Wei L., Altman R.B., Chang J.T. Using the radial distributions of physical features to compare amino acid environments and align amino acid sequences. Pac. Symp. Biocomput. 1997. pp. 465–476. [PubMed]
- Glazer D.S., Radmer R.J., Altman R.B. Improving structure-based function prediction using molecular dynamics. Structure. 2009;17:919–929. doi: 10.1016/j.str.2009.05.010. [DOI] [PMC free article] [PubMed] [Google Scholar]
- Liu T., Altman R.B. Prediction of calcium-binding sites by combining loop-modeling with machine learning. BMC Struct. Biol. 2009;9:72. doi: 10.1186/1472-6807-9-72. [DOI] [PMC free article] [PubMed] [Google Scholar]
- Hare S., Vos A.M., Clayton R.F., Thuring J.W., Cummings M.D., Cherepanov P. Molecular mechanisms of retroviral integrase inhibition and the evolution of viral resistance. Proc. Natl. Acad. Sci. USA. 2010;107:20057–20062. doi: 10.1073/pnas.1010246107. [DOI] [PMC free article] [PubMed] [Google Scholar]
- Karamouzis M.V., Papavassiliou A.G. Transcription factor networks as targets for therapeutic intervention of cancer: the breast cancer paradigm. Mol. Med. 2011;17:1133–1136. doi: 10.2119/molmed.2011.00315. [DOI] [PMC free article] [PubMed] [Google Scholar]
- Konstantinopoulos P.A., Papavassiliou A.G. Seeing the future of cancer-associated transcription factor drug targets. JAMA. 2011;305:2349–2350. doi: 10.1001/jama.2011.727. [DOI] [PubMed] [Google Scholar]
- Chang F., Jaber L.A., Berlie H.D., O'Connell M.B. Evolution of peroxisome proliferator-activated receptor agonists. Ann. Pharmacother. 2007;41:973–983. doi: 10.1345/aph.1K013. [DOI] [PubMed] [Google Scholar]
- Joerger A.C., Ang H.C., Fersht A.R. Structural basis for understanding oncogenic p53 mutations and designing rescue drugs. Proc. Natl. Acad. Sci. USA. 2006;103:15056–15061. doi: 10.1073/pnas.0607286103. [DOI] [PMC free article] [PubMed] [Google Scholar]
- Ang H.C., Joerger A.C., Mayer S., Fersht A.R. Effects of common cancer mutations on stability and DNA binding of full-length p53 compared with isolated core domains. J. Biol. Chem. 2006;281:21934–21941. doi: 10.1074/jbc.M604209200. [DOI] [PubMed] [Google Scholar]
- Wilcken R., et al. Halogen-enriched fragment libraries as leads for drug rescue of mutant p53. J. Am. Chem. Soc. 2012;134:6810–6818. doi: 10.1021/ja301056a. [DOI] [PMC free article] [PubMed] [Google Scholar]
- Mangan J.K., Speck N.A. RUNX1 mutations in clonal myeloid disorders: from conventional cytogenetics to next generation sequencing, a story 40 years in the making. Crit. Rev. Oncog. 2011;16:77–91. doi: 10.1615/critrevoncog.v16.i1-2.80. [DOI] [PMC free article] [PubMed] [Google Scholar]
- Bravo J., Li Z., Speck N.A., Warren A.J. The leukemia-associated AML1 (Runx1)–CBF beta complex functions as a DNA-induced molecular clamp. Nat. Struct. Biol. 2001;8:371–378. doi: 10.1038/86264. [DOI] [PubMed] [Google Scholar]
- Yan J., Liu Y., Lukasik S.M., Speck N.A., Bushweller J.H. CBFbeta allosterically regulates the Runx1 Runt domain via a dynamic conformational equilibrium. Nat. Struct. Mol. Biol. 2004;11:901–906. doi: 10.1038/nsmb819. [DOI] [PubMed] [Google Scholar]
- Darrell R, et al. NIH; Bethesda, MD; 2011. Quantitative and systems pharmacology in the post-genomic era: new approaches to discovering drugs and understanding therapeutic mechanisms. An NIH White Paper by the QSP Workshop Group. [Google Scholar]
- Knox C., et al. DrugBank 3.0: a comprehensive resource for ‘omics' research on drugs. Nucleic Acids Res. 2011;39:D1035–D1041. doi: 10.1093/nar/gkq1126. [DOI] [PMC free article] [PubMed] [Google Scholar]
- Bernstein F.C., et al. The Protein Data Bank: a computer-based archival file for macromolecular structures. Arch. Biochem. Biophys. 1978;185:584–591. doi: 10.1016/0003-9861(78)90204-7. [DOI] [PubMed] [Google Scholar]
- Capra J.A., Laskowski R.A., Thornton J.M., Singh M., Funkhouser T.A. Predicting protein ligand binding sites by combining evolutionary sequence conservation and 3D structure. PLoS Comput. Biol. 2009;5:e1000585. doi: 10.1371/journal.pcbi.1000585. [DOI] [PMC free article] [PubMed] [Google Scholar]
- Liu T., Altman R.B. Using multiple microenvironments to find similar ligand-binding sites: application to kinase inhibitor binding. PLoS Comput. Biol. 2011;7:e1002326. doi: 10.1371/journal.pcbi.1002326. [DOI] [PMC free article] [PubMed] [Google Scholar]
- Ortiz A.R., Strauss C.E., Olmea O. MAMMOTH (matching molecular models obtained from theory): an automated method for model comparison. Protein Sci. 2002;11:2606–2621. doi: 10.1110/ps.0215902. [DOI] [PMC free article] [PubMed] [Google Scholar]
Associated Data
This section collects any data citations, data availability statements, or supplementary materials included in this article.