

Abstract
A unified approach to optimize multidrug chemotherapy using a pharmacokinetic (PK)/enhanced pharmacodynamic model was developed using the vascular endothelial growth factor receptor (VEGFR) signaling system. The base VEGFR network model, characterized by ligand–receptor interactions, enzyme recruitment (Grb2-Sos, phospholipase C γ (PLCγ), and phosphoinositide-3 kinase (PI3K)), and downstream mitogen-activated protein kinase and Akt cascade activation, was linked to a sunitinib (VEGFR inhibitor) PK model and underwent Sobol sensitivity analysis that revealed potential sunitinib-enhancing mechanisms. Drugs targeting these mechanisms (a VEGF inhibitor, a PI3K inhibitor, a PLCγ inhibitor, and a mitogen-activated protein kinase inhibitor) and sunitinib were input to optimization-based control analyses to design multidrug regimens that maintained 80% pERK and pAkt inhibition for 28 days while minimizing drug dose. The resultant combination regimens contained both continuous and discontinuous schedules, mostly at low doses, and were altered by oncogenic mutations. This pipeline of computational analyses demonstrates how model-based methods can capture the complexities of drug action, tailor cancer chemotherapy, and empower personalized medicine.
Recognition that cancer is as varied as the number of patients has spawned new strategies to personalized therapy that have been mostly defined by genomic analyses to select effective chemotherapy.1 Although this strategy may be an advance, such genomic-based drug therapies necessarily rely on a static view of drug action, which in reality is a dynamic, time- and drug concentration–dependent network of biochemical reactions. This dynamic network of drug action, while underpinned by genomic variables, supports a protein-centric approach to personalize chemotherapy. Pharmacodynamics (PDs) is vested in the use of protein-based models but typically relies only on limited measurements of drug target inhibition and downstream effectors or biomarkers. This traditional approach to building PD models is well poised to broaden its scope to provide a systems pharmacological view of drug action that has been referred to as enhanced PD (ePD) modeling.2 How these models are applied to chemotherapy is the subject of the current investigation.
Traditional pharmacokinetic (PK)/PD models have been extensively applied to drug research throughout the preclinical and clinical phases,3 and there have been excellent examples of models that might be considered precursors of ePD models.4,5 Important advances in systems-based modeling of cell signaling networks have been accomplished, including those relevant to cancer, and recent efforts indicate the potential of systems pharmacology to characterize drug action on a network scale.6,7,8,9,10 The current investigation combines bottom-up ePD models with top-down PK models with emphasis on their translational importance to multidrug chemotherapy.
We focused on the vascular endothelial growth factor receptor (VEGFR2) pathway since it is critical to tumor angiogenesis—a key contributor to tumor expansion and metastasis—and offers multiple targets for therapeutic intervention.11,12 VEGFR2, also known as flk-1/kinase insert domain receptor (VEGFR), is activated upon binding to VEGF-A (VEGF), leading to the activation of extracellular signal-regulated kinase (ERK) and Akt, and subsequently to the proliferation and survival of not only endothelial cells but also many other cell types. From a base VEGFR biochemical reaction network and associated PK/ePD models, we applied a series of computational methods—Sobol sensitivity analysis and optimization-based control—that led to tailored multidrug chemotherapy regimens. This proposed sequence of computational analyses represents a tangible and flexible pipeline for using PK/ePD models to empower personalized medicine.
Results
The goal of the current paper is to demonstrate a computational pipeline that progresses from a base VEGFR network model through PK/ePD models to optimization-based control methods to propose potentially effective chemotherapy regimens that could be tailored to patients with a particular genomic signature (Figure 1). Each of these steps is presented below.
Figure 1.

Flow chart of the protocol to implement pharmacokinetic/enhanced pharmacodynamic models to design multidrug combination chemotherapy. Dashed arrow indicates where specific data can be input to tailor the biochemical network.
Constructing a base VEGFR network model
A “base” biochemical network is proposed as a starting point for the development of a “personalized” PK/ePD model and can be constructed largely from existing knowledge about canonical signaling pathways and associated parameters. Since it does not require a large amount of primary data, it can facilitate more rapid exploration of signaling dynamics that could indicate the likelihood of target inhibition and assist in the design of laboratory studies for detailed parameter estimation and identifiability analyses (e.g., what proteins to measure and how often). Revision of a base biochemical network model into a personalized or tumor type–specific model requires specific data (i.e., genomic or proteomic) and then selection of particular drugs to allow a linked PK/ePD model to be formulated. This specific data could result in a change in the network topology (reactions) and/or parameters (initial protein abundances and kinetic rate constants).
The base VEGFR biochemical network (Figure 2) is similar to many receptor tyrosine kinase networks and consists of three main components: (i) ligand–receptor binding, dimerization, and autophosphorylation; (ii) membrane recruitment of key adaptors/enzymes (PI3K, phospholipase C γ (PLCγ), and Grb2-Sos) to the phosphorylated, ligand-bound receptor dimer; and (iii) signaling to and feedback from two main pathway end points, Akt and ERK. The base VEGFR network model consisted of 40 biochemical reactions and 77 parameters constructed based on chemical kinetics (see Supplementary Tables S1 and S2).11,13,14
Figure 2.

Reaction network of the vascular endothelial growth factor receptor (VEGFR) signaling model. Double-sided line-head arrows depict reversible binding reactions. Single-sided line-head arrows depict chemical transformation. Single arrow head toward the species to denotes synthesis. ϕ denotes degradation. Negative feedback is depicted with blue lines. The numbers correspond to the reactions shown in Supplementary Table S1. DAG, diacylglycerol; GDP, guanosine diphosphate; IP3, inositol triphosphate; MEK, methyl ethyl ketone; NF1, neurofibromatosis type 1; PDK, phosphoinositide-dependent kinase; PLCγ, phospholipase C γ; RKIP, raf kinase inhibitor protein.
The model includes synthesis of species which are irreversibly consumed via signal transduction, including VEGF, VEGFR, and PIP(4,5)2 (see Supplementary Table S1). The model accounts for ligand-induced VEGFR degradation.15 Upon ligand binding, VEGFR dimerizes, stimulating the intrinsic tyrosine kinase activity of the receptor, leading to receptor autophosphorylation. PI3K, PLCγ, and the growth factor receptor bound 2-son of sevenless (Grb2-Sos) complex are recruited to the plasma membrane by binding to VEGFR phosphotyrosines, and subsequently initiate signaling through a variety of interlinked pathways impinging on ERK and Akt. PI3K catalyzes the formation of PIP(3,4,5)3 from PIP(4,5)2 that is opposed by the phosphatase and tensin homolog (PTEN) (which is often deleted in several cancer types). Generation of PIP3 leads to the membrane recruitment of phosphoinositide-dependent kinase 1 and Akt, with subsequent Akt activation through phosphorylation.14 PLCγ catalyzes the formation of diacylglycerol and inositol triphosphate from PIP2.16 The canonical pathway of PLCγ signaling activates various protein kinase C isoforms via combinations of direct diacylglycerol binding and inositol triphosphate–mediated Ca2+ release.17 Active protein kinase C can phosphorylate and inactivate raf kinase inhibitor protein, an inhibitor of ERK pathway signaling that when unphosphorylated sequesters Raf.18,19 Diacylglycerol and inositol triphosphate also activate a class of guanine exchange factors called RasGRPs that activate Ras by facilitating its conversion to a guanosine triphosphate–bound form.18,20 Both RasGRP and Grb2-Sos contribute to the production of RasGTP (SOS is also a guanine exchange factor). This is opposed by GTPase activating proteins; a major GTPase activating protein that we consider here is neurofibromatosis type 1 (also commonly deleted in cancer).21 RasGTP recruits and activates Raf family kinases, which in turn activate MEK and finally ERK and RSK.22
Feedback inhibition is an important mechanism in determining the robustness and stability of signaling. Three negative feedback mechanisms were included in the model: ERK-mediated Raf inactivation,23,24 Akt-mediated PI3K downregulation,25 and Akt-induced decreased receptor tyrosine kinase synthesis rates.26
Parameter selection for the base VEGFR network model
After the base VEGFR network model was constructed, we sought a parameter set—kinetic constants and protein abundances that provided biologically plausible signaling behavior. Initial protein abundances, species synthesis/degradation rates, and other kinetic parameters were adopted from the literature (see Supplementary Tables S1 and S2).11,13,14 To evaluate whether this set of parameters provided biologically plausible signaling behavior, we simulated ligand-induced pERK and pAkt signaling dynamics in response to “strong” ligand stimulation (0.5 nmol/l VEGF).14 Previous nonquantitative western blot studies showed that pERK dynamics were sustained in response to VEGF stimulation over a 3-hour time course,27 which the model recapitulates (Figure 3a). This, of course, does not validate the chosen parameter set—there are surely many other parameter sets that also predict such sustained behavior—but rather provides confidence that this base model is capable of reproducing biologically reasonable behavior. It is generally not known how to guarantee parametric identifiability of such mechanistic signaling models. Despite this ubiquitous parametric uncertainty, key temporal outputs are typically robust to large changes in most parameters for this class of systems biology models, a property called “sloppiness” that, to some extent, mitigates the problem that unidentifiable parameters cause, with respect to reproducing biologically relevant behavior.28 Typical cell culture experiments to further constrain parameter values and reduce uncertainty, as well as motivate changes in model structure, involve monitoring dynamics of network species (e.g., pERK and pAkt) in response to various doses of ligand in the presence of drugs and biological manipulation (e.g., overexpression and knockdown of network protein).9 Translating these types of models to in vivo situations, which is critical for systems pharmacology applications, will certainly require similar types of perturbation experiments in live animals, which is typically not done but should be possible with multiplex measurement techniques such as microwestern arrays.29 Nonetheless, the results provided by global sensitivity analyses, which we use later, is robust to parameter uncertainty and further provides confidence in inferences drawn from the model despite parametric uncertainty.
Figure 3.

The kinetic profiles of the key designated outputs, pERK and pAkt, following (a) stimulation by the ligand (vascular endothelial growth factor (VEGF) 0.5 nmol/l) for 3 hours and (b) administration of a single 50-mg dose of sunitinib; expressed as a percentage from baseline.
Linking a PK model for sunitinb to the base VEGFR network model to create a PK/ePD model
The base VEGFR network model simulates signaling processes, but to understand drug effects, a PK model of sunitinib was linked to it. The PK model parameters and model-predicted sunitinib plasma concentrations are listed in Supplementary Table S4 and Figure S1, respectively. A single oral dose of sunitinib produced a maximum plasma concentration of 42 nmol/l that is within the range previously reported in patients.30 In the model, sunitinib binds to VEGFR and prevents its phosphorylation, consistent with its competitive mode of action (see Supplementary Table S3). A single 50-mg dose of sunitinib inhibited VEGFR phosphorylation by 27% and both pAkt and pERK by ~45% at their respective nadirs (Figure 3).
Global sensitivity analysis to identify potential drug targets
To formulate hypotheses as to what biochemical mechanisms have the greatest control over the sunitinib-induced responses, thereby suggesting drugs that may be suitable for customized chemotherapy regimens, we applied global Sobol sensitivity analysis.31,32 Global methods are preferred because they are robust to the inherent parameter uncertainty present in this class of models. Sobol sensitivity analysis quantitatively decomposes the total variance in outputs-of-interest into the contributions by individual parameters and the interactions between parameters. It functions by evaluating model outputs for a large number of different parameter sets. We focus on “total effects” which quantify the overall contribution of a particular parameter to the variance in an output-of-interest. The sum of total effects over all parameters for a particular output is 1; therefore, the closer to 1 a particular parameter's total effect is, the larger the contribution.
The outputs-of-interest for our model were the sunitinib-induced area between the baseline and effect curve (Figure 4a),33 for pERK and pAkt, as these represent biologically relevant signaling states that control proliferation, survival, and migration. The time-integrated response provided by the area between the baseline and effect curve is a measure of the overall drug effect. Figure 4b,c shows the most significant total effects (>0.05) for pAkt or pERK. The confidence intervals (indicated by error bars) for these significant total effects were small relative to the total effect itself, indicating that a sufficient number of parameter sets (~106) were evaluated to draw reliable conclusions from the analysis. For the pAkt output, seven parameters had large total effects with the rate constant for ligand–receptor complex dimerization (k2f) having the largest influence, supporting the use of a VEGFR dimerization inhibitor. Other important determinants of the area between the baseline and effect curve for pAkt involved those related to the PI3K-catalyzed PIP2 to PIP3 reaction (Km9, k8, k6f, and k6r) that supports the use of a PI3K inhibitor. In contrast to pAkt, there were a relatively large number of parameters (23) that had large total effects on the pERK output. Again, the rate constant for ligand–receptor complex dimerization had the greatest effect and attests to the importance of receptor activation. Examination of the many other parameters revealed other opportunities for target inhibition; specifically, rate constant k23 involved in Erk phosphorylation suggested the use of a MEK inhibitor (although a Raf inhibitor may be equally considered based on k21), and the rate constants involved in PLCγ-mediated PIP2 hydrolysis (Kmpg, kpg, k15f, k15r, and k4f) supported the use of a PLCγ inhibitor. Despite the importance of the rate for the ligand–receptor complex dimerization (k2f) for the tested outputs, no drug or antibody is routinely available that has definitive efficacy in phase III clinical trials, although ramucirumab—an antibody binding to the extracellular VEGF-binding domain of VEGFR—is furthest in development.34 Therefore, we instead choose bevacizumab, an antibody that binds and sequesters VEGF and is used clinically.
Figure 4.

Sobol sensitivity analyses. (a) A generic illustration of the area between the baseline and effect curve (ABEC), total-order sensitivity indices for (b) pAkt and (c) pERK for the most significant parameters; error bars indicate bootstrap confidence intervals.
In summary, the Sobol analysis was used to identify potential drug targets that led to the selection of the following drugs for subsequent analysis: (i) an antibody to sequester VEGF, bevacizumab;35 (ii) a PI3K inhibitor, BKM120;36 (iii) a MEK inhibitor, AZD6244;37 and (iv) a PLCγ inhibitor. The PK parameters for each drug are provided in Supplementary Table S4, and characteristic plasma concentration and PD profiles are given in Supplementary Figure S1.
Optimization-based control to design chemotherapy regimens
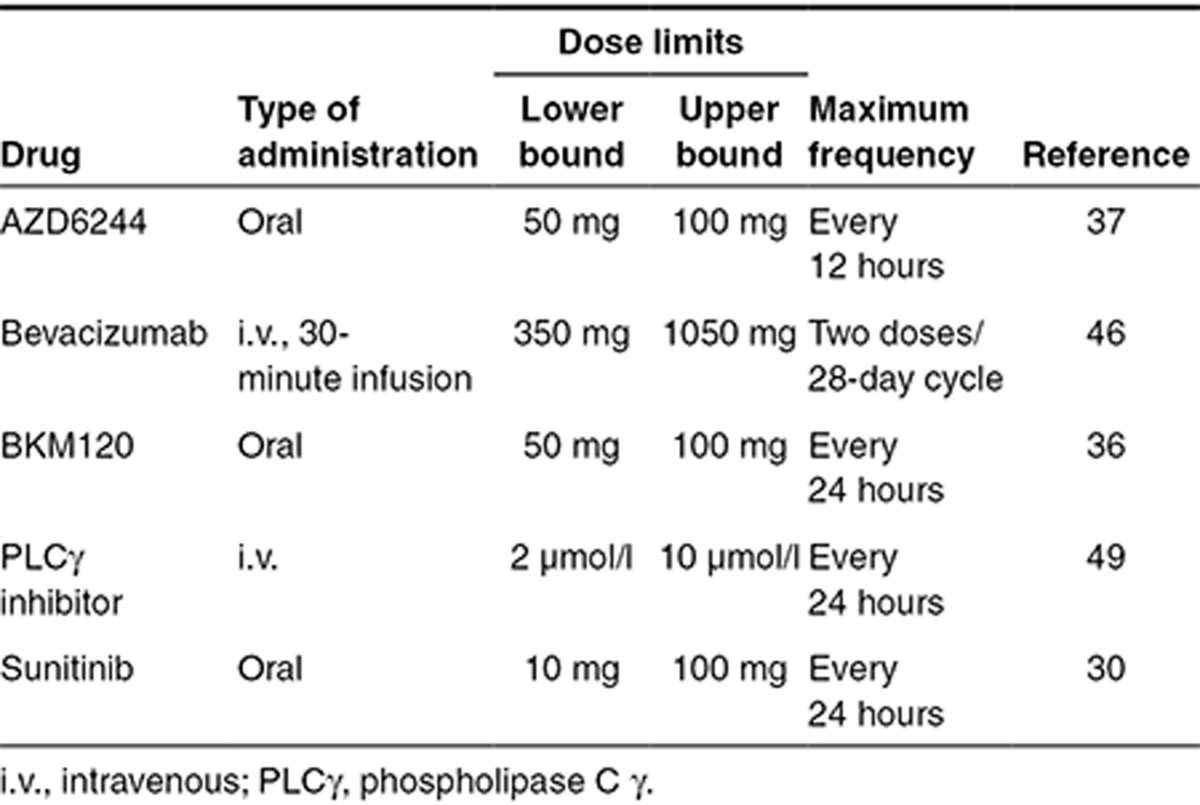
Given the potential drug choices above, an optimization-based control method was used to design effective multidrug, 28-day regimens. The absolute dosing criteria for the five considered drugs are given in Table 1. Because the absolute doses of all the drugs widely varied, a “relative dose” ((D–Dlb)/(Dub–Dlb)) was defined to visualize each drug on the same relative scale. When relative dose is 0, the drug is being dosed at its lower bound (Dlb), and when relative dose is 1, the drug is being dosed at its upper bound (Dub). For each day of the 28-day cycle, the controller determined whether to administer each drug or not, and if so, the magnitude of the dose by minimizing an objective function with a genetic algorithm. The objective function to minimize (see Eq. 1 in the Supplementary Methods) consisted of an efficacy and penalty term. Efficacy was defined as 80% inhibition of both pERK and pAkt at 24 hours. The criteria that both pERK and pAkt were inhibited by 80% at 24 hours were partially arbitrary—another percentage could have been chosen—yet is consistent with prevailing analyses that showed this degree of inhibition correlated to patient responses.38 The penalty function was based on dose intensity, which is simply a proxy for drug-induced toxicity. Here, again, this function could be modified to reflect specific toxicities, although the current dose intensity penalty is simple and sensitive to prevailing clinical guidelines on maximum doses. Since this was a nonlinear and stochastic optimization problem, several independent runs of the genetic algorithm were evaluated for coherence among the dosing regimens (see Supplementary Figures S2 and S4).
Table 1. Dosing criteria and bounds for optimization-based control.
The first optimization-based control analysis was completed with the assumption that sunitinib would be administered every day during the 28-day cycle. From a representative result (Figure 5a,b) of the multiple independent runs (see Supplementary Figure S2), a pattern of drug administration, being more continuous for some drugs and discontinuous for others, can be discerned and supports the robustness of the approach (Table 2). The MEK inhibitor AZD6244 is dosed more frequently and the PLCγ inhibitor less frequently. Only a single first day dose of the PI3K inhibitor BKM120 was used, whereas bevacizumab was not used at all. In addition, the relative doses of any drug were typically less than 0.5. The profiles of pERK and pAkt (Figure 5b) indicate variable patterns of signaling activity with peaks and troughs, particularly for pERK, yet all remain below the 80% inhibition criteria. When the requirement that sunitinib be administered daily was relaxed, the relative frequency of drug administration remained similar (see Supplementary Figure S3A,B). This indicates that sunitinib is an effective signaling inhibitor given this particular PK/ePD model.
Figure 5.

Optimization-based control. (a,c,e) Selected pharmacokinetic/enhanced pharmacodynamic model optimization-based control multidrug regimen expressed as relative dose over a 28-day treatment cycle and (b,d,f) the associated fractional response of pERK and pAkt for three cases: (a,b) sunitinib dosed every day, (c,d) base model with phosphoinositide-3 kinase activating mutation, and (e,f) base model with mutated PTEN.
Table 2. Optimization-based control of multidrug regimens in terms of frequency of administration in a 28-day therapeutic cycle for “patients” with different characteristics.
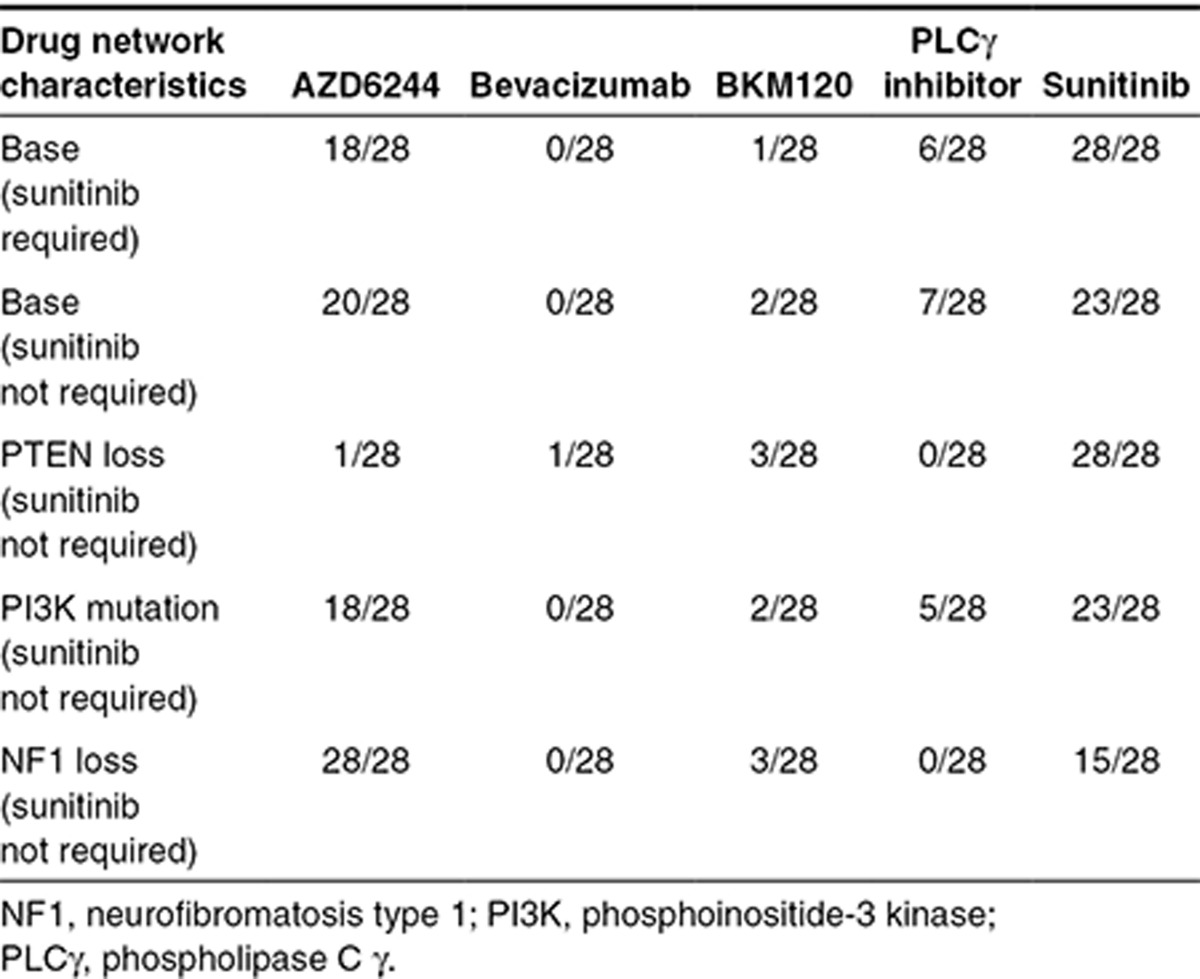
One of the main attractive features of the proposed approach is the ability to incorporate patient-specific mutation information. Therefore, we analyzed three additional cases of common cancer mutations—loss of neurofibromatosis type 1,21 activating PI3K mutation,39,40 and loss of PTEN.41 Loss of neurofibromatosis type 1 (100-fold underexpression) should increase flux through the ERK pathway. This was reflected by the controller proposing higher doses of AZD6244 (see Supplementary Figures S3C,D and S4A) given daily along with sunitinib; neither bevacizumab nor the PLCγ inhibitor were selected by the optimization-based controller (Table 2 and Supplementary Figures S3C,D and S4A). We modeled PI3K mutation by increasing its catalytic activity threefold.42 This PI3K mutation caused small changes to the dosing schedules as compared with the base model (Figure 5c,d and Supplementary Figure S4B). There was still infrequent dosing of the PLCγ inhibitor and surprisingly only one additional dose of the PI3K inhibitor, BKM120.
PTEN loss (100-fold underexpression) produced the most divergent multidrug regimen (Figure 5e,f and Supplementary Figure S4C). Day 1 included bevacizumab and BKM120 at the maximum allowable doses, sunitinib near the maximum dose, and a relatively high dose of AZD6244; only the PLCγ inhibitor was not needed. The pAkt profile was not controlled to 80% inhibition until day 3 that necessitated another dose of BKM120 on day 2; subsequent maintenance of 80% inhibition was achieved with mostly single agent sunitinib, although at higher than normal doses. Again, the PI3K inhibitor BKM120 is not preferred in this network despite mutations in the PI3K/PTEN circuit, illustrating potential pitfalls of directly equating genetic status with potential drugs.
Discussion
Burgeoning emphasis on personalized medicine necessitates a comprehensive analysis of how this may be achieved. The vast majority of approaches to personalized medicine reside in the genomic domain that seeks to establish genomic signatures for particular cancer types and patients that provide a prognostic course and chemotherapeutic options. Besides the disconnect between genomic attributes of a tumor and protein function that underlies drug action, genomic-based approaches to cancer therapy do not consider the PK of the drugs, and without linking PK and PD, they will be neither precise nor quantitative. Not only will questions as to the correct drug dose and frequency remain unanswered with genomic-based approaches, key drug–drug interactions may be neglected, including both antagonistic and synergistic mechanisms. The premise of the current investigation was to offer a pipeline of computational methods in the format of PK/ePD models that offers a systems pharmacological approach to personalized and precision medicine.
The linked PK/ePD modeling framework allows one to simulate how any species in the network model responds to drug treatments; however, such simulations do not specify drug combinations, their doses, or the frequency of their administration needed to achieve desired cellular responses. First, to narrow the list of potential drugs to consider in the multidimensional ePD model, a global sensitivity analysis of the combined PK/ePD model was performed to reveal the key biochemical mechanisms that have significant control over model output. By using global methods, the effects of nonidentifiable kinetic parameters on sensitivity analysis results are greatly mitigated.43,44 These key, sensitivity analysis–identified biochemical mechanisms can be matched to drugs known to perturb the identified mechanisms, yielding a ranked list of potential drugs. Next, given this list of drugs, an optimization-based controller—founded on a cost function that represents a balance between efficacy and toxicity—uses the PK/ePD model to simulate the effects of various drug administration regimens and combinations over a standard 28-day cycle of chemotherapy. The final output of the controller is a tailored drug treatment protocol—which drugs, their doses, and frequency of administration—that represents the best-identified balance between efficacy (PD control) and toxicity (here, dose intensity).
There are a number of interesting and unanticipated findings from the optimization-based control analyses. Whether using the base VEGFR ePD model or those modified by mutations, the frequency of drug administration was characterized by both near-continuous and discontinuous drug administrations. Sunitinib and AZD6244 were selected for essentially daily treatment, whereas BKM120 and the PLCγ inhibitor were discontinuous, with BKM120 typically only being dosed on the first day. Interestingly, it was recently found that such discontinuous strategies may help to prevent the onset of resistance of B rapidly accelerated fibrosarcoma (BRAF)-mutated melanomas to vemurafenib.45 Such choices are obviously dependent on model parameters, and although the optimization-based control was repeated multiple times to check for coherence of returned regimens, model parameters were those extracted from the literature and not calibrated to an extensive data set for a specific biological system. Certainly, specific data from tumors would assist in constraining parameter values, and inferences that all PI3K or PLCγ inhibitors would be required less frequently for inhibition of ERK and Akt end points would be premature.
Another interesting finding is that the relative drug doses were often <0.5 and close to the minimum in many cases—except for the PTEN mutant case—and suggests that controller-coupled kinetic models of drug action are judicious dispensers of medication. It should be appreciated that the optimization is constrained by lower and upper bounds for drug doses, and had we chosen different bounds and/or frequencies for dosing, the results could vary. The lower dose limit for sunitinib at 10 mg/day was lower than standard dosing that is closer to 40 mg/day, yet the control analyses in many cases choose doses near this lower limit. The input dose ranges for the other drugs were more conservative than the 10-fold dose range used for sunitinib, being 2-fold for AZD6244 and BKM120 and 3-fold for bevacizumab. This was consistent with the literature.30,36,37,46 Overall, the controller identified treatment regimens that were nonintuitive and supports a computational modeling approach to tailor chemotherapy for individual patients.
Systems pharmacology offers a vision for translational medicine based on quantitative models of drug action, yet how this could be done has not been standardized. The proposed pipeline (Figure 1)—from genomic data and a base biochemical network to a tailored multidrug treatment regimen—will need to be tested and validated with a multitude of experiments. This can be achieved in the domain of preclinical tumor models in which multiplex measurements can be obtained; however, the steps—parameter selection/optimization, Sobol sensitivity, and optimization-based control analysis—are reasonably straightforward and can be applied to large-scale models. As the field and application of systems pharmacology to drug development and therapy is rapidly emerging, it is hoped that the current investigation will stimulate future research on integrating quantitative network models into clinical medicine.
Methods
Constructing a base VEGFR network model. A biochemical network for the VEGFR pathway was constructed from the prevailing literatures.2,11,14,47,48 The ordinary differential equations were derived from the laws of mass action and enzyme kinetics. This base model consisted of 40 biochemical reactions and 77 parameters (see Supplementary Data and Tables S1 and S2).
Parameter selection for the base VEGFR network model. To simulate the response of the base VEGFR model to VEGF stimulation, we first equilibrated the model in the presence of no ligand synthesis (simulated serum starvation) and then set the VEGF concentration to a constant 0.5 nmol/l. The model simulations were carried out using MATLAB (The MathWorks, Natick, MA). Differential equations were integrated using the function ode15s, which is a variable-order solver based on the numerical differentiation formulas.
Linking a PK model for sunitinb to the base VEGFR network model to create a PK/ePD model. A population-based PK model for sunitinib that consisted of a two-compartment model with first-order oral absorption was used to link to the VEGFR network.30 The PK model of sunitinib generates plasma concentrations that are directly input to the ePD model. In this case, sunitinib, which is a competitive adenosine triphosphate inhibitor, can bind to the active site of the VEGFR regardless of its ligand binding or dimerization state and, thus, can form complexes with VR, V-VR, and 2-V-VR. The resulting complexes can be degraded but not phosphorylated (see Supplementary Table S3).
Global sensitivity analysis to identify potential drug targets. Sobol global sensitivity analysis was implemented via the MOEA framework (version 1.17) and was used to determine sensitivity of model outputs to changes in the parameters.31,43 First, all parameters' lower and upper bounds were set equal to 100-fold less than and greater than their base values with the exception of the synthesis and degradation rate constants (2-fold), kh (rxn 36 related to Akt feedback; 10-fold), and n value (varied between 1 and 6) (see Supplementary Tables S1 and S2). Second, 1,560,000 different parameter sets whose values varied between these lower and upper bounds were generated from cross-sampling by Saltelli's extension of Sobol's method with the MOEA framework. This large number of parameter sets ensured adequate confidence intervals were obtained for the total effects. Confidence intervals were calculated via bootstrapping with 1,000 resamples. For each parameter set, the PK/ePD model was integrated using CVODES on 256 CPUs in parallel on Minerva at Mount Sinai, and the generated pERK and pAkt profiles were used to calculate area between the baseline and effect curves using trapz in MATLAB. Total-order sensitivity indices and their confidence intervals for each parameter/output combination were computed with the MOEA framework.
Optimization-based control analysis. Each drug identified by the above steps was linked with the PK/ePD model based on its mechanism of action (see Supplementary Table S3). The objective function (see Supplementary Methods) was minimized each day using the MATLAB (The Mathworks) genetic algorithm function ga. Thus, a single 28-day regimen consists of implementing the genetic algorithm 28 times. On day 0, the initial conditions were taken as the natural steady state of the VEGF signaling model. Initial conditions for subsequent days were taken as the final conditions of the previous day, after drug administration. For ease of implementation, decision variables for whether to administer a drug or not were cast as continuous with bounds between 0.49 and 0.51, with 0.5 or greater corresponding to administration. Doses, as described above, were allowed to vary between lower and upper bounds (Table 1). Because the genetic algorithm is stochastic and the behavior of the objective function in the decision variable space is potentially nonlinear with multiple minima, we performed each series of 28 optimizations several times. In each run, we found that the main features of the returned optimal regimens were largely congruent (see Supplementary Figures S2 and S4).
Author Contributions
X.Z., M.R.B., and J.M.G. wrote the manuscript, designed the research, performed the research, and analyzed the data.
Conflict of Interest
The authors declared no conflicts of interest.
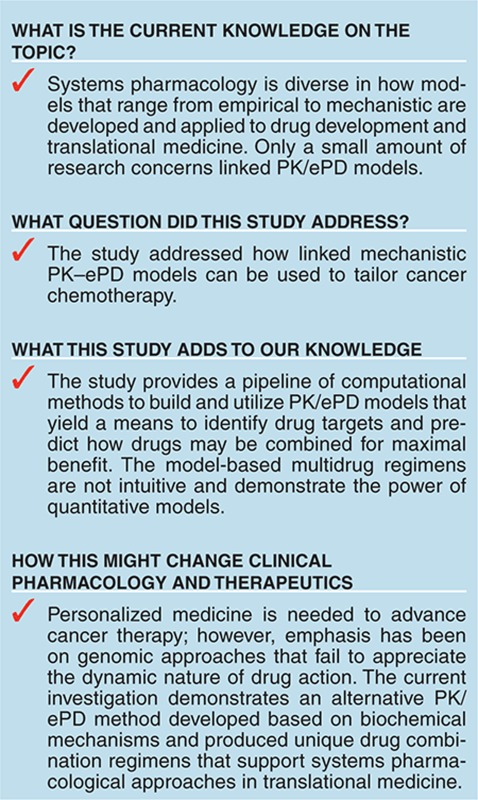
Study Highlights
Acknowledgments
This work was supported by NIH grants CA072937 and CA127963 (J.M.G.) and P50 GM071558 (M.R.B.—Systems Biology Center New York). Initial contributions by Maisum Begum and Eric A. Sobie, as well as the Minerva high performance computing resources at Mount Sinai, are gratefully acknowledged. Thanks to Jonathan Herman at Penn State University for helpful discussions and software for Sobol sensitivity analysis.
Supplementary Material
References
- Hansen J., Iyengar R. Computation as the mechanistic bridge between precision medicine and systems therapeutics. Clin. Pharmacol. Ther. 2013;93:117–128. doi: 10.1038/clpt.2012.199. [DOI] [PMC free article] [PubMed] [Google Scholar]
- Iyengar R., Zhao S., Chung S.W., Mager D.E., Gallo J.M. Merging systems biology with pharmacodynamics. Sci. Transl. Med. 2012;4:126ps7. doi: 10.1126/scitranslmed.3003563. [DOI] [PMC free article] [PubMed] [Google Scholar]
- Mager D.E., Jusko W.J. Development of translational pharmacokinetic-pharmacodynamic models. Clin. Pharmacol. Ther. 2008;83:909–912. doi: 10.1038/clpt.2008.52. [DOI] [PMC free article] [PubMed] [Google Scholar]
- Hector S., et al. Clinical application of a systems model of apoptosis execution for the prediction of colorectal cancer therapy responses and personalisation of therapy. Gut. 2012;61:725–733. doi: 10.1136/gutjnl-2011-300433. [DOI] [PubMed] [Google Scholar]
- Panetta J.C., Sparreboom A., Pui C.H., Relling M.V., Evans W.E. Modeling mechanisms of in vivo variability in methotrexate accumulation and folate pathway inhibition in acute lymphoblastic leukemia cells. PLoS Comput. Biol. 2010;6:e1001019. doi: 10.1371/journal.pcbi.1001019. [DOI] [PMC free article] [PubMed] [Google Scholar]
- van der Graaf P.H., Benson N. Systems pharmacology: bridging systems biology and pharmacokinetics-pharmacodynamics (PKPD) in drug discovery and development. Pharm. Res. 2011;28:1460–1464. doi: 10.1007/s11095-011-0467-9. [DOI] [PubMed] [Google Scholar]
- Sorger P.K., Allerheilligen S.R.B. Quantitative and systems pharmacology in the post-genomic era: new approaches to discovering drugs and understanding therapeutic mechanisms. An NIH White Paper by the QSP Workshop Group. 2011. pp. 1–48.
- Saez-Rodriguez J., Alexopoulos L.G., Zhang M., Morris M.K., Lauffenburger D.A., Sorger P.K. Comparing signaling networks between normal and transformed hepatocytes using discrete logical models. Cancer Res. 2011;71:5400–5411. doi: 10.1158/0008-5472.CAN-10-4453. [DOI] [PMC free article] [PubMed] [Google Scholar]
- Birtwistle M.R., Hatakeyama M., Yumoto N., Ogunnaike B.A., Hoek J.B., Kholodenko B.N. Ligand-dependent responses of the ErbB signaling network: experimental and modeling analyses. Mol. Syst. Biol. 2007;3:144. doi: 10.1038/msb4100188. [DOI] [PMC free article] [PubMed] [Google Scholar]
- Purvis J.E., Karhohs K.W., Mock C., Batchelor E., Loewer A., Lahav G. p53 dynamics control cell fate. Science. 2012;336:1440–1444. doi: 10.1126/science.1218351. [DOI] [PMC free article] [PubMed] [Google Scholar]
- Olsson A.K., Dimberg A., Kreuger J., Claesson-Welsh L. VEGF receptor signalling - in control of vascular function. Nat. Rev. Mol. Cell Biol. 2006;7:359–371. doi: 10.1038/nrm1911. [DOI] [PubMed] [Google Scholar]
- McMahon G. VEGF receptor signaling in tumor angiogenesis. Oncologist. 2000;5 suppl. 1:3–10. doi: 10.1634/theoncologist.5-suppl_1-3. [DOI] [PubMed] [Google Scholar]
- Yarden Y., Ullrich A. Growth factor receptor tyrosine kinases. Annu. Rev. Biochem. 1988;57:443–478. doi: 10.1146/annurev.bi.57.070188.002303. [DOI] [PubMed] [Google Scholar]
- Napione L., et al. Unraveling the influence of endothelial cell density on VEGF-A signaling. Blood. 2012;119:5599–5607. doi: 10.1182/blood-2011-11-390666. [DOI] [PubMed] [Google Scholar]
- Meyer R.D., Srinivasan S., Singh A.J., Mahoney J.E., Gharahassanlou K.R., Rahimi N. PEST motif serine and tyrosine phosphorylation controls vascular endothelial growth factor receptor 2 stability and downregulation. Mol. Cell. Biol. 2011;31:2010–2025. doi: 10.1128/MCB.01006-10. [DOI] [PMC free article] [PubMed] [Google Scholar]
- Berridge M.J. Inositol trisphosphate and diacylglycerol as second messengers. Biochem. J. 1984;220:345–360. doi: 10.1042/bj2200345. [DOI] [PMC free article] [PubMed] [Google Scholar]
- Nishizuka Y. Protein kinase C and lipid signaling for sustained cellular responses. FASEB J. 1995;9:484–496. [PubMed] [Google Scholar]
- Yeung K., et al. Mechanism of suppression of the Raf/MEK/extracellular signal-regulated kinase pathway by the raf kinase inhibitor protein. Mol. Cell. Biol. 2000;20:3079–3085. doi: 10.1128/mcb.20.9.3079-3085.2000. [DOI] [PMC free article] [PubMed] [Google Scholar]
- Granovsky A.E., et al. Raf kinase inhibitory protein function is regulated via a flexible pocket and novel phosphorylation-dependent mechanism. Mol. Cell. Biol. 2009;29:1306–1320. doi: 10.1128/MCB.01271-08. [DOI] [PMC free article] [PubMed] [Google Scholar]
- Ebinu J.O., Bottorff D.A., Chan E.Y., Stang S.L., Dunn R.J., Stone J.C. RasGRP, a Ras guanyl nucleotide- releasing protein with calcium- and diacylglycerol-binding motifs. Science. 1998;280:1082–1086. doi: 10.1126/science.280.5366.1082. [DOI] [PubMed] [Google Scholar]
- Side L., et al. Homozygous inactivation of the NF1 gene in bone marrow cells from children with neurofibromatosis type 1 and malignant myeloid disorders. N. Engl. J. Med. 1997;336:1713–1720. doi: 10.1056/NEJM199706123362404. [DOI] [PubMed] [Google Scholar]
- Kolch W. Meaningful relationships: the regulation of the Ras/Raf/MEK/ERK pathway by protein interactions. Biochem. J. 2000;351 Pt 2:289–305. [PMC free article] [PubMed] [Google Scholar]
- Sturm O.E., et al. The mammalian MAPK/ERK pathway exhibits properties of a negative feedback amplifier. Sci. Signal. 2010;3:ra90. doi: 10.1126/scisignal.2001212. [DOI] [PubMed] [Google Scholar]
- Fritsche-Guenther R., et al. Strong negative feedback from Erk to Raf confers robustness to MAPK signalling. Mol. Syst. Biol. 2011;7:489. doi: 10.1038/msb.2011.27. [DOI] [PMC free article] [PubMed] [Google Scholar]
- Rodrik-Outmezguine V.S., et al. mTOR kinase inhibition causes feedback-dependent biphasic regulation of AKT signaling. Cancer Discov. 2011;1:248–259. doi: 10.1158/2159-8290.CD-11-0085. [DOI] [PMC free article] [PubMed] [Google Scholar]
- Chandarlapaty S., et al. AKT inhibition relieves feedback suppression of receptor tyrosine kinase expression and activity. Cancer Cell. 2011;19:58–71. doi: 10.1016/j.ccr.2010.10.031. [DOI] [PMC free article] [PubMed] [Google Scholar]
- Shu X., Wu W., Mosteller R.D., Broek D. Sphingosine kinase mediates vascular endothelial growth factor-induced activation of ras and mitogen-activated protein kinases. Mol. Cell. Biol. 2002;22:7758–7768. doi: 10.1128/MCB.22.22.7758-7768.2002. [DOI] [PMC free article] [PubMed] [Google Scholar]
- Gutenkunst R.N., Waterfall J.J., Casey F.P., Brown K.S., Myers C.R., Sethna J.P. Universally sloppy parameter sensitivities in systems biology models. PLoS Comput. Biol. 2007;3:1871–1878. doi: 10.1371/journal.pcbi.0030189. [DOI] [PMC free article] [PubMed] [Google Scholar]
- Ciaccio M.F., Wagner J.P., Chuu C.P., Lauffenburger D.A., Jones R.B. Systems analysis of EGF receptor signaling dynamics with microwestern arrays. Nat. Methods. 2010;7:148–155. doi: 10.1038/nmeth.1418. [DOI] [PMC free article] [PubMed] [Google Scholar]
- Houk B.E., Bello C.L., Kang D., Amantea M. A population pharmacokinetic meta-analysis of sunitinib malate (SU11248) and its primary metabolite (SU12662) in healthy volunteers and oncology patients. Clin. Cancer Res. 2009;15:2497–2506. doi: 10.1158/1078-0432.CCR-08-1893. [DOI] [PubMed] [Google Scholar]
- Sobol I.M. Global sensitivity indices for nonlinear mathematical models and their Monte Carlo estimates. Math. Comput. Simulat. 2001;55:271–280. [Google Scholar]
- Saltelli A. Sensitivity analysis for importance assessment. Risk Anal. 2002;22:579–590. doi: 10.1111/0272-4332.00040. [DOI] [PubMed] [Google Scholar]
- Sharma A., Ebling W.F., Jusko W.J. Precursor-dependent indirect pharmacodynamic response model for tolerance and rebound phenomena. J. Pharm. Sci. 1998;87:1577–1584. doi: 10.1021/js980171q. [DOI] [PubMed] [Google Scholar]
- Clarke J.M., Hurwitz H.I. Targeted inhibition of VEGF receptor 2: an update on ramucirumab. Expert Opin. Biol. Ther. 2013;13:1187–1196. doi: 10.1517/14712598.2013.810717. [DOI] [PMC free article] [PubMed] [Google Scholar]
- Li J., Gupta M., Jin D., Xin Y., Visich J., Allison D.E. Characterization of the long-term pharmacokinetics of bevacizumab following last dose in patients with resected stage II and III carcinoma of the colon. Cancer Chemother. Pharmacol. 2013;71:575–580. doi: 10.1007/s00280-012-2031-7. [DOI] [PubMed] [Google Scholar]
- Bendell J.C., et al. Phase I, dose-escalation study of BKM120, an oral pan-Class I PI3K inhibitor, in patients with advanced solid tumors. J. Clin. Oncol. 2012;30:282–290. doi: 10.1200/JCO.2011.36.1360. [DOI] [PubMed] [Google Scholar]
- O'Neil B.H., et al. Phase II study of the mitogen-activated protein kinase ½ inhibitor selumetinib in patients with advanced hepatocellular carcinoma. J. Clin. Oncol. 2011;29:2350–2356. doi: 10.1200/JCO.2010.33.9432. [DOI] [PMC free article] [PubMed] [Google Scholar]
- Bollag G., et al. Clinical efficacy of a RAF inhibitor needs broad target blockade in BRAF-mutant melanoma. Nature. 2010;467:596–599. doi: 10.1038/nature09454. [DOI] [PMC free article] [PubMed] [Google Scholar]
- She Q.B., et al. Breast tumor cells with PI3K mutation or HER2 amplification are selectively addicted to Akt signaling. PLoS ONE. 2008;3:e3065. doi: 10.1371/journal.pone.0003065. [DOI] [PMC free article] [PubMed] [Google Scholar]
- Engelman J.A. Targeting PI3K signalling in cancer: opportunities, challenges and limitations. Nat. Rev. Cancer. 2009;9:550–562. doi: 10.1038/nrc2664. [DOI] [PubMed] [Google Scholar]
- Cully M., You H., Levine A.J., Mak T.W. Beyond PTEN mutations: the PI3K pathway as an integrator of multiple inputs during tumorigenesis. Nat. Rev. Cancer. 2006;6:184–192. doi: 10.1038/nrc1819. [DOI] [PubMed] [Google Scholar]
- Shayesteh L., et al. PIK3CA is implicated as an oncogene in ovarian cancer. Nat. Genet. 1999;21:99–102. doi: 10.1038/5042. [DOI] [PubMed] [Google Scholar]
- Lebedeva G., et al. Model-based global sensitivity analysis as applied to identification of anti-cancer drug targets and biomarkers of drug resistance in the ErbB2/3 network. Eur. J. Pharm. Sci. 2012;46:244–258. doi: 10.1016/j.ejps.2011.10.026. [DOI] [PMC free article] [PubMed] [Google Scholar]
- Yoon J., Deisboeck T.S. Investigating differential dynamics of the MAPK signaling cascade using a multi-parametric global sensitivity analysis. PLoS ONE. 2009;4:e4560. doi: 10.1371/journal.pone.0004560. [DOI] [PMC free article] [PubMed] [Google Scholar]
- Das Thakur M., et al. Modelling vemurafenib resistance in melanoma reveals a strategy to forestall drug resistance. Nature. 2013;494:251–255. doi: 10.1038/nature11814. [DOI] [PMC free article] [PubMed] [Google Scholar]
- Lu J.F., Bruno R., Eppler S., Novotny W., Lum B., Gaudreault J. Clinical pharmacokinetics of bevacizumab in patients with solid tumors. Cancer Chemother. Pharmacol. 2008;62:779–786. doi: 10.1007/s00280-007-0664-8. [DOI] [PubMed] [Google Scholar]
- Holmes K., Roberts O.L., Thomas A.M., Cross M.J. Vascular endothelial growth factor receptor-2: structure, function, intracellular signalling and therapeutic inhibition. Cell. Signal. 2007;19:2003–2012. doi: 10.1016/j.cellsig.2007.05.013. [DOI] [PubMed] [Google Scholar]
- von Kriegsheim A., et al. Cell fate decisions are specified by the dynamic ERK interactome. Nat. Cell Biol. 2009;11:1458–1464. doi: 10.1038/ncb1994. [DOI] [PMC free article] [PubMed] [Google Scholar]
- Hou C., Kirchner T., Singer M., Matheis M., Argentieri D., Cavender D. In vivo activity of a phospholipase C inhibitor, 1-(6-((17beta-3-methoxyestra-1,3,5(10)-trien-17-yl)amino)hexyl)-1H-pyrrole-2,5-dione (U73122), in acute and chronic inflammatory reactions. J. Pharmacol. Exp. Ther. 2004;309:697–704. doi: 10.1124/jpet.103.060574. [DOI] [PubMed] [Google Scholar]
Associated Data
This section collects any data citations, data availability statements, or supplementary materials included in this article.