Abstract
Evacetrapib is a novel cholesteryl ester transfer protein (CETP) inhibitor currently being evaluated in a late-stage cardiovascular outcome trial. Using population-based models, we analyzed evacetrapib concentration data along with high-density lipoprotein cholesterol (HDL-C) and low-density lipoprotein cholesterol (LDL-C) data from a 12-week study in dyslipidemic patients treated with evacetrapib alone or in combination with atorvastatin, simvastatin, or rosuvastatin. Evacetrapib pharmacokinetics were characterized using a two-compartment model with first-order absorption. Evacetrapib exposure increased in a less than dose-proportional manner, similar to other CETP inhibitors. No patient factors had a clinically relevant impact on evacetrapib pharmacokinetics. The relationships between evacetrapib exposure and HDL-C and LDL-C were characterized using Emax models. The theoretical maximal mean HDL-C increase and LDL-C decrease relative to baseline were 177 and 44.1%, respectively. HDL-C change from baseline was found to be negatively correlated with baseline HDL-C. A pharmacologically independent LDL-C reduction was found when evacetrapib was coadministered with statins.
Although treatment with statins has been shown to reduce major cardiovascular events, there exists a significant unmet medical need for the treatment of cardiovascular disease.1 The Framingham Study revealed that HDL-C was an important factor in cardiovascular disease, indicating that higher levels of HDL-C are associated with a lower risk of adverse cardiovascular events.2 Currently available therapies have modest impact on HDL-C levels or are not well tolerated, resulting in considerable interest in a new class of compounds that inhibit cholesteryl ester transfer protein (CETP) and are currently under investigation. CETP is a plasma glycoprotein that mediates the transfer of cholesteryl ester from HDL-C to Apo B-rich lipoproteins (i.e., low-density lipoprotein (LDL) and very low density lipoprotein (VLDL)) in exchange for their triglycerides. Inhibiting CETP results in increases in high-density lipoprotein cholesterol (HDL-C) and decreases in LDL-C.
Evacetrapib is a novel and potent reversible inhibitor of CETP currently being evaluated in a late-stage cardiovascular outcome trial. In multiple-dose studies in healthy volunteers, evacetrapib produced significant increases in HDL-C and decreases in LDL-C and was shown to be well tolerated at doses up to 600 mg (J.G. Suico, M.D. Wang, S. Friedrich, E.A. Cannady, C.S. Konkoy, G. Ruotolo et al., unpublished data). In a recently completed study in dyslipidemic patients, evacetrapib increased HDL-C by up to 129% and decreased LDL-C by up to 36% and was found to be safe and well tolerated when administered alone or in combination with statins.4 Importantly, evacetrapib did not cause any significant changes in mineralocorticoid levels or increases in either systolic or diastolic blood pressure, suggesting lack of the off-target effects potentially responsible for increased adverse cardiovascular events in patients treated with the CETP inhibitor torcetrapib in the ILLUMINATE study.3
The focus of the work presented here was to characterize the pharmacokinetics (PK) and pharmacokinetic/pharmacodynamic (PK/PD) relationships of evacetrapib in this phase II study. The primary goals of the analyses were to (i) understand the impact of patient characteristics on the PK and PD of evacetrapib; (ii) characterize the relationship between evacetrapib exposure and changes in HDL-C and LDL-C; and (iii) understand the impact of statin coadministration on the PK and PD of evacetrapib.
Results
A total of 398 patients were randomized to receive treatment, resulting in ~40 patients per treatment group. Demographic and baseline characteristics were all well balanced across treatment groups. Overall, the majority of patients were female (56.0%) and white (92.9%). The mean age was 58.3 years and ranged from 28 to 83 years. The mean body weight was 83.6 kg and ranged from 44 to 164 kg. The mean LDL-C, HDL-C, and triglycerides were 144.3, 55.1, and 139.8 mg/dl, respectively.
Evacetrapib PK
The population PK dataset included 1,629 evacetrapib concentrations from 226 patients. The number of samples per patient ranged from 1 to 9. A two-compartment model with first-order absorption best described evacetrapib PK, with parameter estimates for rate of oral absorption (Ka), apparent oral clearance (CL/F), apparent central volume (V2/F), apparent peripheral volume (V3/F), and apparent intercompartmental clearance (Q/F). Exponential interpatient variability terms were included for CL/F, V2/F, and Q/F. Residual variability was accounted for by a proportional error structure. The model was able to describe the observed data, and a sample visual predictive check is shown in Supplementary Figure S1. Log-likelihood profiling of all the model parameters and additional diagnostic plots (data not shown) all confirmed the acceptable performance of the final selected model.
The final parameter values for the final PK model are provided in Table 1. The PK parameters were estimated with good precision (low % standard error of estimation), and in particular the population estimate for oral clearance was estimated with a standard error of 4.57% and 95% confidence interval of 14.3–16.5 l/hour. Due to the sparse collection of evacetrapib concentration data at early time points following dosing, Ka could not be estimated with reasonable precision and the inability to estimate a value for Ka created model instability, so Ka was fixed to a value of 0.3 hour−1. Out of the range of values tested for Ka, the value of 0.3 hour−1 resulted in the best fit to the data based on the model objective function value. Sensitivity analyses also indicated that the estimates of CL/F were not affected by fixing the value of Ka.
Table 1. Parameter estimates for the final population PK model of evacetrapib.
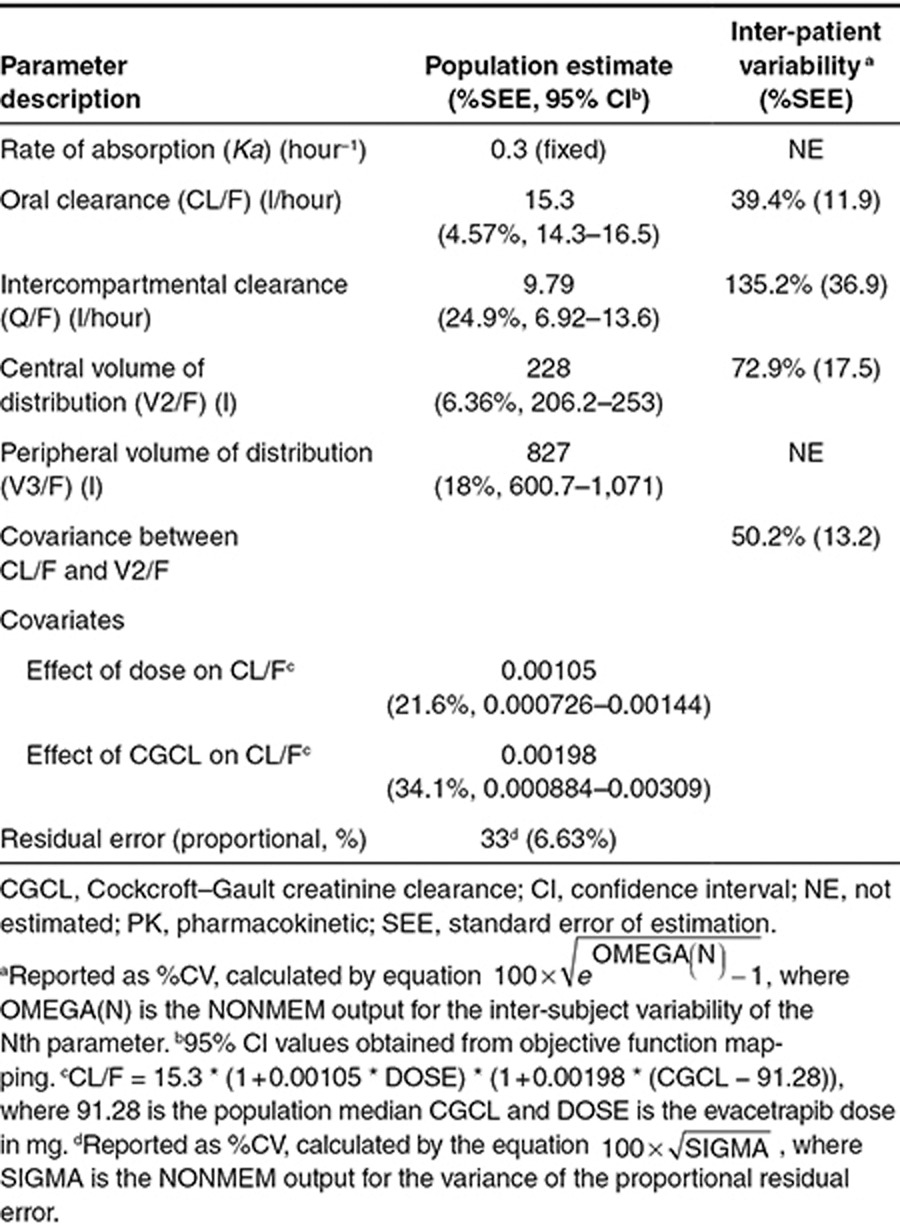
The only covariates found to have a statistically significant impact on the PK of evacetrapib were the dose of evacetrapib and Cockcroft–Gault creatinine clearance (CGCL), both impacting CL/F and no other parameters. The CL/F of evacetrapib increased with dose, with estimated population values of 13.1, 17.0, and 25.4 l/hour at doses of 30, 100, and 500 mg, respectively (Supplementary Figure S3). Evacetrapib CL/F tended to increase with CGCL, with the model-predicted population CL/F value 10% lower at 50 ml/minute than at 100 ml/minute (Supplementary Figure S4). Supplementary Figure S2 shows boxplots of the evacetrapib AUCτ,ss values that were calculated for each group that received evacetrapib. The geometric mean AUCτ,ss values in the 30, 100, and 500 mg evacetrapib monotherapy groups were 2,300, 5,900, and 19,700 ng·hour/ml, respectively. The geometric mean AUCτ,ss values in the atorvastatin, simvastatin, and rosuvastatin plus 100 mg evacetrapib groups were 5,500, 5,620, and 5,960 ng·hour/ml, respectively.
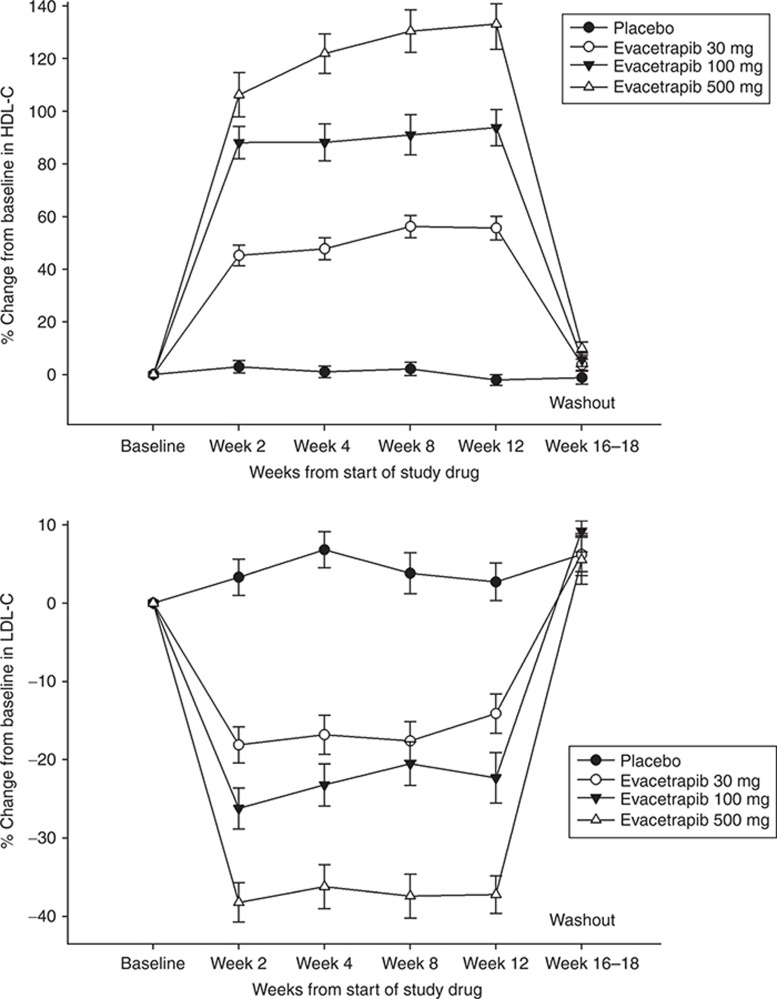
To evaluate if a complete washout of evacetrapib occurred after dosing was discontinued, the evacetrapib concentrations collected at the follow-up visit, which occurred 4–6 weeks after the last dose were examined. Of the patients who had data collected at this visit, 92% of patients (184 out of 201) across all dose groups had concentrations that were below the quantitation limit of the assay (<1 ng/ml). Of the patients that were above the quantitation limit, one patient had a concentration of 50.94 ng/ml and the remaining 16 patients had concentrations of less than 3 ng/ml. The patient that had the highest concentration was in the evacetrapib 100-mg monotherapy group. The washout of evacetrapib was further evaluated by examining HDL-C and LDL-C at the follow-up visit. As shown in Figure 1, HDL-C and LDL-C in the evacetrapib monotherapy groups had returned to levels similar to those of the placebo group at week 16–18. Similar data were observed in the groups administered evacetrapib plus atorvastatin, simvastatin, or rosuvastatin (data not shown).
Figure 1.
Observed mean/SD HDL-C (top) and LDL-C (bottom) percent change from baseline over time in the placebo and evacetrapib monotherapy groups. The observation at week 16–18 occurred 4–6 weeks after treatments were discontinued. HDL-C, high-density lipoprotein cholesterol; LDL-C, low-density lipoprotein cholesterol.
HDL-C model
The analysis dataset included 1,882 HDL-C observations from 391 patients. The analysis was conducted on the percent change from baseline HDL-C and included all the time points that were collected to allow the model to characterize the time course of the response. The final general form of the model used to analyze the relationship between evacetrapib area under the concentration–time curve (AUC) and percent change in HDL over time is shown as Eq. 1, with parameter definitions as described in the Methods section.
 |
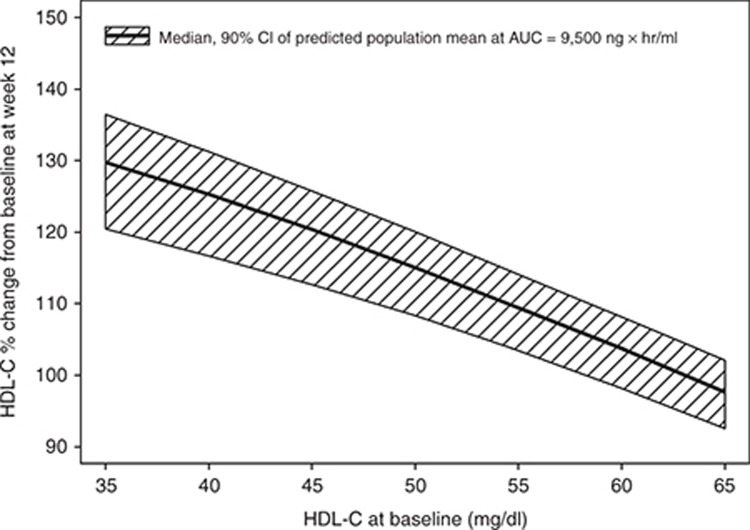
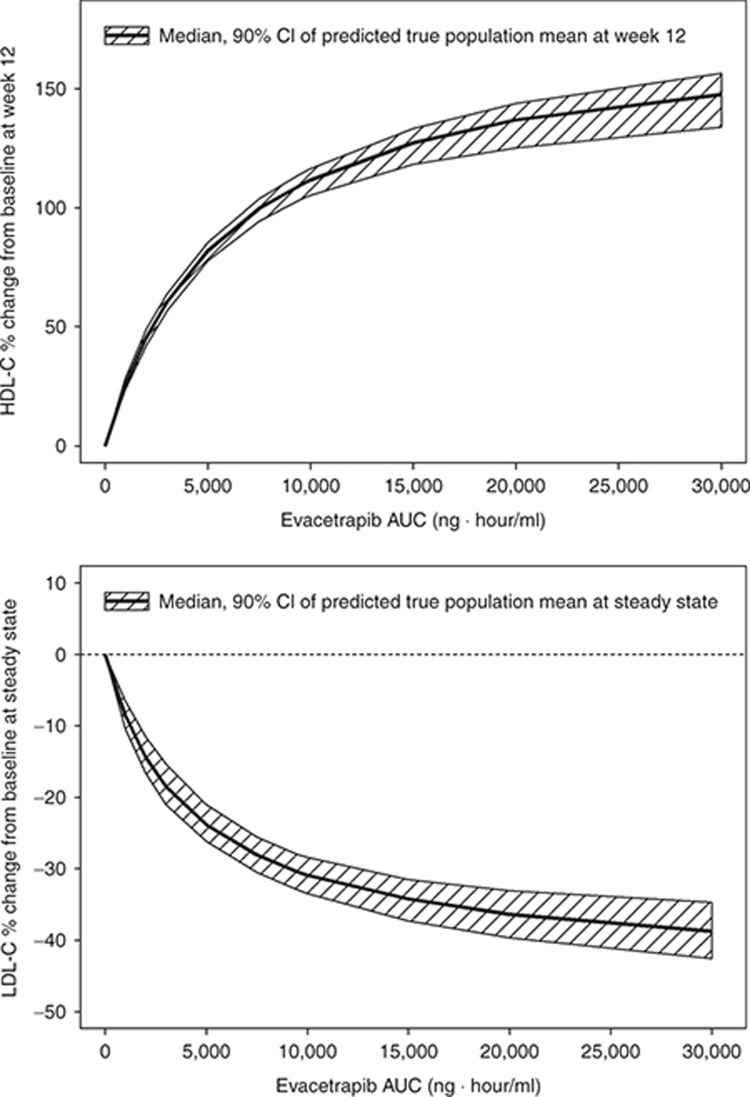
The final estimated parameter values are provided in Table 2. The model was able to describe the observed data, and a sample visual predictive check is shown in Supplementary Figure S5. The parameters were all estimated with good precision. The theoretical maximum effect of evacetrapib at steady state on HDL-C was 177% change from baseline, and the AUC that produced half of the maximum effect was 5,380 ng·hour/ml. The final model included additive between-subject variability on placebo effect (PLAC) and exponential between-subject variability on Emax and K. The residual error was accounted for using an additive error term. Including a population mean PLAC or statin effect (STAT) (see Eq. 4) did not significantly improve the model fit and were also poorly estimated, so these parameters were fixed to zero in the final model. In a preliminary base structural model where the placebo and STAT were included, the estimated values for PLAC and STAT were 0.420 (% standard error of estimation = 407) and 2.28 (% standard error of estimation = 83.3) percent change in HDL-C from baseline, respectively. Including the Hill coefficient (GAM) (see Eq. 4) in the model did not significantly improve the model fit, so GAM was fixed to one. The final model included the impact of baseline HDL-C on EAUC50, where patients with lower baseline HDL-C values had lower EAUC50 values. This results in a higher HDL-C increase at a given AUC value for patients with lower baseline HDL-C. No other covariates were found to be significant after including baseline HDL-C on EAUC50. The relationship between baseline HDL-C and HDL-C response at a fixed AUC of 9,500 ng·hour/ml is shown graphically in Figure 2. Figure 3 (top) shows the model projected relationship between evacetrapib AUC and the population mean HDL-C response after 12 weeks of treatment.
Table 2. Parameter estimates for the final population HDL-C model.
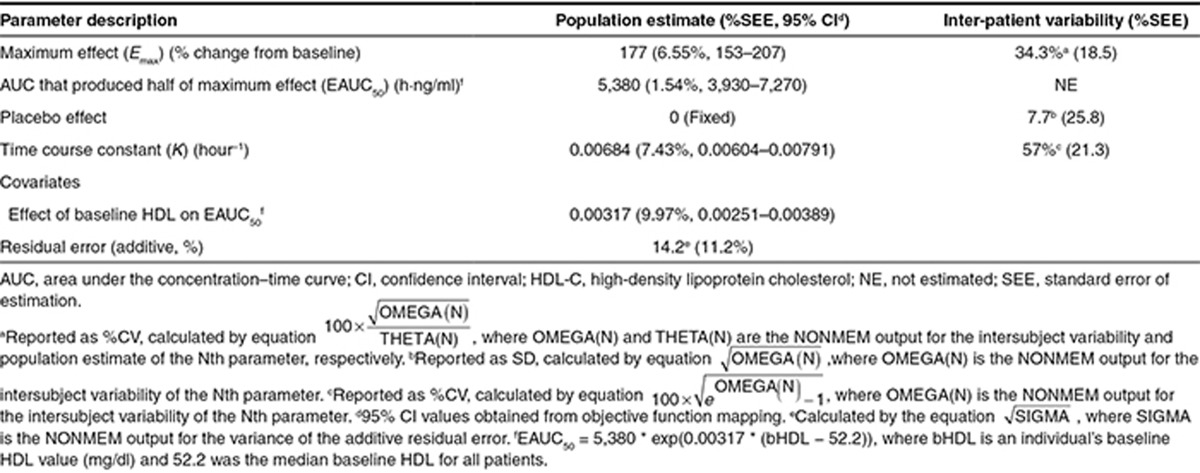
Figure 2.
Model projected relationship between baseline HDL-C and HDL-C change from baseline after 12 weeks of treatment at an evacetrapib AUC of 9,500 ng · hour/ml. Shaded area represents 90% confidence interval of model estimated true population mean. AUC, area under the concentration–time curve; HDL-C, high-density lipoprotein cholesterol.
Figure 3.
Model projected relationship between evacetrapib AUC and population mean HDL-C change from baseline after 12 weeks of treatment for either evacetrapib monotherapy or when added on top of statins (top). Shaded area represents 90% confidence interval of model estimated true population mean. Model projected relationship between evacetrapib AUC and population mean LDL-C change from baseline at steady state for either evacetrapib monotherapy or when added on top of statins (bottom). Shaded area represents 90% confidence interval of model estimated true population mean. AUC, area under the concentration–time curve; HDL-C, high-density lipoprotein cholesterol.
LDL-C model
The analysis dataset included 1,469 LDL-C observations from 388 patients. Exploratory analyses of the LDL-C data did not reveal a consistent increase or decrease in the LDL-C change between week 2 and week 12 across the treatment groups. In addition, analyses with models that included terms to characterize change in LDL-C over time were not able to estimate time-course parameters with acceptable precision. Since time was not a parameter in the model, the model assumes the LDL-C response is at steady state at all the observed time points after baseline. The final form of the model used to analyze the relationship between evacetrapib AUC and percent change in LDL-C is shown as Eqs. 2 and 3, with parameter definitions as described in the Methods section.
 |
 |
The estimated parameters for the final LDL-C model are provided in Table 3. The parameters were all estimated with good precision, and a sample visual predictive check is shown in Supplementary Figure S6. The theoretical maximum effect of evacetrapib on LDL-C was −44.1% change from baseline, and the evacetrapib AUC that produced half of the maximum effect was 4,230 ng·hour/ml. The model estimated statin LDL-C effect (STAT) was −38.7% change from baseline. The model did not detect any significant difference in the LDL-C response between the statins when they were tested individually. The model estimated a PD interaction coefficient (INTER) of −0.997, indicating that the LDL-C response of evacetrapib and the statins was pharmacologically independent since the value was very close to negative one and the confidence intervals included negative one.
Table 3. Parameter estimates for the final population LDL-C model.
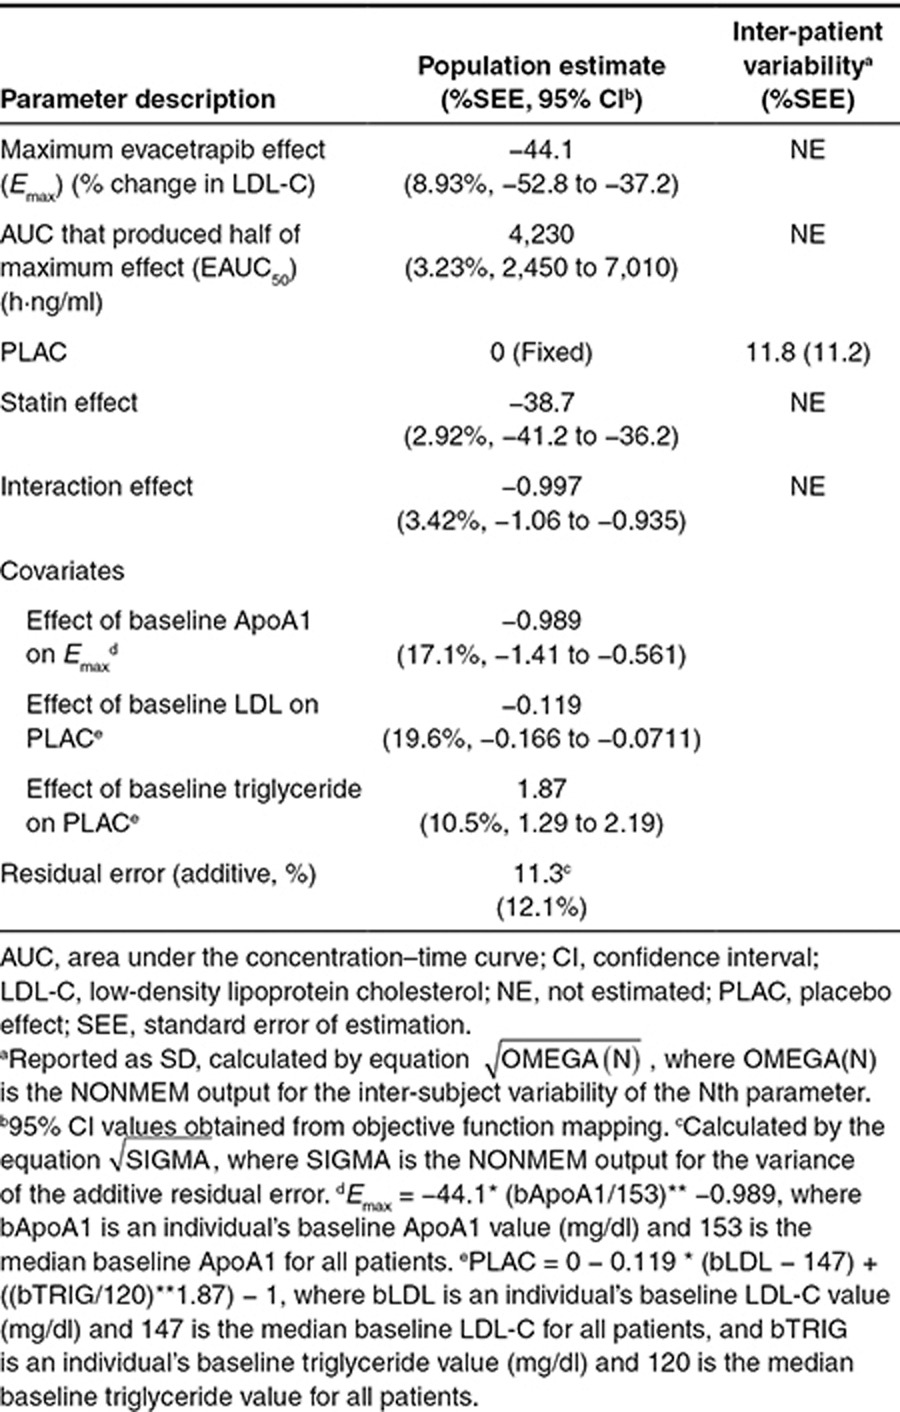
The final model included additive between-subject variability on PLAC. The residual error was accounted for using an additive error term. Including a population mean PLAC did not significantly improve the model fit, so this parameter was fixed to zero. In a preliminary base structural model where the PLAC was included, the estimated value for PLAC was 3.88 (% standard error of estimation = 45.6) percent change in LDL-C from baseline. Including the Hill coefficient (GAM) in the model did not significantly improve the model fit, so GAM was fixed to 1. The final model included the impact of baseline Apo A1 on Emax, where patients with lower baseline ApoA1 values had lower Emax values (greater reductions in LDL-C). The final model also included the impact of baseline LDL-C on PLAC, where patients with higher baseline LDL-C values had a lower PLAC value. The final model also included the impact of baseline triglycerides on PLAC, where patients with higher baseline triglycerides values had a higher PLAC value. Note that in the model the PLAC is included in all treatments, including the statin- and evacetrapib-treated groups. No other covariates were found to be significant. Figure 3 (bottom) shows the model projected relationship between evacetrapib AUC and the population mean LDL-C response at steady state. Since the model estimated that the evacetrapib and statin LDL-C PD effect was pharmacologically independent, this figure represents the LDL-C reduction projected if evacetrapib is administered as monotherapy or the additional LDL-C reduction achieved when evacetrapib is combined with statins.
Discussion
The PK, PD, and PK/PD relationships for evacetrapib have been studied in healthy subjects following multiple doses (J.G. Suico, M.D. Wang, S. Friedrich, E.A. Cannady, C.S. Konkoy, G. Ruotolo et al., unpublished data). These studies were able to characterize the basic PK and PD properties of evacetrapib and were used to support the design of this study in dyslipidemic patients. In healthy subjects, evacetrapib exposure was found to increase in a less than dose-proportional manner with respect to dose over the 10–600 mg dose range that was studied. In this study, less than dose-proportional increases in evacetrapib exposure were also observed, with CL/F approximately doubling from 13.1 l/hour at 30 mg to 25.4 l/hour at 500 mg. In the healthy subject studies, the observed terminal half-life did not appear to vary with dose, so the lack of dose-proportionality is thought to be the result of changes in extent of absorption rather than changes in rate of elimination. Less than dose-proportional increases in exposure also have been observed for the CETP inhibitor anacetrapib.5,6,7 These observations of less than dose-proportional increases in exposure for both evacetrapib and anacetrapib are consistent with the lipophilic properties of the molecules, which limit their solubility in the gastrointestinal tract and therefore the extent of their oral absorption.
Evacetrapib was also shown to have a modest increase in exposure when given with food in the single dose healthy subject study (data not shown). Relative to a 30-mg dose administered with a low-fat meal, AUC0–∞ was reduced by 38% and increased by 41% in the fasted state and after a high-fat meal, respectively. In this phase II study, patients were advised to take evacetrapib with a low-fat meal. Although detailed information about food consumption was not collected in this outpatient study, the overall between-subject variability in CL/F (39.4%) and residual error (33%) estimated with the population PK analysis were reasonably low, suggesting that any variation in the way patients took evacetrapib with respect to meal conditions did not result in excessive variability in exposure. The phase III formulation of anacetrapib when administered with low-fat or high-fat meals produced AUC values that were 2.2-fold and 7.5-fold higher,7 respectively, than when administered in the fasted state, suggesting that evacetrapib has a smaller food effect compared to anacetrapib.
The plasma concentrations of anacetrapib remain high for significant time periods following discontinuation of treatment.8 Twelve weeks after discontinuing treatment, anacetrapib concentrations remained at levels that were 40% of those observed during the treatment period. In this study, the concentrations of evacetrapib in 92% of patients were below detection 4–6 weeks after the last dose, which is consistent with the approximate 40-hour half-life observed for evacetrapib in the healthy subject studies. Consistent with the nearly complete washout of evacetrapib concentrations, HDL-C and LDL-C levels had returned to similar levels as the placebo group 4–6 weeks after the last dose of evacetrapib. The difference in the washout of anacetrapib vs. evacetrapib following discontinuation of treatment suggests that the distribution and/or elimination characteristics of these two CETP inhibitors are fundamentally different.
Evacetrapib clearance tended to increase with CGCL, with the model-predicted mean CL/F value 10% lower at a CGCL of 50 ml/minute than at 100 ml/minute. This small change in clearance is unlikely to be clinically relevant; however, since there were limited patients with CGCL values of <50 ml/minute (see Supplementary Figure S4), this relationship cannot be used to predict the impact of moderate or severe renal impairment on evacetrapib clearance, which would require further evaluation in patients with renal insufficiency. A recently completed 14C study in humans found that 2.3% of an orally administered dose was recovered in urine (data not shown) with the remainder excreted in feces; therefore, it is unlikely that elimination of evacetrapib will be significantly impacted by renal insufficiency. Other than the impact of dose described above and the impact of CGCL, no other patient or study factors were found to significantly impact the PK of evacetrapib. In consideration of the anticipated target population for evacetrapib, it is important to note that age, body weight and administration of atorvastatin, simvastatin, or rosuvastatin were not found to have a significant impact on evacetrapib clearance. In separate studies, evacetrapib was found to be highly protein bound (>99%) and metabolized primarily by oxidative pathways. Further characterization of the PK properties of evacetrapib will be published elsewhere.
The exposure-response modeling of the HDL-C data estimated that the theoretical population mean maximal increase in HDL-C relative to baseline with evacetrapib is 177% (Table 2). Similar analyses conducted for anacetrapib revealed a maximal effect of 176%,7 indicating very similar maximal HDL-C increases are possible with both compounds. Combining the estimated EAUC50 for evacetrapib and the estimated AUC at each evacetrapib dose in this study indicates that the doses tested produced HDL-C increases of ~30, 50, and 80% of the maximal effect. This wide range indicates the doses selected for this study enabled a robust evaluation of the relationship between evacetrapib exposure and HDL-C. In long-term studies with torcetrapib9 and anacetrapib,10 HDL-C has been observed to continue to increase well beyond the time when steady-state plasma concentrations of the compound would have been achieved, with continued increases observed even after 3 months of treatment. In this study, the majority of the increase in HDL-C was observed to occur after 2 weeks of treatment, when concentrations of evacetrapib would have reached steady state, but further increases in HDL-C were observed between 2 and 12 weeks of treatment, especially at the highest dose. Similar to torcetrapib and anacetrapib, further increases in HDL-C may also be observed with longer evacetrapib treatment.
An important result of the exposure-response modeling of the HDL-C data was the quantification of the impact of baseline HDL-C on the HDL-C response. This result is important to consider when comparing the percent change from baseline in HDL-C observed across studies that may enroll patients with different baseline HDL-C values. As an example, the mean baseline HDL-C in the anacetrapib DEFINE study 10 was 40 mg/dl, while in this study, the mean baseline HDL-C was 55 mg/dl. Based on the model-estimated relationship between baseline HDL-C and percent change from baseline HDL-C (Table 2 and Figure 2), an evacetrapib AUC that would produce an HDL-C increase of 110% in patients with a mean baseline HDL-C similar to this study would have produced an HDL-C increase of 127% in patients with a mean baseline HDL-C similar to that observed in the DEFINE study.
The theoretical population mean maximal LDL-C reduction relative to baseline estimated by the LDL-C model was 44.1%, which is somewhat lower than the 80% theoretical maximal reduction estimated for anacetrapib using a similar LDL-C model.7 The reason for the difference in LDL-C maximal reduction but similarity in the HDL-C maximal reduction for evacetrapib and anacetrapib is unknown. The estimated EAUC50 for LDL-C reduction was very similar to the HDL-C EAUC50, indicating that changes in HDL-C and LDL-C in proportion to their maximal effect are equally sensitive to changes in evacetrapib exposure. Unlike the HDL-C model, the LDL-C model was unable to find any consistent change in LDL-C over the 12-week duration of the study, indicating that maximal LDL-C reduction was achieved by the first time point, 2 weeks after treatment with evacetrapib started. An important finding with the LDL-C model was the pharmacologic independence of the LDL-C response produced by evacetrapib and the three statins included in this study. The LDL-C model used an interaction structure similar to that used previously for statins11 and anacetrapib,7 and estimated an interaction coefficient value of −0.997. A value of −1 would indicate complete pharmacologic independence. Therefore, the observed result indicates that the LDL-C reduction that would be produced by a specific dose of evacetrapib would be the same whether it was administered as monotherapy, or if it was administered to a patient already taking a statin. A pharmacologically independent LDL-C reduction was also found when anacetrapib was combined with atorvastatin.7
In summary, the PK and PK/PD relationships of evacetrapib have been well characterized using the data from a phase II study in dyslipidemic patients. No patient factors were found to have a clinically significant effect on evacetrapib exposure, and the developed exposure-response models for HDL-C and LDL-C can be used to estimate the HDL-C and LDL-C response over a wide range of evacetrapib exposures. These PK and PK/PD models can be used to guide future development of evacetrapib.
Methods
Study design. This study was an outpatient, multicenter, randomized, double-blind, double-dummy, parallel group, placebo- and active-controlled, phase II efficacy and safety study in patients with hypercholesterolemia or low HDL-C. The detailed design attributes of the study have been previously reported.4 Briefly, patients entering the study met either a low HDL-C or high LDL-C criteria in the presence of triglyceride levels less than 400 mg/dl, after a lipid washout and dietary lead-in period. Following the lead-in period, patients were entered into 12 weeks of treatment with evacetrapib as monotherapy or in combination with statins. Patients in the monotherapy treatment groups received either placebo, or 30, 100, or 500 mg of evacetrapib daily. Patients in the combination treatment groups received either placebo or 100 mg of evacetrapib in combination with either 40 mg of simvastatin, 20 mg of atorvastatin, or 10 mg of rosuvastatin daily. This study was carried out in accordance with the Helsinki Declaration of 1975 (as revised in 1983). The institutional review boards of all participating centers approved the protocol and all patients provided written informed consent.
PK/PD sampling and assays. Venous blood samples were obtained to measure the plasma concentrations of evacetrapib and the following statin parent and statin metabolites: atorvastatin, o-hydroxyatorvastatin, p-hydroxyatorvastatin, rosuvastatin, rosuvastatin lactone, N-desmethyl rosuvastatin, simvastatin, and simvastatin acid. The results of the statin and statin metabolite measurements will be reported elsewhere in conjunction with other drug interaction properties of evacetrapib. Two samples were collected at each treatment visit which occurred 2, 4, 8, and 12 weeks after beginning treatment. At the 2-week visit, one sample was collected predose and one sample was collected 1–2 hours postdose. At the 4-, 8-, and 12-week visits, one sample was collected predose and one sample was collected 3–18 hours postdose. A single sample was also collected at early discontinuation or at a follow-up visit 4–6 weeks after the 12-week treatment period was completed. A single sample for HDL-C and LDL-C was collected at 2, 4, 8, and 12 weeks after beginning treatment.
Plasma concentrations of evacetrapib were determined using a validated liquid chromatography with tandem mass spectrometry (LC/MS/MS) method. The lower limit of quantification was 1 ng/ml. Concentrations of HDL-C and LDL-C were determined by standard enzymatic assay.
Evacetrapib PK model development. The evacetrapib concentration data were analyzed using the nonlinear mixed effects modeling program NONMEM Version 7.2 (ICON, Dublin, Ireland). Conditional estimation with interaction was used as the estimation method throughout the NONMEM analysis. One, two, and three compartment structural models with first-order absorption were tested. Intersubject variability was assessed separately on each of the PK parameters using an exponential error structure. Once intersubject variability terms were selected, covariance between the terms was assessed by application of an omega block on selected parameters. Proportional, additive, and combined proportional and additive error structures were evaluated for the residual error. Selection of the most appropriate base model was based upon a number of factors, including comparison of minimum objective function values, completion of the estimation and covariance routines, precision of the parameter and error estimates, and by visual inspection of diagnostic plots (Supplementary Data).
Once the structural and variability components of the model had been established, the effect of patient and study factors on the PK model parameters was assessed. The following factors were evaluated: age, weight, body mass index, gender, ethnicity, evacetrapib dose, CGCL, concomitant medications, and coadministration with atorvastatin, simvastatin, or rosuvastatin. The factors were first tested individually and were deemed to be statistically significant at the 0.01 level based on the change in the minimum objective function. Factors found to be statistically significant at the 0.01 level individually were combined in a full model, and stepwise backward elimination was used to eliminate any factors that were not significant at the 0.001 level. These statistical criteria were used for these analyses to prevent spurious findings that may have resulted due to the relatively small study size and insufficient range of patient characteristics.
The final model evaluation was completed by examining log likelihood profiles of all parameters and conducting a visual predictive check.
HDL-C and LDL-C model development. For the HDL-C and LDL-C models, percent change from baseline was the endpoint that was modeled as this was the primary response metric of interest. For both models, individual patient post hoc estimates of evacetrapib AUC from the final PK model described above were fixed in the analysis dataset and used as the independent variable for evacetrapib exposure. Both models evaluated the change in response over time using various nonlinear model structures.
For the HDL-C models, the primary basic model structure that was evaluated is shown as Eq. 4, where PLAC is the placebo effect, STAT is the percent change in HDL-C in patients treated with a statin, Emax is the theoretical maximum percent change in HDL in patients treated with evacetrapib, AUC is the steady-state evacetrapib AUC, EAUC50 is the evacetrapib AUC that produced half of maximal percent change in HDL-C, GAM is the Emax model Hill coefficient, K is the kinetic rate constant giving the rate of change in the time course of the HDL-C response, and time is the time from first dose of treatment. Models that evaluated the interaction of the effect produced by evacetrapib and the statins were also evaluated.
 |
For the LDL-C models, the primary basic model structure that was evaluated is shown as Eqs. 5 and 6, where INTER is the PD interaction effect between evacetrapib and statin, LY is the evacetrapib effect, and PLAC, STAT, Emax, AUC, EAUC50, K, time, and GAM all have the same meaning as in the HDL-C model. The variables IST and ICOMB are indicator variables which were set equal to 1 for the statin monotherapy groups and the evacetrapib plus statin combination groups, respectively, otherwise these indicator variables were set equal to zero.
 |
 |
The process used to determine the best structural and variability components of the HDL-C and LDL-C models was similar to that used for the evacetrapib PK model. Following the selection of the best base model, the following factors were assessed for their impact on the HDL-C and LDL-C model parameters: age, gender, weight, body mass index, ethnicity, baseline CETP mass, and baseline levels of triglycerides, Apo A-1, Apo B, HDL-C, and LDL-C.
Author contributions
S.F. wrote the manuscript. S.E.N., S.J.N., K.A.K., S.F., and J.J.P.K. designed and performed the research. D.J., T.W., and S.F. analyzed the data and contributed new reagents/analytical tools.
Conflict of Interest
At the time of study completion and manuscript authoring, S.F., D.J., T.W., and K.A.K. were employees of Lilly and hold stock or stock options in the company. All authors have completed and submitted the ICMJE Form for Disclosure of Potential Conflicts of Interest. J.J.P.K. reports receiving honoraria or serving as a consultant for: Eli Lilly, Roche, MSD, Novartis, Pfizer, AstraZeneca, Resverlogix, The Medicines Company, Amgen, Alnylam, CSL-Behring, Catabasis, Pronova, Omthera, Aegerion, Genzyme, Amarin, VBL, Isis, Boehringer Ingelheim, Kinemed, Sanofi, Regeneron, Xenon, Dezima, Atheronova, Servier, UniQure, Cerenis, Anthera, and Genentech. S.J.N. reports receiving research support from AstraZeneca, Novartis, Eli Lilly, Anthera, LipoScience, Roche, and Resverlogix and receiving honoraria or serving as a consultant for AstraZeneca, Roche, Esperion, Abbott, Pfizer, Merck, Takeda, LipoScience, Omthera, Novo-Nordisk, Sanofi-Aventis, Atheronova, Anthera, CSL Behring, and Boehringer Ingelheim. S.E.N. reports receiving research support from Eli Lilly, Pfizer, Takeda, Orexigen, Resverlogix, Novo Nordisk, Vivus, and Novartis. He has consulted for a number of pharmaceutical companies without financial compensation. All honoraria, consulting fees, or any other payments from any for-profit entity are paid directly to charity so that neither income nor any tax deduction is received. No other disclosures were reported (Supplementary Data).
Study Highlights
Acknowledgments
The study was funded by Eli Lilly and Company.
Supplementary Material
References
- Bays H., Stein E.A. Pharmacotherapy for dyslipidaemia–current therapies and future agents. Expert Opin. Pharmacother. 2003;4:1901–1938. doi: 10.1517/14656566.4.11.1901. [DOI] [PubMed] [Google Scholar]
- Gordon T., Castelli W.P., Hjortland M.C., Kannel W.B., Dawber T.R. High density lipoprotein as a protective factor against coronary heart disease. The Framingham Study. Am. J. Med. 1977;62:707–714. doi: 10.1016/0002-9343(77)90874-9. [DOI] [PubMed] [Google Scholar]
- Barter P.J., et al. ILLUMINATE Investigators Effects of torcetrapib in patients at high risk for coronary events. N. Engl. J. Med. 2007;357:2109–2122. doi: 10.1056/NEJMoa0706628. [DOI] [PubMed] [Google Scholar]
- Nicholls S.J., et al. Effects of the CETP inhibitor evacetrapib administered as monotherapy or in combination with statins on HDL and LDL cholesterol: a randomized controlled trial. JAMA. 2011;306:2099–2109. doi: 10.1001/jama.2011.1649. [DOI] [PubMed] [Google Scholar]
- Krishna R., et al. Single-dose pharmacokinetics and pharmacodynamics of anacetrapib, a potent cholesteryl ester transfer protein (CETP) inhibitor, in healthy subjects. Br. J. Clin. Pharmacol. 2009;68:535–545. doi: 10.1111/j.1365-2125.2009.03465.x. [DOI] [PMC free article] [PubMed] [Google Scholar]
- Krishna R., et al. Multiple-dose pharmacodynamics and pharmacokinetics of anacetrapib, a potent cholesteryl ester transfer protein (CETP) inhibitor, in healthy subjects. Clin. Pharmacol. Ther. 2008;84:679–683. doi: 10.1038/clpt.2008.109. [DOI] [PubMed] [Google Scholar]
- Krishna R., Bergman A.J., Green M., Dockendorf M.F., Wagner J.A., Dykstra K. Model-based development of anacetrapib, a novel cholesteryl ester transfer protein inhibitor. AAPS J. 2011;13:179–190. doi: 10.1208/s12248-011-9254-0. [DOI] [PMC free article] [PubMed] [Google Scholar]
- Gotto A.M., Jr, et al. Effects on lipids and safety following cessation of treatment with cholesteryl ester transfer protein inhibitor anacetrapib in patients with or at high risk for coronary heart disease. Circulation. 2011;124:A15035. doi: 10.1016/j.amjcard.2013.08.041. [DOI] [PubMed] [Google Scholar]
- Barter P.J., et al. ILLUMINATE Investigators Effects of torcetrapib in patients at high risk for coronary events. N. Engl. J. Med. 2007;357:2109–2122. doi: 10.1056/NEJMoa0706628. [DOI] [PubMed] [Google Scholar]
- Cannon C.P., et al. Determining the Efficacy and Tolerability Investigators Safety of anacetrapib in patients with or at high risk for coronary heart disease. N. Engl. J. Med. 2010;363:2406–2415. doi: 10.1056/NEJMoa1009744. [DOI] [PubMed] [Google Scholar]
- Mandema J.W., et al. Model-based development of gemcabene, a new lipid-altering agent. AAPS J. 2005;7:E513–E522. doi: 10.1208/aapsj070352. [DOI] [PMC free article] [PubMed] [Google Scholar]
Associated Data
This section collects any data citations, data availability statements, or supplementary materials included in this article.


