

Abstract
Objectives. We compared the risk of injury for multiple job holders (MJHs) with that for single job holders (SJHs).
Methods. We used information from the National Health Interview Survey for the years 1997 through 2011 to estimate the rate of multiple job holding in the United States and compared characteristics and rates of self-reported injury (work and nonwork) for SJHs versus MJHs.
Results. Approximately 8.4% of those employed reported working more than 1 job in the week before the interview. The rate of work and nonwork injury episodes per 100 employed workers was higher for MJHs than for SJHs (4.2; 95% confidence interval [CI] = 3.5, 4.8; vs 3.3; 95% CI = 3.1, 3.5 work injuries and 9.9; 95% CI = 8.9, 10.9; vs 7.4; 95% CI = 7.1, 7.6 nonwork injuries per 100 workers, respectively). When calculated per 100 full-time equivalents (P < .05), the rate ratio remained higher for MJHs.
Conclusions. Our findings suggest that working in multiple jobs is associated with an increased risk of an injury, both at work and not at work, and should be considered in injury surveillance.
Over the past 5 decades there have been many changes in the nature of work in the United States, primarily driven by shifts in the economy, technological advances, and globalization.1,2 Nearly half of the civilian employed population in the United States currently have some college education,3 but a significant number of workers take on part-time work and change jobs several times, especially new graduates in the first few years of employment.4–6
According to the Bureau of Labor Statistics (BLS) Current Population Survey (CPS), in 2011 approximately 5% of US workers reported working in more than 1 job in the same week.7 The BLS American Time Use Survey (ATUS), which has a smaller sample and diary format, reports higher rates of multiple job holding in the same week (11% in 2011).8 Paxson and Sicherman9 estimated that up to 20% of male US workers are employed in multiple jobs over the course of a year. Employment in multiple jobs can take on many different forms, seldom captured in surveys: seasonal work concurrent or alternating with a primary job, working an additional job on the weekends,10 working 2 consecutive shifts in separate jobs, possibly full or part time, etc. The discrepancy in the prevalence of multiple job holders (MJHs) from the different national data sources is likely attributable to variations in definitions, or survey or sampling methods.
Economists cite 2 main incentives for working in more than 1 job11–13: (1) needing extra income, currently constituting approximately 64% of all MJHs12 and (2) advancing their skills or entrepreneurial opportunity. These different reasons for multiple job holding, however, are likely not mutually exclusive.14
The effect of working multiple jobs on work and nonwork injury has only been minimally explored. One recent study in Wisconsin reported that youths aged 14 to 18 years who worked in multiple jobs had more injuries and more serious injuries than those who worked in only 1 job.15 This study, however, was limited to a specific population with a small sample size.
None of the current injury surveillance systems in the United States addresses the dynamic fluctuations in type of work, work hours, and work processes during the week or year before an injury. For the past 30 years, occupational injury research and standard surveillance systems have almost exclusively described injury morbidity relative to exposures at the worker’s primary job or the job in which the worker was working when injured.
We explored the effect of working multiple jobs on work and nonwork injury by using data from the National Health Interview Survey (NHIS). This strategically weighted sample is designed to produce national estimates representative of the US civilian, noninstitutionalized population on a broad range of health topics. Survey respondents are asked to report whether they worked in more than 1 job in the past week and whether they were injured in the past 3 months. With these data, we estimated the prevalence of MJHs and single job holders (SJHs) in the United States, described similarities and differences in demographic and work characteristics for the 2 groups, and tested our hypothesis that those who work in multiple jobs are at increased risk of both work and nonwork injury compared with those who work in only 1 job. We pooled survey data on multiple job holding and injuries across 15 years (1997–2011). We also compared the prevalence of multiple job holding in the NHIS with published statistics from other national surveys.
METHODS
The NHIS is an annual nationwide survey conducted by the National Center for Health Statistics.16 Data are collected with in-household surveys administered to a sample of the noninstitutionalized US civilian population (30 000 to 40 000 households each year) by trained interviewers from the US Census Bureau. The sample is selected through a complex, multistage design that involves stratification, clustering, and oversampling of specific population subgroups. We used NHIS data collected between 1997 (the first year the survey included questions on injuries) and 2011 (the most recent year available). We followed guidelines for pooling data across multiple years as recommended by the National Center for Health Statistics 17 and made appropriate adjustments for variance calculations, which took into account annual stratifications, clusters, and weights.18,19 Although there were slight changes to the injury questions over the 15-year period, we assumed these were unlikely to have any substantial effect on the broad-level aggregate statistics and comparisons made between SJHs and MJHs.
Study Population
For each sampled household in the NHIS, in-person interviews are conducted with an adult resident who answers questions related to the demographic, personal, and health status characteristics of each member of the household. Workers are identified by the response to the following question: “What was each household member doing last week?” Responses were (1) “working for pay at a job or business” or (2) “with a job or business but not at work.” All injuries or poisoning episodes that a member of the household experienced in the 3 months before the interview that required medical treatment are also recorded during this portion of the interview.20–22 A work injury was identified in the NHIS if the response “Working at a paid job” was selected in response to the question, “What were you doing when the injury happened?”
The sample adult questionnaire is administered to 1 randomly selected adult aged 18 years or older from each sampled household with the aim of gathering more specific health, employment, and demographic information on that 1 person.
Employed sample adults are further asked, “Do you have more than 1 job or business?” Those responding “yes” were categorized as MJHs; those responding “no” were categorized as SJHs. Our study sample was limited to employed respondents of the sample adult questionnaire, where workers were assigned as either an SJH or an MJH. We included both work and nonwork injuries to sample adults in these analyses.
The average sample adult survey response rate across all 15 years was 70%, ranging annually between 61% and 80%. When survey responses are weighted, the results represent the adult (aged 18 years and older) civilian noninstitutionalized US population.
Rate of Injury
With US population estimates of workers from the NHIS in the denominator, we determined the rate of nonwork and work injury episodes per 100 workers for MJHs and SJHs separately. To account for varying work hours or time at risk, we also determined the rate of work injury episodes per 100 full-time equivalent (FTE) workers for MJHs and SJHs.
We calculated the FTE contribution for each worker by multiplying their reported usual weekly working hours for all jobs for the week before survey administration by 50 weeks in the year. We then normalized this to an FTE worker (2000 annual work hours).
Covariates
Other variables of interest from the main in-person interview included age, gender, education, race/ethnicity, and marital status or family type. Variables of interest obtained from the sample adult questionnaire included occupation, hourly pay (yes or no), job tenure, and usual weekly hours worked at all jobs. We assigned workers into general occupation categories (blue-collar, white-collar, or service) based on census occupation group codes.23
To investigate how often MJHs work in nonstandard work situations compared with SJHs, we explored the responses to supplemental questions from the 2010 sample adult questionnaire pertaining to the structure of work (i.e., work arrangement [contract, temporary, or permanent] and work schedule [daytime, evening, or rotating]).
We compared the overall prevalence of holding multiple jobs from the NHIS with published statistics from 2 other national BLS surveys: the CPS7 and ATUS.8 The format of the questions for the different national surveys varied slightly. For the CPS, the question was “The week before last week did you have more than 1 job or business including part time, evening or weekend hours?” For ATUS, the question was “In the last 7 days did you have more than 1 job?”
Data Analyses
We obtained the prevalence of MJHs with 95% confidence intervals (CIs) by demographics (gender, age, education, race, and marital or family type) and work characteristics (occupation type, type of pay, job tenure, and usual weekly hours). We also obtained the rate of nonwork and work injury episodes per 100 workers with 95% CIs for MJHs and SJHs by work and demographic subgroups. We performed all analyses with SAS version 9.2 (SAS Institute, Cary, NC) PROC SURVEYMEANS procedures with the Domain and Ratio statement.
We estimated rate ratios (RRs) comparing the MJH rate of work injury episodes per 100 FTE to the SJH rate by using negative binomial regression with sample weights. For the subgroup analysis, when the grouping variable was ordinal or interval (such as worker’s age or work hours), we further investigated whether there was an increasing trend in the RR across the subgroups. If the grouping variable was categorical (e.g., race and ethnicity), we chose a subgroup (e.g., White non-Hispanic) as the referent and examined whether other subgroups’ RR (e.g., Hispanic) were significantly different from the reference group. We performed these analyses with Stata version 11.0 (StataCorp LP, College Station, TX).
RESULTS
Of the employed sample adults interviewed by the National Center for Health Statistics over the 15-year period, a total of 268 615 had complete information about single or multiple job holding work status (unweighted n = 22 171 MJHs; n = 246 444 SJHs). When weighted, this represents an annual average of 11.2 million MJHs and 122.6 million SJHs, aged 18 years and older, working in the United States each year. The percentage of the workforce holding multiple jobs ranged between 7.5% in 2000 and 9.2% in 2009 (Figure 1) with an average prevalence of 8.4%.
FIGURE 1—
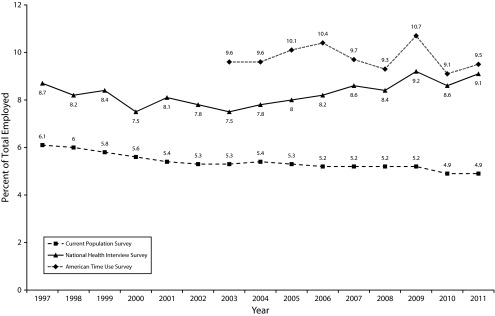
Reported prevalence on US workforce (% of working population) of multiple job holders.
Note. Data from American Time Use Survey,8 Current Population Survey,7 and the National Health Interview Survey, 1997–2011.
The MJHs were found to be different from SJHs in several aspects (Table 1). The MJHs were more likely to be college educated, younger, White non-Hispanic, unmarried, working 50 or more hours a week, in a service occupation, and with less job tenure at their primary job.
TABLE 1—
Demographic and Work Composition of Single vs Multiple Job Holders: The National Health Interview Survey, Sample Adult File 1997–2011
| Variable | Single Job Holders, Weighted Frequency of Workers, No. in 1000s (%) | Multiple Job Holders, Weighted Frequency of Workers, No. in 1000s (%) | Multiple Job Holder Prevalencea (95% CI) |
| Total | 1 839 521 (100) | 167 678 (100) | 8.4 (8.2, 8.5) |
| Worker demographics | |||
| Gender | |||
| Male | 987 451 (54) | 88 878 (53) | 8.3 (8.1, 8.4) |
| Female | 852 071 (46) | 78 800 (47) | 8.5 (8.3, 8.7) |
| Age, y | |||
| 18–24 | 237 665 (13) | 23 729 (14) | 9.1 (8.6, 9.6) |
| 25–44 | 885 657 (48) | 80 664 (48) | 8.4 (8.2, 8.5) |
| 45–64 | 652 722 (35) | 58 785 (35) | 8.3 (8.0, 8.5) |
| ≥ 65 | 63 477 (3) | 4500 (3) | 6.6 (6.1, 7.2) |
| Education | |||
| Did not complete high school | 212 577 (12) | 10 223 (6) | 4.6 (4.3, 4.9) |
| High-school graduate | 513 246 (28) | 36 132 (22) | 6.6 (6.3, 6.8) |
| ≥ some college | 1 102 698 (60) | 120 775 (72) | 9.9 (9.7, 10.1) |
| Race/ethnicity | |||
| White non-Hispanic | 1 308 670 (71) | 128 564 (77) | 9.0 (8.8, 9.1) |
| Hispanic | 236 793 (13) | 14 798 (9) | 5.9 (5.6, 6.2) |
| Black non-Hispanic | 203 687 (11) | 17 813 (11) | 8.0 (7.7, 8.4) |
| Non-Hispanic other | 90 370 (5) | 6504 (4) | 6.7 (6.2, 7.2) |
| Marital or family type | |||
| Married | 1 086 910 (59) | 90 828 (54) | 7.7 (7.5, 7.9) |
| Widowed, divorced, or separated | 237 190 (13) | 24 839 (15) | 9.5 (9.2, 9.8) |
| Never married, living with partner, or unknown status | 515 422 (28) | 52 011 (31) | 9.2 (8.9, 9.5) |
| All jobs | |||
| Usual weekly work hours | |||
| ≤ 30 | 316 530 (17) | 33 216 (20) | 9.5 (9.1, 9.9) |
| 31–39 | 951 356 (52) | 57 588 (34) | 5.7 (5.6, 5.9) |
| 40–49 | 314 629 (17) | 31 338 (19) | 9.1 (8.7, 9.4) |
| ≥ 50 | 202 834 (11) | 41 307 (25) | 16.9 (16.4, 17.4) |
| Primary job | |||
| Category | |||
| Blue-collar occupation | 454 598 (25) | 30 113 (18) | 6.2 (6.0, 6.5) |
| Service occupation | 282 310 (15) | 31 472 (19) | 10.0 (9.7, 10.4) |
| White-collar occupation | 1 053 436 (57) | 103 928 (62) | 9.0 (8.8, 9.2) |
| Tenure, y | |||
| 0–1 | 489 345 (27) | 48 633 (29) | 9.0 (8.8, 9.3) |
| 2–4 | 425 974 (23) | 39 715 (24) | 8.5 (8.3, 8.8) |
| ≥ 5 | 894 860 (49) | 78 106 (47) | 8.0 (7.8, 8.2) |
| Paid hourly | |||
| Paid hourly | 1 048 873 (57) | 98 752 (59) | 8.6 (8.4, 8.8) |
| Not paid hourly | 781 840 (43) | 68 447 (41) | 8.1 (7.9, 8.3) |
Note. CI = confidence interval.
We calculated multiple job holder prevalence by dividing the number of multiple job holders in a specified worker group by the total employment in the same group.
According to the responses to the supplemental questions in 2010, on-call workers, independent contractors, those working the evening shift, and those working at some other nonregular schedule had a higher prevalence of multiple job holding (10.3%, 16.5%, 13.4%, and 12.3%, respectively) compared with 8.4% overall; workers working a regular daytime schedule had a lower prevalence (7.6%).
Injury Rate per 100 Workers
A total of 7492 injury episodes were reported by our sample over the 15-year period; 6690 injury episodes were reported by SJHs and 802 by MJHs. Of the 7492 episodes, 2257 were work-related. Weighted, this represents an annual average of approximately 14.7 million injury episodes a year, of which 4.5 million (31%) were work injury episodes and 10.2 million were nonwork injury episodes. Of all injuries, 1.6 million (11%) were to MJHs, with an annual average of 0.5 million work injury episodes and 1.1 million nonwork injury episodes.
Overall, and for almost all subgroups, the MJHs had a significantly higher injury rate per 100 workers for both work- and nonwork-related injuries compared with SJHs (4.2; 95% CI = 3.5, 4.8; vs 3.3; 95% CI = 3.1, 3.5 for work and 9.9; 95% CI = 8.9, 10.9; vs 7.4; 95% CI = 7.1, 7.6 for nonwork, respectively; Table 2). For work injuries, this was statistically significant (nonoverlapping 95% CI) for women, those with some college education, those between the ages of 25 and 44 years, and White non-Hispanics.
TABLE 2—
Number, Percentage, and Rate of Work- and Nonwork-Related Injury Episodes per 100 Workers by Demographic Characteristics and Single vs Multiple Job Holder Status: National Health Interview Survey, Sample Adult File 1997–2011
| Work-Related Injuries, Single Job Holders |
Work-Related Injuries, Multiple Job Holders |
Nonwork-Related Injuries, Single Job Holders |
Nonwork-Related Injuries, Multiple Job Holders |
|||||
| Variable | Weighted Injury Episodes, No. in 1000s (%) | Rate per 100 Workers (95% CI) | Weighted Injury Episodes, No. in 1000s (%) | Rate per 100 Workers (95% CI) | Weighted Injury Episodes, No. in 1000s (%) | Rate per 100 Workers (95% CI) | Weighted Injury Episodes, No. in 1000s (%) | Rate per 100 Workers (95% CI) |
| Total | 60 470 (100) | 3.3 (3.1, 3.5) | 6981 (100) | 4.2 (3.5, 4.8) | 135 732 (100) | 7.4 (7.1, 7.6) | 16 654 (100) | 9.9 (8.9, 10.9) |
| Worker demographics | ||||||||
| Gender | ||||||||
| Male | 42 233 (70) | 4.3 (4.0, 4.6) | 4434 (64) | 5.0 (4.0, 6.0) | 71 874 (53) | 7.3 (6.9, 7.6) | 9030 (54) | 10.2 (8.7, 11.6) |
| Female | 18 237 (30) | 2.1 (2.0, 2.3) | 2546 (36) | 3.2 (2.3, 4.1) | 63 858 (47) | 7.5 (7.1, 7.9) | 7624 (46) | 9.7 (8.3, 11.0) |
| Age, y | ||||||||
| 18–24 | 9617 (16) | 4.1 (3.4, 4.7) | 1464 (21) | 6.2 (3.8, 8.6) | 22 137 (16) | 9.3 (8.4, 10.2) | 3021 (18) | 12.7 (9.6, 15.9) |
| 25–44 | 30 879 (51) | 3.5 (3.2, 3.7) | 3748 (54) | 4.7 (3.7, 5.6) | 65 362 (48) | 7.4 (7.0, 7.8) | 8242 (49) | 10.2 (8.8, 11.6) |
| 45–64 | 18 908 (31) | 2.9 (2.6, 3.2) | 1745 (25) | 3.0 (2.1, 3.9) | 43 287 (32) | 6.6 (6.2, 7.1) | 5120 (31) | 8.7 (7.1, 10.3) |
| ≥ 65 | 1067 (2) | 1.7 (1.0, 2.4) | … | … | 4946 (4) | 7.8 (6.3, 9.3) | … | … |
| Education | ||||||||
| Did not complete high school | 8639 (14) | 4.1 (3.5, 4.6) | 669 (10) | 6.6 (3.2, 9.9) | 11 845 (9) | 5.6 (4.8, 6.3) | 763 (5) | 7.5 (4.1, 10.9) |
| High-school graduate | 21 504 (36) | 4.2 (3.8, 4.6) | 1500 (21) | 4.2 (2.9, 5.4) | 31 640 (23) | 6.2 (5.7, 6.6) | 3141 (19) | 8.7 (6.7, 10.7) |
| ≥ some college | 30 109 (50) | 2.7 (2.5, 3.0) | 4801 (69) | 4.0 (3.1, 4.8) | 92 003 (68) | 8.3 (8.0, 8.7) | 12 750 (77) | 10.6 (9.3, 11.8) |
| Race/ethnicity | ||||||||
| White non-Hispanic | 45 334 (75) | 3.5 (3.2, 3.7) | 5747 (82) | 4.5 (3.7, 5.3) | 108 764 (80) | 8.3 (8.0, 8.6) | 13 560 (81) | 10.5 (9.3, 11.8) |
| Black non-Hispanic | 6409 (11) | 3.2 (2.7, 3.6) | 637 (9) | 3.6 (1.6, 5.6) | 11 993 (9) | 5.9 (5.2, 6.5) | 1447 (9) | 8.1 (5.9, 10.4) |
| Hispanic | 6796 (11) | 2.9 (2.5, 3.3) | 422 (6) | 2.9 (1.5, 4.3) | 10 126 (7) | 4.3 (3.8, 4.8) | 1053 (6) | 7.1 (4.5, 9.7) |
| Non-Hispanic other | 1931 (3) | 2.1 (1.3, 2.9) | … | … | 4849 (4) | 5.4 (4.3, 6.4) | … | … |
| Marital or family type | ||||||||
| Married | 32 290 (53) | 3.0 (2.8, 3.2) | 2951 (42) | 3.3 (2.4, 4.1) | 68 629 (51) | 6.3 (6.0, 6.6) | 7812 (47) | 8.6 (7.2, 10.0) |
| Widowed, divorced, or separated | 9053 (15) | 3.8 (3.3, 4.3) | 1319 (19) | 5.3 (3.5, 7.1) | 21 668 (16) | 9.1 (8.4, 9.8) | 3104 (19) | 12.5 (10.1, 14.9) |
| Never married, living with partner, or unknown status | 19 127 (32) | 3.7 (3.3, 4.1) | 2711 (39) | 5.2 (3.9, 6.5) | 45 435(33) | 8.8 (8.3, 9.4) | 5738 (34) | 11.0 (9.2, 12.9) |
| All jobs | ||||||||
| Usual weekly work hours | ||||||||
| ≤ 30 | 7993 (13) | 2.5 (2.1, 2.9) | 1183 (17) | 3.6 (2.1, 5.0) | 28 657 (21) | 9.1 (8.3, 9.8) | 4118 (25) | 12.4 (9.9, 14.9) |
| 31–39 | 29 997 (50) | 3.2 (2.9, 3.4) | 2164 (31) | 3.8 (2.7, 4.8) | 59 670 (44) | 6.3 (5.9, 6.6) | 4188 (25) | 7.3 (5.9, 8.6) |
| 40–49 | 11 311 (19) | 3.6 (3.1, 4.1) | 1634 (23) | 5.2 (3.3, 7.1) | 25 095 (18) | 8.0 (7.4, 8.6) | 3097 (19) | 9.9 (7.7, 12.1) |
| ≥ 50 | 8463 (14) | 4.2 (3.6, 4.8) | 1850 (27) | 4.5 (3.2, 5.7) | 15 966 (12) | 7.9 (7.0, 8.8) | 4528 (27) | 11.0 (8.7, 13.2) |
| Primary job | ||||||||
| Category | ||||||||
| Blue-collar occupation | 29 889 (49) | 6.6 (6.1, 7.1) | 2715 (39) | 9.0 (6.6, 11.5) | 28 963 (21) | 6.4 (5.9, 6.9) | 2791 (17) | 9.3 (7.1, 11.4) |
| Service occupation | 10 836 (18) | 3.8 (3.4, 4.3) | 1873 (27) | 6.0 (4.1, 7.9) | 21 082 (16) | 7.5 (6.8, 8.2) | 2268 (14) | 7.2 (5.5, 9.0) |
| White-collar occupation | 19 231 (32) | 1.8 (1.7, 2.0) | 2393 (34) | 2.3 (1.7, 2.9) | 83 705 (62) | 8.0 (7.6, 8.3) | 11 539 (69) | 11.1 (9.7, 12.5) |
| Tenure, y | ||||||||
| 0–1 | 20 198 (33) | 4.1 (3.7, 4.6) | 2537 (36) | 5.2 (3.8, 6.7) | 41 918 (31) | 8.6 (8.0, 9.1) | 5340 (32) | 11.0 (9.1, 12.9) |
| 2–4 | 13 744 (23) | 3.2 (2.9, 3.6) | 1592 (23) | 4.0 (2.8, 5.2) | 31 421 (23) | 7.4 (6.8, 7.9) | 4498 (27) | 11.3 (9.1, 13.6) |
| ≥ 5 | 26 101 (43) | 2.9 (2.7, 3.2) | 2771 (40) | 3.6 (2.7, 4.4) | 61 268 (45) | 6.9 (6.5, 7.2) | 6774 (41) | 8.7 (7.3, 10.0) |
| Paid hourly | ||||||||
| Paid hourly | 45 013 (74) | 4.3 (4.0, 4.6) | 5391 (77) | 5.5 (4.4, 6.5) | 75 218 (55) | 7.2 (6.8, 7.5) | 9086 (55) | 9.2 (8.0, 10.5) |
| Not paid hourly | 15 359 (25) | 2.0 (1.8, 2.2) | 1560 (22) | 2.3 (1.6, 3.0) | 60 164 (44) | 7.7 (7.3, 8.1) | 7535 (45) | 11.0 (9.4, 12.7) |
Notes. CI = confidence interval. Unweighted > 20 in each subgroup.
Although generally those with some college education had a lower rate per 100 workers of being injured on the job compared with those without any college education, they had a much higher rate (3 times as high) of being injured when not working regardless of MJH status (Table 2). In 18 of 29 categories listed in Table 2, there was a significantly higher rate of nonwork injuries for MJHs compared with SJHs.
Rate per 100 Full-Time Equivalent Multiple vs Single Job Holders
After we controlled for work hours, MJHs still had a higher work injury rate per 100 FTE (+19%) than SJHs (Table 3; RR = 1.19; 95% CI = 1.0, 1.4; P < .05).
TABLE 3—
Evaluation of Multiple Job Holder to Single Job Holder Work-Related Injury Rate Ratios per 100 Full-Time Equivalents by Demographic and Work Characteristics: National Health Interview Survey, Sample Adult File 1997–2011
| Rate Ratio |
||||
| Variable | MJH Rate per 100 FTE | SJH Rate per 100 FTE | RR MJH: SJH | Pa |
| Total | 3.9 | 3.2 | 1.19b | … |
| Worker demographic | ||||
| Gender | ||||
| Male (Ref) | 4.4 | 3.9 | 1.11 | |
| Female | 3.2 | 2.3 | 1.39b | .26 |
| Age, y | ||||
| 18–24 | 6.8 | 4.8 | 1.42c | .08 |
| 25–44 | 4.2 | 3.3 | 1.25c | |
| 45–64 | 2.7 | 2.7 | 0.98 | |
| ≥ 65 | … | 2.2 | … | |
| Education | ||||
| Did not complete high school | 6.0 | 4.1 | 1.44 | .13 |
| High-school graduate (Ref) | 3.7 | 4.1 | 0.89 | |
| ≥ some college | 3.8 | 2.7 | 1.40b | .02 |
| Race/ethnicity | ||||
| White non-Hispanic (Ref) | 4.2 | 3.4 | 1.24 | |
| Hispanic | 2.6 | 2.9 | 0.90b | .26 |
| Black non-Hispanic | 3.1 | 3.2 | 0.96 | .42 |
| Non-Hispanic other | … | 2.2 | … | … |
| Marital or family type | ||||
| Married (Ref) | 3.0 | 2.8 | 1.07 | |
| Widowed, divorced, or separated | 4.6 | 3.8 | 1.21 | .61 |
| Never married, living with partner, or unknown status | 5.0 | 3.9 | 1.28c | .36 |
| All jobs | ||||
| Usual weekly work hours | ||||
| ≤ 30 | 7.0 | 4.9 | 1.41 | .36 |
| 31–39 | 3.9 | 3.2 | 1.20 | |
| 40–49 | 4.4 | 3.0 | 1.44c | |
| ≥ 50 | 2.8 | 2.7 | 1.04 | |
| Primary job | ||||
| Category | ||||
| Blue-collar occupation | 7.2 | 5.6 | 1.28c | .79 |
| Service occupation | 4.1 | 3.5 | 1.15 | .7 |
| White-collar occupation (Ref) | 2.2 | 1.9 | 1.20 | |
| Tenure, y | ||||
| 0–1 | 5.2 | 4.4 | 1.18 | .87 |
| 2–4 | 3.7 | 3.2 | 1.17 | |
| ≥ 5 | 3.2 | 2.8 | 1.15 | |
| Paid hourly | ||||
| Paid hourly | 5.2 | 4.5 | 1.16 | .9 |
| Not paid hourly (Ref) | 2.1 | 1.8 | 1.14 | |
Note. FTE = full-time equivalent; MJH = multiple job holder; RR = rate ratio; SJH = single job holder.
RRs compared within group with reference category or ordinal trend.
Rate ratio is significantly different than 1 (P < .05).
Rate ratio trended toward significance (P < .1).
Specific variables where the rate per 100 FTE of work injuries for MJHs was statistically higher than for SJHs (RR > 1) at the P < .05 level were women and those with a college education (Table 3).
We found that the youngest workers, those with a blue-collar occupation, and workers whose marital or family type was never married, living with a partner, or unknown status had very high RRs, indicating potentially elevated risk for these MJHs; however, they failed to reach statistical significance at the P = .05 level (although they did approach significance at the P = .1 level).
We observed a trend, approaching significance, in RR by age category with the highest RR for the youngest workers and lowest for the oldest workers. The RR of MJHs to SJHs for those with some college education was also statistically different from those with only a high-school degree (Table 3).
The prevalence of MJHs found from the NHIS, CPS, and ATUS are reported in Figure 1. The prevalence of multiple job holding as reported from the NHIS ranged from lows in 2000 and 2003 (7.5%) to a high rate in 2009 (9.2%). For the CPS the prevalence of multiple job holding was highest in 1997 (6.1%), then gradually declined to 4.9% in 2011. The multiple job holding prevalence was first reported from ATUS data in 2003 as 9.6%; it grew to a high of 10.7% in 2009. The lowest MJH prevalence was reported in 2010 as 9.1%.
DISCUSSION
With reports from the NHIS we found that, during the 15 years of our study, approximately 8.4% of employed US residents worked multiple jobs in the week before the interview and were at higher risk for injury (during work and outside work) compared with SJHs. We also found that both the rates of injury per 100 workers and per 100 FTE (with control for work hours) were higher among MJHs than SJHs.
There are several hypothetical pathways from exposure in more than 1 job to increased risk of work and nonwork injury, such as fatigue because of extra hours worked, lack of sleep, or the additional and varied physical and mental stress from alternating between different types of exposure.20,24,25 The elevated MJH rate per 100 FTEs in each strata of weekly work hours indicates that fatigue from long work hours may not fully explain the higher risk we found for MJHs. Other potential factors specific to work injuries include inexperience in 1 or both jobs,26 hurried behavior from working hourly or trying to fit full-time workload into part-time hours,27 and decreased employer investment in workers employed only part time.
The elevated rate of nonwork injury for MJHs compared with SJHs also merits attention (9.9 vs 7.4). Because MJHs are more likely to have less nonwork exposure time, we expect this to be a conservative estimate of the true risk to MJHs. The strength and consistency in this finding across all demographic and work groups may indicate that nonwork injuries are associated with or partially caused by exposures associated with work in more than 1 job, such as fatigue from long working hours20,24 or the potentially hectic structure of a work week that includes 2 jobs. This finding was accentuated in the college-educated group. They were at much higher risk (3 times as high) for being injured when not working; this may also indicate that because they are working in less-hazardous environments, they may be less prepared, inexperienced, or unconditioned to the secondary environment when exposed to more hazardous environments outside work.
We also speculated that the elevated rate of work and nonwork injury for MJHs may be higher than we observed here; we believe this estimate to be conservative because of the timing of reporting. Respondents were asked to simultaneously report, in a cross-sectional manner, injuries in the past 3 months and report employment in more than 1 job in the past week. If someone has been severely injured within the past 3 months they may be unable to work in 1 job when interviewed, and much less likely to be employed in multiple jobs. If they were injured in the past 3 months, but not employed in the past week, the injury would not be counted in our sample, decreasing the rates for work and nonwork injuries (healthy worker effect), especially among MJHs or nonpermanent employees.
The impact of multiple job holding on the injury rate per 100 workers did not appear to vary significantly across most subgroups (e.g., rates were elevated 10% to 30%) for work and nonwork injuries. After we controlled for work hours (rates calculated per 100 FTE), women, younger workers (group aged 25–44 years), White non-Hispanics, and those with some college education maintained statistically significant elevated work injury rates for MJHs compared with SJHs (Table 3); in addition, the RR (rate per 100 FTE MJHs:SJHs) was higher, approaching significance, for those aged 18 to 44 years; those whose marital or family type was never married, living with a partner, or status unknown; and blue-collar workers.
Female MJHs had a 39% higher rate of work injuries compared with SJHs (RR = 1.39; 95% CI = 1.0, 1.9; P < .05). Women, more often than men, will work in multiple part-time jobs (1997 CPS and 2012 ATUS: women 33%, 36%, respectively; men 13%, 19%, respectively),28,29 perhaps because of availability of type of job (e.g., service work). Or, they may take on multiple part-time jobs to be able to earn the equivalent of 1 full-time job.12,30–32 Female part-time workers are usually paid hourly, receive lower wages, and have unstable and unpredictable hours,28,33 potentially increasing risk.
We found that young workers, also often working part time in multiple jobs, had higher rates when working multiple jobs compared with SJHs (1.42; 95% CI = 0.9, 2.2, ages 18–24 years; 1.25; 95% CI = 1.0, 1.6, ages 25–44 years; P < .1). This finding supports a similar finding for youths aged 14 to 18 years working in more than 1 job,15 but expands it nationally and also includes a broader age range. Young workers have unique risks (e.g., inexperience, lack of health and safety training, possible mismatch between physical, cognitive characteristics and job requirements), which may lead to consequences that would make them particularly vulnerable.34
The elevated work injury RR (rate per 100 FTE MJH:SJH) for both the college-educated and blue-collar workers also merits attention. The proportion of the US workforce who is college-educated has increased substantially in the past 15 years.35 However, a high RR for MJHs compared with SJHs (1.40; 95% CI = 1.1, 1.8; P < .05) makes the rate per 100 FTE for this group very similar to that of high-school graduates, reducing at least the safety effect of a college education. We also found the RR (MJH:SJH) for blue-collar workers to be high (1.28; 95% CI = 1.0, 1.7; P < .1), although the SJH rate per 100 FTE was already the highest of any category (5.6 per 100 FTE).
In this study, we compared the prevalence and characteristics of MJHs in the United States from 3 separate sources. The questions asked to determine MJH status in the CPS and ATUS were similar to the questions asked in the NHIS, and yielded similar demographic characteristics for MJHs: MJHs work longer hours, and are more likely to be college-educated and work in a service occupation.12,36,37 The CPS has historically been the leading instrument used to determine trends in employment and unemployment in the United States since the 1940s. However, although the NHIS and the ATUS show rates of multiple job holding between 8% and 10%, with some slight increases and decreases over time, they are both much higher than the CPS prevalence (approximately 5%), which has shown a steady downward trend from 1997 through 2011. The NHIS sample adult questionnaire and the ATUS are more centered on the individual (without a proxy response for these variables), which could increase the accuracy of responses; however, those samples are smaller and perhaps less stable than those in the CPS.
In the United States the structure of work has been changing in many ways and there are now many different forms of employment that were less common before the mid-1990s including casual and temporary work, labor leasing, self-employment, subcontracting, and home-based work.38–40 When we used the 2010 NHIS supplemental questions on temporary and contract work, we found indications that MJHs were more likely to be employed in nonstandard work situations and to work the evening shift; fewer MJHs reported working as a regular permanent employee compared with SJHs and fewer reported working regular daytime hours. These hazards may be singular or be combined, such as part-time work at night. We anticipate that these nonstandard characteristics of work (whether alone or combined) are related to multiple job holding and also may be related to injury risk for MJHs. However, there was no way for us to evaluate the effect on injury risk to MJHs attributable to these characteristics because these questions were only asked in the 2010 sample adult survey.
Injury research and standard surveillance systems have disregarded multiple job holding, instead describing injury morbidity in terms of exposures at the primary job or the job in which the worker was working when injured. Furthermore, most of the current injury surveillance systems and standard employment surveys in the United States do not account for the dynamic fluctuations in work forms present today. To better understand the role of MJHs, the many different forms of multiple job holding need to be incorporated into questionnaires, such as working in more than 1 job each day (part-time or full-time), working another job on weekends, or working a second job at a completely different time of the year (e.g., summer employment for teachers). These MJH characteristics could not be studied by using the limited responses on employment characteristics in the NHIS.
Strengths and Limitations
A major strength of this study is the use of the NHIS, a large, nationally representative sample and the only US national survey to include questions on both employment in multiple jobs and work and nonwork injuries. To determine multiple job holding status, however, we had to restrict our study findings to the respondents of the sample adult questionnaire subsample, which comprises about a quarter of the complete NHIS sample. Because MJHs only constitute approximately 10% of that reduced sample, the small number of injuries in that subgroup (although when weighted is a significant population) limits the utility of this data source. Also, the sample adult questionnaire is not administered to anyone younger than 18 years, excluding the majority of working adolescents who often have more than 1 job, work in nonstandard employment situations, and have been found to be at increased risk of injury and severity of injury while working in multiple jobs.15,41
Because of the small number of MJH injuries (in the sample) we could not conduct multivariate modeling because of a lack of statistical power. We also could not further explore the association of work in multiple jobs for subgroups of interest such as young workers, women, and those with a college education.
Another possible limitation was the low reporting of multiple job holding and work injuries in Black non-Hispanic, Hispanic, and non-Hispanic other categories in the NHIS. We hypothesize that there may be a cultural reporting bias in these results as others have shown that minority workers are often working in the most hazardous occupations42 and, therefore, would be expected to have higher rates of injury.
Conclusions
We think that the substantial prevalence of MJHs in the United States, coupled with the increased risk of injury we observed, and the potential hypothetical pathways to an increased risk of injury from exposure in more than 1 job, suggest the need to further study this issue. We suggest the need for collecting more detailed information identifying all possible forms of multiple job holding and work, along with injury source and outcome.
Acknowledgments
We would like to thank Margaret Warner, PhD, for her initial suggestions on working with the injury data from the National Health Interview Survey; William Shaw, PhD, David Lombardi, PhD, and Ted Courtney, MS, CSP, for insightful reviews; and Peg Rothwell for editorial input on the final article.
Human Participant Protection
The data analyzed in this study are de-identified, publicly accessible data. The institutional review board of the Liberty Mutual Research Institute for Safety determined that approval was not needed for this study.
References
- 1.National Occupational Research Agenda. Cincinnati, OH: National Institute for Occupational Safety and Health; 2002. Organization of Work Team Members. The changing organization of work and the safety and health of working people: knowledge gaps and research directions. DHHS (NIOSH) publication no. 2002-116. [Google Scholar]
- 2.Kuhn S, Wooding J. The changing structure of work in the United States. Implications for health and welfare. Part 2. New Solut. 1994;4(4):21–27. doi: 10.2190/NS4.4.d. [DOI] [PubMed] [Google Scholar]
- 3. Bureau of Labor Statistics. Data retrieval: labor force statistics from the Current Population Survey. Household data: Table 7. Employment status of the civilian population 25 years and over by educational attainment, sex, race, and Hispanic or Latino ethnicity. 2012. Available at: http://www.bls.gov/cps/cpsaat07.htm. Accessed December 20, 2012.
- 4. Canadian Imperial Bank of Commerce, Centre for Human Capital and Productivity. The transferability of skills. Policy brief no. 4. London, Ontario: Western University, Department of Economics, Social Science Centre; 2012. Available at: http://economics.uwo.ca/cibc/cibc_docs/policybrief4.pdf. Accessed September 5, 2013.
- 5. Bureau of Labor Statistics. Number of jobs, labor market experience, and earnings growth: results from a National Longitudinal Survey news release: USDL-12-1489. Washington, DC: US Department of Labor; 2012. Available at: http://www.bls.gov/news.release/nlsoy.htm. Accessed December 20, 2012.
- 6. Seligson H. Job jugglers, on the tightrope. New York Times. June 25, 2011. Available at: http://www.nytimes.com/2011/06/26/business/26work.html?pagewanted=all. Accessed April 12, 2013.
- 7. Bureau of Labor Statistics. Data retrieval: labor force statistics (CPS). Household data: Table A-16. Persons not in the labor force and multiple jobholders by sex, not seasonally adjusted, 2012. Available at: http://www.bls.gov/webapps/legacy/cpsatab16.htm. Accessed December 20, 2012.
- 8. Bureau of Labor Statistics. American Time Use Survey [news release]; 2012. Available at: http://www.bls.gov/tus/news.htm. Accessed December 20, 2012.
- 9.Paxson CH, Sicherman N. The dynamics of dual job holding and job mobility. J Labor Econ. 1996;14(3):357–393. [Google Scholar]
- 10. Bureau of Labor Statistics. American Time Use Survey (ATUS). Percent of population who worked on weekdays and weekend days chart. 2012. Available at: http://www.bls.gov/tus/charts/chart11.pdf. Accessed December 20, 2012.
- 11.Amirault T. Characteristics of multiple jobholders, 1995. Mon Labor Rev. 1997;120(3):9–15. [Google Scholar]
- 12.Hipple SF. Multiple jobholding during the 2000s. Mon Labor Rev. 2010;133(7):21–32. [Google Scholar]
- 13.Kopp M. Washington, DC: Bureau of Labor and Statistics; 1977. Multiple jobholders, May 1976. Special Labor Force Report 194. [Google Scholar]
- 14.Kimmel J, Conway KS. Kalamazoo, MI: WE Upjohn Institute for Employment Research; 1995. Who moonlights and why? Evidence from the SIPP. Working paper no. 95-40. [Google Scholar]
- 15.Zierold KM, Appana S, Anderson HA. School-sponsored work programs: a first look at differences in work and injury outcomes of teens enrolled in school-to-work programs compared to other-working teens. Occup Environ Med. 2011;68(11):818–825. doi: 10.1136/oem.2010.059170. [DOI] [PubMed] [Google Scholar]
- 16. National Health Interview Survey. Atlanta, GA: Centers for Disease Control and Prevention; 2012. Available at: http://www.cdc.gov/NCHS/NHIS.htm. Accessed December 20, 2012.
- 17.Chen LH, Warner M, Fingerhut L, Makuc D. Injury episodes and circumstances: National Health Interview Survey, 1997–2007. National Center for Health Statistics. Vital Health Statistics 10. 2009;(241):1–55. [PubMed] [Google Scholar]
- 18. Centers for Disease Control and Prevention. Variance estimation and other analytic issues in the 1997–2005 NHIS (adapted from appendices III and VII of the 2005 NHIS Survey description document, and Appendix III of the 2006 NHIS Survey description document). 2009. Available at: http://www.cdc.gov/nchs/data/nhis/9705var.pdf. Accessed April 12, 2013.
- 19. Centers for Disease Control and Prevention. Variance estimation and other analytic issues, NHIS 2006–2011 (adapted from the 2006–2011 NHIS Survey description documents—appendices “Variance estimation and other analytic issues,” and “Merging data files and combining years of data”). 2012. Available at: http://www.cdc.gov/nchs/data/nhis/2006var.pdf. Accessed April 12, 2013.
- 20.Lombardi DA, Folkard S, Willetts JL, Smith GS. Daily sleep, weekly working hours, and risk of work-related injury: US National Health Interview Survey. (2004–2008) Chronobiol Int. 2010;27(5):1013–1030. doi: 10.3109/07420528.2010.489466. [DOI] [PubMed] [Google Scholar]
- 21.Smith GS, Wellman HM, Sorock GS et al. Injuries at work in the US adult population: contributions to the total injury burden. Am J Public Health. 2005;95(7):1213–1219. doi: 10.2105/AJPH.2004.049338. [DOI] [PMC free article] [PubMed] [Google Scholar]
- 22.Warner M, Barnes PM, Fingerhut LA. Injury and poisoning episodes and conditions: National Health Interview Survey, 1997. Vital Health Stat 10. 2000;(202):1–38. [PubMed] [Google Scholar]
- 23.Gabriel PE, Schmitz S. An examination of occupational differences in the returns to labor market experience. J Business Econ Res. 2011;2(11):93–98. [Google Scholar]
- 24.Arlinghaus A, Lombardi DA, Willetts JL, Folkard S, Christiani DC. A structural equation modeling approach to fatigue-related risk factors for occupational injury. Am J Epidemiol. 2012;176(7):597–607. doi: 10.1093/aje/kws219. [DOI] [PubMed] [Google Scholar]
- 25.Dembe AE, Erickson JB, Delbos RG, Banks SM. The impact of overtime and long work hours on occupational injuries and illnesses: new evidence from the United States. Occup Environ Med. 2005;62(9):588–597. doi: 10.1136/oem.2004.016667. [DOI] [PMC free article] [PubMed] [Google Scholar]
- 26.Benavides FG, Benach J, Muntaner C, Delclos GL, Catot N, Amable M. Associations between temporary employment and occupational injury: what are the mechanisms? Occup Environ Med. 2006;63(6):416–421. doi: 10.1136/oem.2005.022301. [DOI] [PMC free article] [PubMed] [Google Scholar]
- 27.Koukoulaki T. New trends in work environment—new effects on safety. Saf Sci. 2010;48:936–942. [Google Scholar]
- 28. Bureau of Labor Statistics. US labor force statistics including the national unemployment rate (annual averages – household data): Table 36. Multiple jobholders by selected demographic and economic characteristics. 2011. Available at: http://stats.bls.gov/cps/cpsaat36.pdf. Accessed April 12, 2013.
- 29.Stinson JF., Jr New data on multiple jobholding available from the CPS. Mon Labor Rev. 1997:3–8. [Google Scholar]
- 30. Tahmincioglu E. More women holding down multiple jobs. Many face pay disparities, more likely to have part-time positions. 2010. Available at: http://www.nbcnews.com/id/35912763/ns/business-careers. Accessed January 24, 2013.
- 31. DiNatale M. Characteristics of and preference for alternative work arrangements. 1999. Available at: http://www.bls.gov/opub/mlr/2001/03/art2full.pdf. Accessed April 12, 2013.
- 32. US Department of Labor. Women’s employment during the recovery. 2011. Available at: http://www.dol.gov/_sec/media/reports/femalelaborforce. Accessed April 12, 2013.
- 33. Watson L, Swanberg JE. Flexible workplace solutions for low-wage hourly workers: a framework for a national conversation. 2011. Available at: http://workplaceflexibility2010.org/images/uploads/whatsnew/Flexible%20Workplace%20Solutions%20for%20Low-Wage%20Hourly%20Workers.pdf. Accessed January 13, 2013.
- 34. Wegman DH, Davis LK. Protecting youth at work. Am J Ind Med. 1999;36(5):579–583. [DOI] [PubMed]
- 35. Bureau of Labor Statistics. Data retrieval: labor force statistics (CPS). Household data: Table A-4. Employment status of the civilian population 25 years and over by educational attainment. 2010. Available at: http://www.bls.gov/webapps/legacy/cpsatab4.htm. Accessed December 20, 2012.
- 36. Bureau of Labor Statistics. American Time Use Survey (ATUS). Table 6. Employed persons working (1) at home and at their workplace and time spent working at each location by full- and part-time status and sex, jobholding status, and educational attainment, 2011 annual averages 2012. Available at: http://www.bls.gov/news.release/atus.t06.htm. Accessed December 20, 2012.
- 37. Bureau of Labor Statistics. American Time Use Survey (ATUS)—2010 results—USDL-11-0919 [news release]. 2011. Available at: http://www.bls.gov/news.release/archives/atus_06222011.pdf. Accessed July 15, 2012.
- 38.Bohle P, Quinlan M, Kennedy D, Williamson A. Working hours, work–life conflict and health in precarious and “permanent” employment. Rev Saude Publica. 2004;38(suppl):19–25. doi: 10.1590/s0034-89102004000700004. [DOI] [PubMed] [Google Scholar]
- 39.Fisher PS, Ditsler E, Gordon C, West D. Nonstandard Jobs, Substandard Benefits. Mount Vernon, IA: The Iowa Policy Project; 2005. [Google Scholar]
- 40.Quinlan M, Mayhew C, Bohle P. The global expansion of precarious employment, work disorganization, and consequences for occupational health: a review of recent research. Int J Health Serv. 2001;31(2):335–414. doi: 10.2190/607H-TTV0-QCN6-YLT4. [DOI] [PubMed] [Google Scholar]
- 41.Presser HB, Ward BW. Nonstandard work schedules over the life course: a first look. Mon Labor Rev. 2011;134(7):3–16. [Google Scholar]
- 42.Strong LL, Zimmerman FJ. Occupational injury and absence from work among African American, Hispanic, and non-Hispanic White workers in the National Longitudinal Survey of Youth. Am J Public Health. 2005;95(7):1226–1232. doi: 10.2105/AJPH.2004.044396. [DOI] [PMC free article] [PubMed] [Google Scholar]