Abstract
Digital breast tomosynthesis uses a limited number (typically 10–20) of low-dose x-ray projections to produce a pseudo-three-dimensional volume tomographic reconstruction of the breast. The purpose of this investigation was to characterize and evaluate the effect of scattered radiation on the image quality for breast tomosynthesis. In a simulation, scatter point spread functions generated by a Monte Carlo simulation method were convolved over the breast projection to estimate the distribution of scatter for each angle of tomosynthesis projection. The results demonstrate that in the absence of scatter reduction techniques, images will be affected by cupping artifacts, and there will be reduced accuracy of attenuation values inferred from the reconstructed images. The effect of x-ray scatter on the contrast, noise, and lesion signal-difference-to-noise ratio (SDNR) in tomosynthesis reconstruction was measured as a function of the tumor size. When a with-scatter reconstruction was compared to one without scatter for a 5 cm compressed breast, the following results were observed. The contrast in the reconstructed central slice image of a tumorlike mass (14 mm in diameter) was reduced by 30%, the voxel value (inferred attenuation coefficient) was reduced by 28%, and the SDNR fell by 60%. The authors have quantified the degree to which scatter degrades the image quality over a wide range of parameters relevant to breast tomosynthesis, including x-ray beam energy, breast thickness, breast diameter, and breast composition. They also demonstrate, though, that even without a scatter rejection device, the contrast and SDNR in the reconstructed tomosynthesis slice are higher than those of conventional mammographic projection images acquired with a grid at an equivalent total exposure.
Keywords: tomosynthesis, x-ray scatter, contrast, SDNR, image quality, breast imaging
INTRODUCTION
Breast tomosynthesis is an extension of digital mammography, in which a series of projection images is acquired at different angles of the x-ray source with respect to the breast. Multiple sectional image slices of the breast are then reconstructed from the projection data. With the ability to reduce overlapping “clutter,” i.e., contrasts caused by structures outside a plane of interest, tomosynthesis is a promising technique for enhancing the conspicuity of the tumor, for reducing false positive findings, and for allowing three-dimensional (3D) localization of the tumor within the breast. However, the imaging performance of tomosynthesis is challenged by some physical factors, including detector efficiency, geometry alignment, and x-ray scatter. Several investigators have studied scatter properties in mammographic applications with experimental and analytical methods.1, 2, 3, 4, 5, 6, 7, 8
For conventional mammography performed with no antiscatter grid, the intensity of scattered x rays incident on the detector can typically be 50% as large as that of the primary (nonscattered) x rays, depending on the breast thickness and composition.9 Scattered x rays reduce image contrast and contribute to image noise, thereby reducing the signal-difference-to-noise ratio (SDNR) of a lesion. In addition, recording of scattered radiation consumes some of the dynamic range of the acquisition system. It has also been demonstrated experimentally and analytically in other investigations of x-ray scatter for cone-beam CT (Ref. 10) and breast CT (Ref. 11) that scatter introduces artifacts and quantitative inaccuracy in the CT reconstruction.
Various approaches have been used to reduce the amount of scattered x-ray radiation that is recorded by the radiological imaging system. These include the air gap technique,12 a moving slit or slot scanning strategy,3, 13, 14 and antiscatter x-ray grids between the patient and the detector. These have been well studied15 and are effective in scatter rejection for mammography. In addition, various investigators have considered software correction algorithms to reduce the deleterious effect of recorded scattered radiation on the image quality.16, 17
This paper describes our work on the simulation of scattered x-ray radiation in the application of digital breast tomosynthesis. The simulation is based on a Monte Carlo method developed by Boone and co-workers9, 18 that reports on scattered radiation under a wide variety of parameters related to mammography and has demonstrated reasonable agreement with physical measurements. Using these results, we evaluated the influence of scatter on the image quality for breast tomosynthesis, including image artifacts, accuracy of reconstruction of attenuation coefficients, contrast, and lesion SDNR. A simple simulation model was used to evaluate the potential use of an antiscatter grid in tomosynthesis. A series of conventional mammographic craniocaudal (CC) views was also simulated for image quality comparison with reconstructed tomosynthesis slices.
METHODOLOGY
Simulation of scatter for tomosynthesis
Scatter point spread functions (PSFs) were obtained from Monte Carlo simulations using the approach developed by Boone and co-workers.9, 18 In their simulation, monoenergetic x-ray beams were normally incident upon the top surface of a breast phantom of a specified composition and thickness, and the distribution of the energy deposition in an ideal detector was tallied at different air gaps from the exit surface of the phantom.
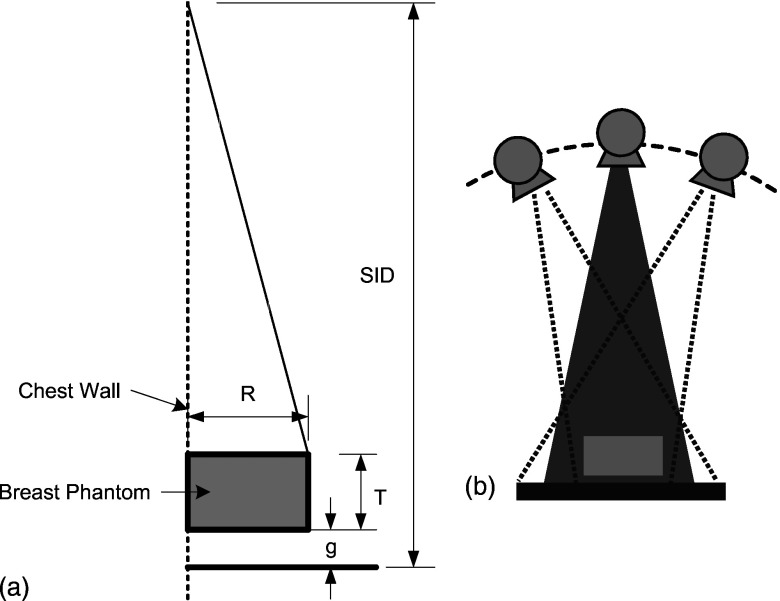
To represent the compressed breast, two mathematical phantoms with design similar to that illustrated in Fig. 1a were created. Phantom I has a uniform distribution of 50% fibroglandular and 50% adipose tissue as background. While phantom I provides a basis for understanding the magnitude and some of the effects of scatter in breast tomosynthesis, its uniform background does not represent the complex detection task in clinical breast screening and diagnosis. Anatomic structures in the normal breast and especially those in a dense breast (a high proportion of fibroglandular tissue) present a cluttered background and may confound interpretation of the image. Phantom II utilizes volumetric tissue attenuation information from a clinical breast tomosynthesis examination and, therefore, has structural variation at different depths. Both mathematical phantoms are rectangular solids in shape and each contains a centrally located simulated spherical tumor, with attenuation coefficients equivalent to infiltrating ductal carcinoma.2 Various diameters of this lesion between 2 and 22 mm were considered.
Figure 1.
(a) Imaging geometry: R—breast radius, T—breast thickness, and g—gap between the bottom of the phantom and the top of the detector. (b) Image acquisition positions for tomosynthesis: Partial isocentric geometry, in which the detector remains stationary and the x-ray tube moves around some center of rotation.
The tomosynthesis acquisition geometry shown in Figs. 1a, 1b was used, with 11 projections (from −20° to 20° about normal incidence with 4° increments). A simple ray-driven projection model was used to create projection images.19 Monoenergetic x rays (20, 30, and 40 keV) were used and the parameters for the breast model were varied to include phantom thicknesses (from 3 to 8 cm) and tissue compositions of 100% adipose tissue, 50% adipose and 50% fibroglandular tissue, and 100% fibroglandular tissue. For each projection angle, the primary x-ray fluences reaching the detector were calculated directly based on the path length of each ray through the phantom considering both attenuation and the inverse square law. The scatter distribution of each projection was computed over the field of view by convolving the scatter PSF with the shape and dimensions of the breast projection area. For each tomosynthetic projection angle, the path length through the center of mass of the irradiated tissue was computed and this was used to select the appropriate scatter PSF. The PSF data were available in 1 cm thickness increments from thicknesses between 2 and 8 cm. It was found that the shapes of the PSFs changed very little with thickness. Therefore, linear interpolation was used to obtain values for intermediate thicknesses and values for thicknesses up to the maximum required value of about 9.3 cm were estimated by extrapolation. For example, for a phantom with thickness of 5 cm, the PSF at for path length of 5.35 cm was selected. The magnitude of scattered radiation striking the detector is quantified in terms of the scatter-to-primary ratio, , where S is the integrated energy of scattered radiation and P is the integrated energy of the primary radiation. Note that a constant scatter PSF was assumed for the entire projected breast area to permit convolution. This will lead to errors in the scatter estimate at the edges of the volume where the path length through the object changes rapidly at the edges.
Validation
It is well known that the SPR increases with increasing breast thickness.20 In tomosynthesis, the angle of incidence varies and the effective path length through the breast is dependent on that angle. Our model considers the non-normality of the beam in calculating the primary x-ray component but not the scattered radiation. Our model partially considers this effect for scatter by using a scatter PSF that is appropriate for the mean path length at each projection angle.
Clearly, a more precise model would use scatter PSF generated at each angular incidence. This is expected to create an asymmetric PSF and potentially alter the scatter magnitude compared to the standard mammographic geometry. The scatter magnitude is largely dominated by the thickness of the material measured along the central incidence axis, which is already included in our model. Using the scatter PSF provided in Fig. 6 of Sechopoulos et al.,21 we performed a simple reconstruction to examine the effect of asymmetry. We found that even for a SPR as large as 5, the effect on the inferred attenuation coefficient was only 2%–4%. As a result, it is believed that our approximations will cause a relatively small error.
We then compared the predictions of the angular dependence of SPR for selected spectra and geometric configurations to those of Sechopoulos et al.21 To perform this comparison, the geometry was matched to theirs, and 20 keV monoenergetic x rays were used to approximate their 31 kV Rh/Rh spectrum. For these calculations, we used a chest wall to nipple distance of 11.6 cm and 50/50 breast composition.
Incorporation of background structure
In phantom II, a typical fibroglandular structure was incorporated into the phantom simulation as a background structure. The background structure was obtained from the patterns seen in an anonymized patient breast tomosynthesis dataset imaged at our institution (courtesy of Dr. R. Jong) using a prototype breast tomosynthesis system based on a modified Senographe DS digital mammography system (GE Healthcare, Chalfont St. Giles, UK). The pixel size in the original projection dataset was . From these data, voxels with dimensions of were reconstructed. A volume of interest of sufficient size to match the phantom was selected from the reconstructed breast volume. This formed the basis of the anatomic background that was incorporated into the phantom simulation. This background was rescaled to produce voxels in the phantom ranging between the attenuation coefficients of 100% adipose and 100% fibroglandular tissue. No corrections were made for the inherent quantum noise in the original patient slices.
Simulation of quantum noise
Quantum noise was added to the images. First, the primary x-ray fluences incident on each detector element were calculated. Then, the scatter photon fluence was estimated by dividing the integrated energy of scattered radiation, determined from the convolution of the primary with the scatter PSF, by the mean energy of the scatter spectrum, . Then, using the Poisson random number generator provided in MATLAB (Matlab 2007a, MathWorks, Inc., Natick, MA), random fluctuation was added to the summed primary-plus-scatter signal. Once the noisy photon images have been computed, the images are log normalized to obtain noisy data to be used in the reconstruction process. These are essentially line integrals of . The presence of noise can cause physically meaningless negative values to occur in the background and potentially for very thin parts of the breast and, therefore, during reconstruction, negative values are truncated to 0.
For simplicity, was assumed to be equal to the incident photon energy, E. This results in a tiny underestimate of the quantum noise associated with the scatter component. The mean scatter angle of the exit fluence is expected to be small (5°–20°).1 This can be appreciated by considering the effect of a very large scattering angle, say 90°. This corresponds to a Compton scatter energy of 38.3 keV for an incident x ray of 40 keV. Assuming an SPR of 1, this would correspond to an excess noise factor22 of or 0.022. This amounts to just over 2% more noise than would be assumed with the approximation. For realistic scattering angles, the increase would be much less than 2%.
Reconstruction of tomosynthesis
A simultaneous algebraic reconstruction technique (SART) (Ref. 23) was selected as the reconstruction method because it has been shown that SART significantly reduces the noise and streak artifacts observed in ray-iterative ART. Also SART has demonstrated a strong performance in the limited view problems,24 which can be properly adapted for breast tomosynthesis. An update relaxation factor23 of 1.0 was used and generally four iterations were required for convergence. Further iterations were found to have little effect.
Cupping artifacts and reconstruction inaccuracy
The effect of x-ray scatter on the contrast, noise, and SDNR in reconstructed tomosynthesis images was measured as a function of the tumor size. Here, contrast is defined as
| (1) |
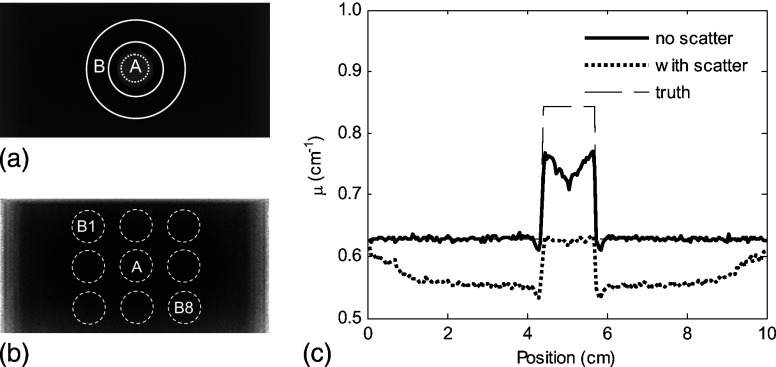
where is the mean inferred linear attenuation coefficient signal intensity of the region of interest (ROI), within the dashed circle, A, in Fig. 2a and is the mean signal intensity of the background region, area B. Note that in tomosynthesis, u represents the reconstructed inferred linear attenuation coefficient, whereas in projection mammography, it represents the logarithm of the detected energy fluence. Another figure of merit, SDNR, is used to describe the relative magnitude of useful information to that of the noise that impairs the detection of this difference. It has been shown that the “pixel SDNR,” based on individual voxel statistics, tends to underestimate the detectability of mass lesions consisting of many voxels.25, 26 A more relevant metric is the “lesion SDNR,”27 where the computation is performed at the relevant detail (size) of the lesion. In this application, where images are likely to be viewed slice by slice, we have chosen to compute the lesion SDNR in individual slices as follows:
| (2) |
Figure 2.
(a) Transaxial central slice of a tomosynthesis reconstruction for a breast phantom I, with a tumor at the center. (b) Transaxial central slice of a tomosynthesis reconstruction for a breast phantom I, without tumor. (c) Horizontal profile through the center of the phantom shows the reduction in the voxel value for both normal tissue and tumor.
An ROI, A, is defined as before, inside the lesion, to yield the average lesion signal , in an identical reconstruction with the lesion absent, ROIs (B1–B8) are arranged around where A would be if the lesion was present. In these ROIs, there are no streak artifacts of reconstruction near the edge of the lesion; therefore, the effect of reconstruction artifacts on the detectability of lesions is not evaluated. The average value in each ROI is recorded . The standard deviation is calculated over the eight values. This yields the contrast and noise characteristics at a detail size equal to that of the lesion. Note that the SDNR used here is defined in a manner analogous to the Rose definition of signal-to-noise ratio (SNR) for a disk of a given size,25, 28, 29 although in this case the image values (and their standard deviation) are expressed in terms of attenuation coefficients rather than the number of x-ray quanta. The ROI, A, and the background regions, B, are depicted in Fig. 2b. Background ROIs (B1–B8) are arranged such that they are separated by a distance equal to the diameter of the lesion. The same spacing is used for the lesion-present and lesion-absent images.
A reconstructed transaxial slice (slices parallel to the plane of the detector) of phantom I, including the effects of scatter is shown in Figs. 2a, 2b. The profile through the lesion center in Fig. 2c shows a reduction in the voxel values and marked nonuniformity, an effect referred to as “cupping.” To quantify the degree of this spatial nonuniformity, a simple measurement of the “cupping ratio,” (Ref. 10) was used: , where is the mean voxel value in a 5 mm wide band located just inside the edge of the reconstructed phantom and is the mean voxel value in a circular ROI of 5mm diameter at the center of the phantom in a lesion-absent reconstruction. The dip in u seen inside the lesion with the “no scatter” profile is a result of the limited angle and the reconstruction technique used: Sharp edges of the lesion model created a ringing artifact (seen slightly outside the lesion and more strongly inside the lesion).
For the tumor in phantom I, the reconstructed attenuation coefficient of the lesion is also influenced by the scattered radiation. The accuracy of reconstructed voxel values is quantified by the comparison of the mean value in the central slice of the reconstructed tumor and the true value in the phantom: .
Simulation of antiscatter grid
To reduce the scattered radiation component, a simulated antiscatter grid, rotated by 90° within its own plane compared to the usual orientation in mammography, is placed between the test object and the detector. The transmission factors for the grid are defined as
| (3) |
where , , and are the primary, scattered, and total radiation transmission factors, respectively. and denote the primary energy fluence and the integrated (over its energy range) scattered radiation energy fluence reaching a particular location in the plane of the detector with the grid in place. The total radiation reaching the detector is reduced by the presence of the grid. In a film system, this makes it necessary to increase the entrance exposure (and patient dose) to maintain the same optical density on the film. However. for a digital system, which has a wide dynamic range and arbitrarily adjustable contrast, the main adverse effect of grid is the reduction in SNR by the loss of primary radiation. In this simulation, theoretical transmission factors of and were used. These are consistent with those measured by Shen et al. ( and ) and Boone et al. ( and inferred from Fig. 12 in Boone’s work) for 5:1 grids at 30 kV.3, 4 Exposure was not increased here because at this stage of the work the detector in this simulation is assumed to have a detective quantum efficiency of 100% and a linear response over its dynamic range, so the only adverse effect expected is a modest drop in SNR.
Simulation of mammographic CC view
For the purpose of comparison between projection mammograms and tomographic slices reconstructed from tomosynthesis data, mammographic CC views were simulated for both phantoms. The same geometry was used for the mammographic projection image as that for tomosynthesis image acquisition at 0°, where the central ray from the x-ray source passes through the center of rotation of the source and falls on the detector at normal incidence. The entrance exposure for the mammographic CC view was set to be equal to the total exposure of the 11 projections for tomosynthesis, which equals 1.1 R (air kerma 9.6 mJ/kg), at 20 keV for a 5 cm thick breast phantom. Using the DgN coefficients calculated by Boone,30 the mean glandular dose is estimated to be 3.1 mGy.
RESULTS
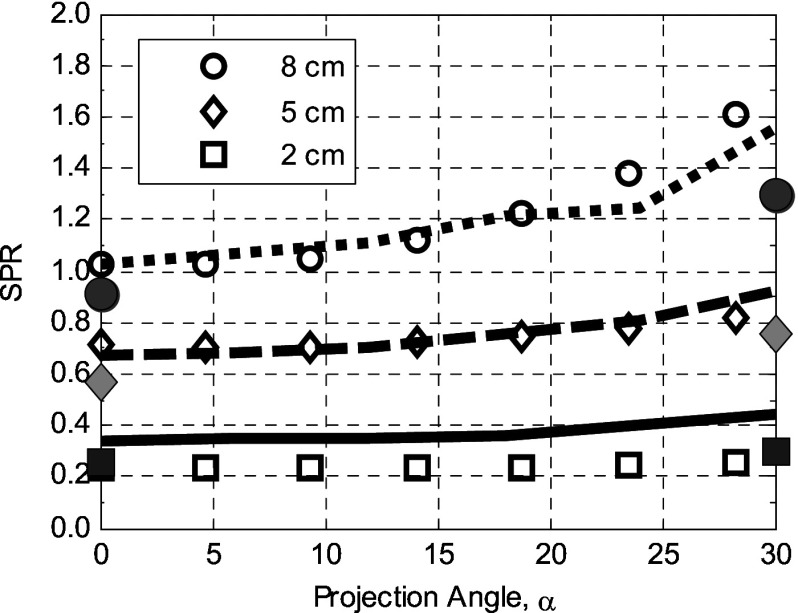
In the paper of Sechopoulos et al., data are shown for projections at 0°–30° both with and without the compression plate and detector cover plate. This provides an opportunity for comparison with our work. For the 2 cm compressed breast, there is good agreement between our results. For breasts of 5 and 8 cm thick, our calculations give higher values of SPR at all projection angles. Sechopoulos has noted a disagreement with the earlier work of Boone despite experimental validation of that earlier work.18 This disagreement is consistent, as our calculations, are based on the scatter PSFs presented in Ref. 9. For reference, we have also shown, as curves in Fig. 3, the Sechopoulos results with the compression paddle and detector cover, and as expected they demonstrate increased SPR.
Figure 3.
Comparison of the SPR calculated in this simulation (data points: breast thickness, , ) with those previously reported by Sechopoulos et al. (Ref. 21) (dotted, dashed, and solid lines for the 8, 5, and 2 cm, respectively). Shaded symbols represent the corresponding results of Sechopoulos et al. without the compression plate in place.
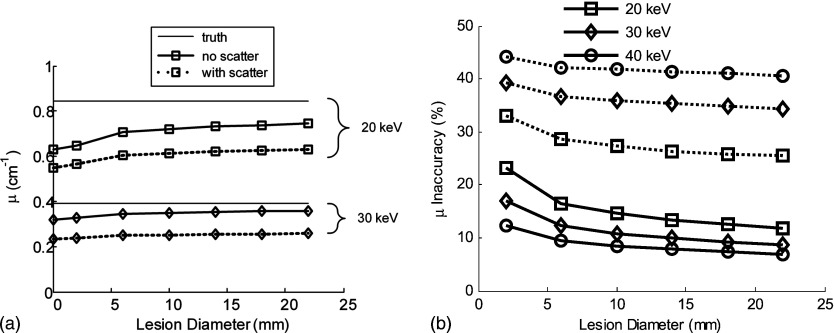
The effect of x-ray scatter on the accuracy of inferred attenuation coefficients in reconstruction data is illustrated in Fig. 4. Solid lines represent the scatter-free situation and dashed lines correspond to the condition where scattered radiation is included. The scatter-free values differ from the true attenuation coefficients shown on the figure due to the limited number of views and limited angular range used in tomosynthesis.
Figure 4.
(a) The voxel values (inferred linear attenuation coefficient compared to the true linear attenuation) of a tumor in the phantom, scatter-free reconstruction (solid lines), and with scatter (dashed lines) are illustrated for different energies as a function of lesion diameter. (b) Inaccuracy of μ (defined in text) vs lesion diameter in a 5-cm-thick phantom. The true values of μ are 0.629, 0.321, and at 20, 30, and 40 keV, respectively.
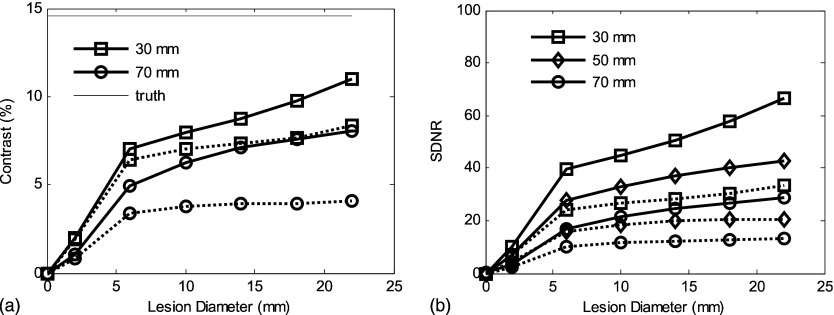
The scatter effects on contrast and “lesion SDNR” [Eq. 3] for a range of breast thicknesses are illustrated in Fig. 5 as a function of the tumor size. Lesion SDNR has been evaluated for the slice containing the center of mass of the lesion. Solid lines represent the scatter-free situation and dashed lines refer to the contamination of scattered radiation. For breast phantom I with thickness of 70 mm and containing a lesion 10 mm in diameter, the contrast of the lesion in the central slice is reduced by 37% in the presence of scattered radiation and the lesion SDNR is reduced by 52%.
Figure 5.
(a) The degrading effect of scatter radiation on contrast in tomosynthesis (phantom I) is illustrated for different breast thicknesses. (b) Scatter radiation markedly reduces the SDNR. Solid lines correspond to a scatter-free simulation and the dotted lines correspond to simulations with scatter. Energy is 20 keV with constant entrance air kerma to the breast.
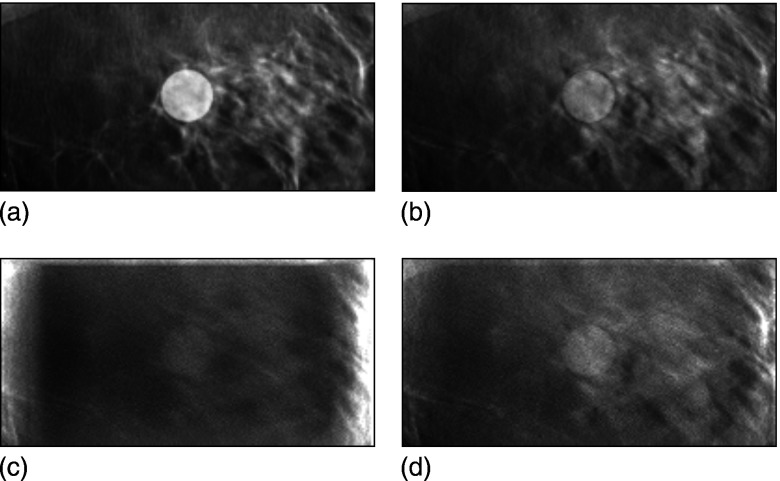
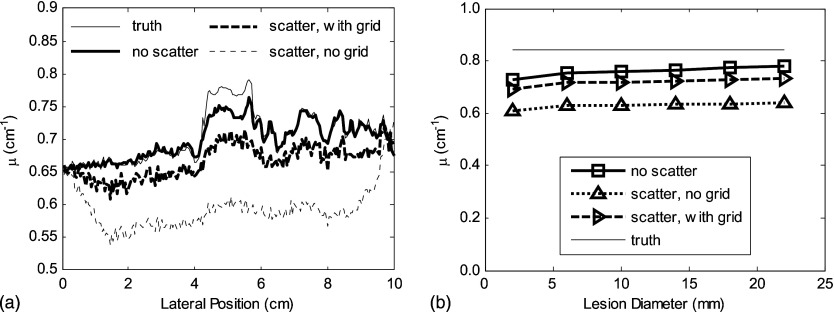
The reconstructed central slice images from phantom II (containing a more anatomically realistic structured background), with and without the effects of scattered radiation, are shown in Figs. 6a, 6b, 6c. In this figure, the images are displayed with the same grayscale window width but centered at different window levels. The tumor contrast is reduced, and the image contains more noise when scattered radiation reaches the detector. The cupping effect is evident in Fig. 6c. Figure 6d shows a central slice when the (simulated) scatter rejection grid is used. The improvement in lesion contrast is considerable. The scatter effect on the accuracy of reconstruction voxel values is seen more clearly in Fig. 7a where profiles through the center of the tumor are plotted. It is also demonstrated in Fig. 7b, where the reconstructed tumor value is plotted versus lesion diameter. All the images shown here were reconstructed from simulated projection data computed for monoenergetic x rays at 20 keV for a breast thickness of 5 cm.
Figure 6.
(a) Central slice of the original (truth) phantom II that has a tumor with a diameter of 14 mm at the center. Note that this image is from the original model data, not a reconstruction. (b) Corresponding tomosynthesis reconstructed slice, scatter free. (c) Reduced contrast and more noise were shown in the central slice of the tomosynthesis reconstruction with scattered radiation. (d) The use of a scatter reduction grid improves contrast and the accuracy of the voxel value. The windowing was set to be the same for all four images, with the level adjusted to yield approximately the same gray level in the background for each image.
Figure 7.
(a) The cupping effect and reduction in accuracy due to scatter are illustrated in the profiles through the center of the tumor for phantom II. The potential value of a grid is also illustrated. (b) The degrading effect of scatter radiation on reconstructed voxel values is illustrated as a function of the lesion diameter.
Results for a tomosynthesis slice image are compared to a simulated projection mammographic CC view for phantoms I and II with and without the use of a grid in Figs. 89. For these simulated images, the total entrance air kerma was the same for the total tomosynthesis set and the single mammogram.
Figure 8.
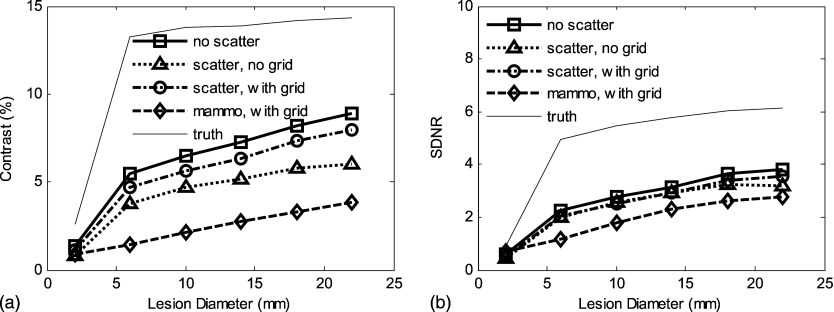
For phantom I with uniform 50% fibroglandular tissue, 20 keV and 5 cm breast thickness: (a) Scatter-contaminated tomosynthesis slice has better contrast than mammographic CC view for a wide range of lesion diameters (from 2 to 22 mm). (b) Tomosynthesis slice has less SDNR than projection CC view; the use of grid improves the recovery of SDNR. Total incident air kerma was set to be 9.6 mJ/kg for all cases (yielding a mean glandular dose of approximately 3.1 mGy).
Figure 9.
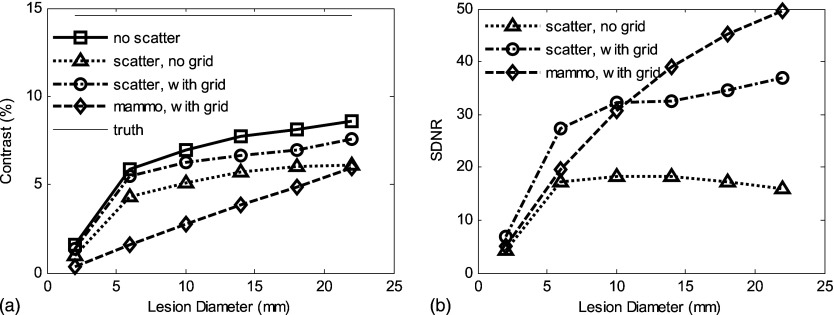
For phantom II (anatomic structures in background): (a) The scatter radiation reduces contrast in the tomosynthesis slice to a level comparable with a mammographic CC view. (b) Although degraded by scatter radiation, the SDNR in the tomosynthesis slice is higher than for the CC projection mammogram. The variation in contrast and SDNR for the “truth” data are caused by the fact that ROIs vary with the lesion diameter and the presence of a heterogeneous background. Incident air kerma was set the same as for the results shown in Fig. 8.
DISCUSSION
As illustrated in Fig. 4, tomosynthetic reconstructed images fall short of truth even in the absence of scatter. This is due to limitations in the reconstruction algorithm and the incomplete sampling geometry of tomosynthesis. The error in μ in the reconstructions is further increased by the apparent signal increase due to the presence of scatter.31 For example, at 20 keV for a 10 mm diameter lesion, the reconstructed value of μ is reduced by 15% without scatter and by 30% in the presence of scattered radiation. The degree of underestimation of μ is increased for higher energies, as illustrated in Fig. 4b. This degrading effect of scatter in reconstruction accuracy could be alleviated by appropriate use of scatter-correction algorithms similar to that developed by Siewerdsen et al.,17 or in the potential integration of scatter simulation into an iterative reconstruction technique.32, 33
A limitation of this work is the assumption of a shift invariant PSF when computing the SPR using the convolution method. Although we do not believe that this effect would be important near the center of the image, it could affect the performance near the periphery of the breast. Another limitation is that all the simulations were performed with monochromatic x rays. Consideration of a polyenergetic spectrum would be a straightforward extension of this work, although, again, we believe that the effect on the result would be fairly small. In their publications, both Boone et al. and Sechopoulos et al. showed that SPR varied minimally over the mammographic energy range.
The effect of x-ray scatter on the accuracy of reconstructed attenuation coefficients for different breast thicknesses is examined. The SDNR is reduced by approximately 50% as breast thickness increases from 30 to 70 mm due to attenuation of the primary signal (Fig. 5). The SDNR is reduced by approximately 54% for a 50 mm thick breast due to the recording of scatter. Moreover, it is shown that scattered radiation has a similar, if not greater, influence than the change in the breast thickness.
As expected, the performance benefit demonstrated when comparing tomosynthesis to projection mammography for a uniform phantom (phantom I) is slight. Contrast [Fig. 7a] is higher across all lesion sizes when comparing the central tomosynthesis slice to a standard CC view. However, in terms of SDNR, tomosynthesis provided superior performance for small lesions when an antiscatter grid is used [Fig. 7b]. For larger lesion sizes, the signal difference for a voxel tends to be independent of the lesion size as expected because the inferred attenuation coefficient is relatively constant, whereas for mammography the signal arises due to the integrated attenuation over the path length (i.e., ) of the lesion. We note also that for simulation that includes scatter, the cupping artifact caused by detection of scatter partially masks the Poisson fluctuations in determining the noise level. Other non-Poisson factors affecting image fluctuation include: Structural artifacts due to the incomplete set of projection data upon which the image reconstruction is based and the filtering of image data inherent in the image reconstruction algorithm. These effects tend to reduce the effect of the lesion size on the SDNR.
As expected, the advantages of tomosynthesis become more apparent in the presence of anatomic noise as would occur in a dense breast. As demonstrated with phantom II, which contains anatomical structural noise, the contrast and SDNR in the tomosynthesis central slice are greater than or equal to that in the CC mammogram. This is true even under the worst scatter conditions for tomosynthesis (full scatter, no grid) for all lesion sizes.
CONCLUSIONS
The detection of scattered radiation causes reduction in contrast and SDNR in tomosynthesis slices, as well as contributing to voxel value inaccuracies in reconstruction. The potential use of an antiscatter grid was investigated, and it was found that contrast, SDNR, and the accuracy of reconstruction of linear attenuation coefficients should be improved by the use of a grid. Note that an ideal detector was assumed for the simulations. In the case of a real detector, the reduced signal in the presence of added electronic noise may reduce the effectiveness of a grid. Other strategies for scatter reduction may be considered, including the optimization of imaging geometry, the use of air gaps, and the incorporation of scatter correction in reconstruction algorithms. The comparison of a tomosynthesis slice and a mammographic projection of the phantom shows that the tomographic slice provides better contrast for relatively small lesions and better SDNR for dense breasts that present a higher proportion of anatomic noise.
ACKNOWLEDGMENTS
This research was funded in part through an operating grant from the Canadian Institutes for Health Research/Canadian Breast Cancer Research Alliance and in part through a Terry Fox Program Project Grant through the National Cancer Institute of Canada. Dr. Yaffe holds the Tory Family Chair in Cancer Research. The authors would like to thank Dr. Roberta Jong, Director of Breast Imaging at Sunnybrook Health Sciences Centre, for her advice and for use of breast tomosynthesis images.
References
- Fahrig R., Mainprize J. G., Robert N., Rogers A., and Yaffe M. J., “Performance of glass fiber antiscatter devices at mammographic energies,” Med. Phys. 21(8), 1277–1282 (1994). 10.1118/1.597236 [DOI] [PubMed] [Google Scholar]
- Barnes J. E., “Characteristics and control of contrast in CT,” Radiographics 12(4), 825–837 (1992). [DOI] [PubMed] [Google Scholar]
- Shen S. Z., Bloomquist A. K., Mawdsley G. E., Yaffe M. J., and Elbakri I., “Effect of scatter and an antiscatter grid on the performance of a slot-scanning digital mammography system,” Med. Phys. 33(4), 1108–1115 (2006). 10.1118/1.2184445 [DOI] [PubMed] [Google Scholar]
- Boone J. M., Seibert J. A., Tang C. M., and Lane S. M., “Grid and slot scan scatter reduction in mammography: Comparison by using Monte Carlo techniques,” Radiology 222(2), 519–527 (2002). 10.1148/radiol.2222010491 [DOI] [PubMed] [Google Scholar]
- Barnes G. T. and Brezovich I. A., “The intensity of scattered radiation in mammography,” Radiology 126(1), 243–247 (1978). [DOI] [PubMed] [Google Scholar]
- Wagner A. J., in Screen Film Mammography: Imaging Considerations and Medical Physics Responsibilities, edited by Barnes G. T. and Frey G. D. (Medical Physics, Madison, 1991), pp. 115–158. [Google Scholar]
- Highnam R. P., Brady J. M., and Shepstone B. J., “Removing the anti-scatter grid in mammography,” Proceedings of the Third International Workshop on Digital Mammography, Chicago, IL (Elsevier, Amsterdam, 1996).
- Mertelmeier T. and Bernhardt P., “Scatter in digital mammography: Antiscatter grid versus slot-scanning,” Proc. SPIE 5745, 299–306 (2005). 10.1117/12.593103 [DOI] [Google Scholar]
- Boone J. M., Lindfors K. K., V. N.CooperIII, and Seibert J. A., “Scatter/primary in mammography: Comprehensive results,” Med. Phys. 27(10), 2408–2416 (2000). 10.1118/1.1312812 [DOI] [PubMed] [Google Scholar]
- Siewerdsen J. H. and Jaffray D. A., “Cone-beam computed tomography with a flat-panel imager: Magnitude and effects of x-ray scatter,” Med. Phys. 28(2), 220–231 (2001). 10.1118/1.1339879 [DOI] [PubMed] [Google Scholar]
- Kwan A. L., Boone J. M., and Shah N., “Evaluation of x-ray scatter properties in a dedicated cone-beam breast CT scanner,” Med. Phys. 32(9), 2967–2975 (2005). 10.1118/1.1954908 [DOI] [PubMed] [Google Scholar]
- Krol A., Bassano D. A., Chamberlain C. C., and Prasad S. C., “Scatter reduction in mammography with air gap,” Med. Phys. 23(7), 1263–1270 (1996). 10.1118/1.597869 [DOI] [PubMed] [Google Scholar]
- Jing Z., Huda W., and Walker J. K., “Scattered radiation in scanning slot mammography,” Med. Phys. 25(7), 1111–1117 (1998). 10.1118/1.598433 [DOI] [PubMed] [Google Scholar]
- Mainprize J. G., Ford N. L., Yin S., Tumer T., and Yaffe M. J., “A slot-scanned photodiode-array/CCD hybrid detector for digital mammography,” Med. Phys. 29(2), 214–225 (2002). 10.1118/1.1446108 [DOI] [PubMed] [Google Scholar]
- Neitzel U., “Grids or air gaps for scatter reduction in digital radiography: A model calculation,” Med. Phys. 19(2), 475–481 (1992). 10.1118/1.596836 [DOI] [PubMed] [Google Scholar]
- Seibert J. A. and Boone J. M., “X-ray scatter removal by deconvolution,” Med. Phys. 15(4), 567–575 (1988). 10.1118/1.596208 [DOI] [PubMed] [Google Scholar]
- Siewerdsen J. H., Daly M. J., Bakhtiar B., Moseley D. J., Richard S., Keller H., and Jaffray D. A., “A simple, direct method for x-ray scatter estimation and correction in digital radiography and cone-beam CT,” Med. Phys. 33(1), 187–197 (2006). 10.1118/1.2148916 [DOI] [PubMed] [Google Scholar]
- Boone J. M. and V. N.CooperIII, “Scatter/primary in mammography: Monte Carlo validation,” Med. Phys. 27(8), 1818–1831 (2000). 10.1118/1.1287052 [DOI] [PubMed] [Google Scholar]
- Siddon R. L., “Fast calculation of the exact radiological path for a three-dimensional CT array,” Med. Phys. 12(2), 252–255 (1985). 10.1118/1.595715 [DOI] [PubMed] [Google Scholar]
- Fritz S. L., Chang C. H., and Livingston W. H., “Scatter/primary ratios for x-ray spectra modified to enhance iodine contrast in screen-film mammography,” Med. Phys. 10(6), 866–870 (1983). 10.1118/1.595350 [DOI] [PubMed] [Google Scholar]
- Sechopoulos I., Suryanarayanan S., Vedantham S., D’Orsi C. J., and Karellas A., “Scatter radiation in digital tomosynthesis of the breast,” Med. Phys. 34(2), 564–576 (2007). 10.1118/1.2428404 [DOI] [PMC free article] [PubMed] [Google Scholar]
- Cunningham I. A., Westmore M. S., and Fenster A., “A spatial-frequency dependent quantum accounting diagram and detective quantum efficiency model of signal and noise propagation in cascaded imaging systems,” Med. Phys. 21(3), 417–427 (1994). 10.1118/1.597401 [DOI] [PubMed] [Google Scholar]
- Andersen A. H. and Kak A. C., “Simultaneous algebraic reconstruction technique (SART): A superior implementation of the art algorithm,” Ultrason. Imaging 6(1), 81–94 (1984). 10.1016/0161-7346(84)90008-7 [DOI] [PubMed] [Google Scholar]
- Andersen A. H., “A ray tracing approach to restoration and resolution enhancement in experimental ultrasound tomography,” Ultrason. Imaging 12(4), 268–291 (1990). 10.1016/0161-7346(90)90003-G [DOI] [PubMed] [Google Scholar]
- Burgess A. E., “The Rose model, revisited,” J. Opt. Soc. Am. A Opt. Image Sci. Vis. 16(3), 633–646 (1999). 10.1364/JOSAA.16.000633 [DOI] [PubMed] [Google Scholar]
- Burgess A. E., Jacobson F. L., and Judy P. F., “Human observer detection experiments with mammograms and power-law noise,” Med. Phys. 28(4), 419–437 (2001). 10.1118/1.1355308 [DOI] [PubMed] [Google Scholar]
- Maidment A. D., Fahrig R., and Yaffe M. J., “Dynamic range requirements in digital mammography,” Med. Phys. 20(6), 1621–1633 (1993). 10.1118/1.596949 [DOI] [PubMed] [Google Scholar]
- Rose A., “A unified approach to the performance of photographic film, television pickup tubes and the human eye,” J. Soc. Motion Pict. Eng. 47, 273–294 (1946). [Google Scholar]
- Rose A., “The sensitivity performance of the human eye on an absolute scale,” J. Opt. Soc. Am. 38(2), 196–208 (1948). 10.1364/JOSA.38.000196 [DOI] [PubMed] [Google Scholar]
- Boone J. M., “Normalized glandular dose (DgN) coefficients for arbitrary x-ray spectra in mammography: Computer-fit values of Monte Carlo derived data,” Med. Phys. 29(5), 869–875 (2002). 10.1118/1.1472499 [DOI] [PubMed] [Google Scholar]
- Siewerdsen J. H., Moseley D. J., Bakhtiar B., Richard S., and Jaffray D. A., “The influence of antiscatter grids on soft-tissue detectability in cone-beam computed tomography with flat-panel detectors,” Med. Phys. 31(12), 3506–3520 (2004). 10.1118/1.1819789 [DOI] [PubMed] [Google Scholar]
- J. T.DobbinsIII and Godfrey D. J., “Digital x-ray tomosynthesis: Current state of the art and clinical potential,” Phys. Med. Biol. 48(19), R65–R106 (2003). 10.1088/0031-9155/48/19/R01 [DOI] [PubMed] [Google Scholar]
- Lange K. and Fessler J. A., “Globally convergent algorithms for maximum a posteriori transmission tomography,” IEEE Trans. Image Process. 4(10), 1430–1438 (1995). 10.1109/83.465107 [DOI] [PubMed] [Google Scholar]


