

Abstract
Aims The aim of this study was to use a sensitive method to screen and quantify 57 Vibrionaceae strains for the production of acyl-homoserine lactones (AHLs) and map the resulting AHL profiles onto a host phylogeny.
Methods and Results We used a high-performance liquid chromatography–tandem mass spectrometry (HPLC-MS/MS) protocol to measure AHLs in spent media after bacterial growth. First, the presence/absence of AHLs (qualitative analysis) was measured to choose internal standard for subsequent quantitative AHL measurements. We screened 57 strains from three genera (Aliivibrio,Photobacterium and Vibrio) of the same family (i.e. Vibrionaceae). Our results show that about half of the isolates produced multiple AHLs, typically at 25–5000 nmol l−1.
Conclusions This work shows that production of AHL quorum sensing signals is found widespread among Vibrionaceae bacteria and that closely related strains typically produce similar AHL profiles.
Significance and Impact of the Study The AHL detection protocol presented in this study can be applied to a broad range of bacterial samples and may contribute to a wider mapping of AHL production in bacteria, for example, in clinically relevant strains.
Keywords: acyl-homoserine lactones, AHLs, HPLC-MS/MS, quorum sensing, Vibrionaceae
Introduction
Bacterial cells produce and excrete small molecules into their surroundings to control a number of cellular processes (Ng and Bassler 2009), such as bioluminescence (Meighen 1994), swarming (Eberl et al. 1996), biofilm formation, plasmid conjugal transfer (Fuqua et al. 1994), production of exo-enzyme virulence determinants in pathogens (Jones et al. 1993), antibiotic biosynthesis (Lowery et al. 2009), iron chelation (Kaufmann et al. 2005) and fouling (Cuadrado-Silva et al. 2013). There are currently at least two alternative hypotheses for this behaviour (West et al. 2012): (i) quorum sensing (QS), which assumes that the produced molecules are used as signals for cell–cell communication (i.e. a social trait), and (ii) diffusion sensing (DS), which assumes that the produced molecules are used to monitor the rate of diffusion (i.e. the relative speed of molecules that move away from the cell).
Among the different types of such molecules that are produced in bacteria (i.e. autoinducers) the N-acyl-homoserine lactones (AHLs) are well studied (Savka et al. 2011). AHLs were first studied in Aliivibrio fischeri (Eberhard et al. 1981), and the bacterium remains a model system for current QS studies (Romero-Campero and Perez-Jimenez 2008). In A. fischeri, AinS (a homologue of LuxM in Vibrio harveyi) is responsible for the production of C8-homoserine lactone (HSL), whereas LuxI is responsible for the production of 3-oxo-C6-HSL and C6-HSL (Kuo et al. 1994). AHL concentrations in bacterial surroundings vary. The squid symbiont A. fischeri produces 100 nmol l−1 within the squid (Boettcher and Ruby 1995) compared to 0·01–7400 nmol l−1 when grown in vitro (Stabb et al. 2008). Detected AHL levels in cultures of Pseudomonas aeruginosa grown in vitro are 1–10 μmol l−1, whereas 600 μmol l−1 is detected in biofilms (Teplitski et al. 2011). Lower concentrations of AHL have been detected from mucopurulent respiratory secretions (0·5 pmol l−1–66·5 nmol l−1) and infected lung tissue (66 fmol g−1–146 pmol g−1) (Favre-Bonté et al. 2002; Chambers et al. 2005).
Several bioassays have been used to detect and quantify AHLs. In these assays, the presence of AHL compounds induces phenotypic changes (e.g. bioluminescence or β-galactosidase activity). Bioassays based on Agrobacterium tumefaciens and the β-galactosidase reporter system (Cha et al. 1998) are triggered by 3-oxo-HSL-induction of the β-galactocidase, and it was recently shown that A. tumefaciens was able to detect AHLs as low as 2–14 pmol l−1 (Baldrich et al. 2011). A second assay based on Chromobacterium violaceum produces the purple compound violacein in the presence of short AHLs with no substitutions on the C3 carbon on the acyl chain (McClean et al. 1997). Bacterial extracts separated by thin-layer chromatography (TLC) before subjection to a biosensor assay may further discriminate between different AHL types (Ravn et al. 2001).
Mass spectrometry (MS) in combination with either gas chromatography (GC) or liquid chromatography (LC) can both be used for detecting and quantifying AHLs. Although GC-MS has the advantage of being a rapid, simple and selective method, it is also associated with unwanted degradation of AHLs during the analysis, which results in low sensitivity (Osorno et al. 2012). LC-MS is particularly useful in identifying/quantifying particular molecules in a mixture of different chemicals (Wang et al. 2011). The technique has undergone significant development with respect to quantification levels with the utilization/refinement of, for example, nano-LC (Frommberger et al. 2004; Fekete et al. 2007) and Fourier transform ion cyclotron resonance MS (Cataldi et al. 2009, 2013). Although the required volume of samples has declined, it still has remained relatively high. The first AHL study used 6-l sample volumes for extraction of AHLs (Eberhard et al. 1981); later it was reduced to 500 ml (Shaw et al. 1997), 20 ml (Yates et al. 2002) and 500 μl (Frommberger et al. 2004). In this work, we have used 75-μl sample volume, with a sample processing rate on the LC-MS machine at >200 samples per day. We also wanted to make the method affordable, so isotopically labelled internal standards were excluded.
The Vibrionaceae family consists of Gram-negative marine bacteria, many of which are responsible for diseases in humans (Valiente et al. 2009) and marine animals (Milton 2006), and AHLs of QS systems likely play important roles in pathogenesis (Hentzer and Givskov 2003; Rasch et al. 2004; Nhan et al. 2010). In this study, we used a high-performance liquid chromatography–tandem mass spectrometry (HPLC-MS/MS) protocol in selective reaction monitoring (SRM) mode for determining the presence/absence (qualitative analysis) and concentrations of fifteen different AHLs and applied this method to spent media. We tested our method on A. fischeri ES114 to compare with previous data (Lupp and Ruby 2004; Stabb et al. 2008). We screened 7 Vibrio, 5 Photobacterium and 45 Aliivibrio isolates and included among others Vibrio anguillarum,Vibrio splendidus, Aliivibrio salmonicida, A. fischeri,Aliivibrio wodanis,Aliivibrio logei and Photobacterium phosphoreum. AHL measurements were finally mapped onto a host phylogeny to evaluate whether closely related species and strains produce similar AHL profiles.
Materials and methods
Chemicals and AHL standard mixture
The AHL standards N-3-oxo-butyryl-l-homoserine lactone (3-oxo-C4-HSL), N-3-hydroxy-butyryl-l-homoserine lactone (3-OH-C4-HSL), N-3-hydroxy-hexanoyl-l-homoserine lactone (3-OH-C6-HSL), N-3-hydroxy-octanoyl-l-homoserine lactone (3-OH-C8-HSL) and N-3-hydroxy-decanoyl-l-homoserine lactone (3-OH-C10-HSL) were purchased from University of Nottingham, UK, whereas N-butyryl-dl-homoserine lactone (C4-HSL), N-hexanoyl-l-homoserine lactone (C6-HSL), N-3-oxo-hexanoyl-l-homoserine lactone (3-oxo-C6-HSL), N-octanoyl-l-homoserine lactone (C8-HSL), N-3-oxo-octanoyl-l-homoserine lactone (3-oxo-C8-HSL), N-decanoyl-dl-homoserine lactone (C10-HSL), N-3-oxo-decanoyl-l-homoserine lactone (3-oxo-C10-HSL), N-dodecanoyl-dl-homoserine lactone (C12-HSL), N-3-oxo-dodecanoyl-l-homoserine lactone (3-oxo-C12-HSL), N-3-hydroxy-dodecanoyl-dl-homoserine lactone (3-OH-C12-HSL) and ethyl acetate were purchased from Sigma-Aldrich. HPLC-grade acetonitrile (LiChrosolv) and formic acid were purchased from Merck. The AHL standard mixture contained approximately 600–1200 nmol l−1 of each AHL in 0·1% formic acid.
Bacterial growth
Aliivibrio fischeri ES114 was revived from a cryopreserved glycerol stock in 2 ml lysogeny broth (LB; 1 l contains 10 g bacto-tryptone, 5 g yeast extract and 10 g NaCl) supplied with 2·5% w/v sodium chloride (LB25; 1 l contains 10 g bacto-tryptone, 5 g yeast extract and 25 g NaCl) at 12°C, 200 rpm (Infors – Incubator Shaker Multitron II) for 24–48 h. Experimental cultures were further expanded at 12, 22 and 30°C, initiated by inoculating 50 ml of LB25 or sea water tryptone (SWT; 1 l contains 5 g bacto-tryptone, 3 g yeast extract, 3 ml glycerol, 700 ml filtered sea water and volume made to 1000 ml with filtered water) in 250-ml baffled flasks. When using SWT during the initial study, samples were collected at several optical densities, whereas when using LB25 during the screening, the culture was harvested after 50 h of growth and treated as described below.
Strains listed in Table 1 were grown in duplicates at 12°C in LB25 (as described above). The new strains reported in this study are from an in-house bacterial collection. Starting cultures were inoculated at OD600 0·001 and harvested after 50 h of growth. Samples were centrifuged at 1400 g in a Beckman Coulter Allegra X-15R tabletop centrifuge with SX4750A rotor for 20 min at 4°C. Four 75-μl aliquots (technical replicates) were acidified with 4 μl 1 mol l−1 hydrochloric acid to a final concentration of 51 mmol l−1 and stored at −20°C. One replicate was used for qualitative analysis, and the remaining three were used for quantitative analysis (described below).
Table 1.
Bacterial species tested for AHL production
| Genera; species | Strain | Origin | GenBank | Reference |
|---|---|---|---|---|
| Aliivibrio | ||||
| A. fischeri | ES114 | Euprymna scolopes | FJ464360 | Gutierrez et al. (2009) |
| A. logei | 03/SES-5 | Gadus morhua | JQ361740 | This study |
| A. logei | 03/SES-1 | Gadus morhua | JQ361739 | This study |
| A. logei | ATCC 29985 | Gut of Mytilus edulis (arctic mussel) | EU221273 | Ast et al. (2009) |
| A. logei | 90/1667 | Salmo salar | JQ361738 | This study |
| A. salmonicida | LFl1238 | Salmo salar | FM178379 | Hjerde et al. (2008) |
| A. salmonicida | NCIMB 2262 (T) | Farmed Salmo salar, Norway | EU257756 | Brevik et al. (2007) |
| Aliivibrio sp. | R5-43 | Gersemia rubiformis (soft coral) | JQ340770 | This study |
| Aliivibrio sp. | R5-42 | Gersemia rubiformis (soft coral) | JQ361697 | This study |
| Aliivibrio sp. | R8-70 | Eurythenes gryllus (Amphipoda) | JQ361698 | This study |
| Aliivibrio sp. | R8-66 | Eurythenes gryllus (Amphipoda) | JQ361699 | This study |
| Aliivibrio sp. | R8-65 | Eurythenes gryllus (Amphipoda) | JQ361700 | This study |
| Aliivibrio sp. | R8-61 | Eurythenes gryllus (Amphipoda | JQ361701 | This study |
| Aliivibrio sp. | R8-69 | Eurythenes gryllus (Amphipoda) | JQ361702 | This study |
| Aliivibrio sp. | R8-68 | Eurythenes gryllus (Amphipoda) | JQ361703 | This study |
| Aliivibrio sp. | B8-7 | Eurythenes gryllus (Amphipoda) | JQ361704 | This study |
| Aliivibrio sp. | R8-63 | Eurythenes gryllus (Amphipoda) | JQ361705 | This study |
| Aliivibrio sp. | R8-67 | Eurythenes gryllus (Amphipoda) | JQ361706 | This study |
| Aliivibrio sp. | R8-64 | Eurythenes gryllus (Amphipoda) | JQ361707 | This study |
| Aliivibrio sp. | MR17-66 | Styela rustica (Ascidiacea) | JQ361710 | This study |
| Aliivibrio sp. | MR17-80 | Porifera indet | JQ361711 | This study |
| Aliivibrio sp. | MR17-77 | Porifera indet | JQ361712 | This study |
| Aliivibrio sp. | MR17-69 | Styela rustica (Ascidiacea) | JQ361713 | This study |
| Aliivibrio sp. | MR17-34 | Laminaria sp. | JQ361714 | This study |
| Aliivibrio sp. | MR17-70 | Styela rustica (Ascidiacea) | JQ361715 | This study |
| Aliivibrio sp. | B9-15 | Dendrodoa aggregata (Ascidiacea) | JQ361716 | This study |
| A. wodanis | 89/5532 | Salmo salar | JQ361718 | This study |
| A. wodanis | 90/325 | Salmo salar | JQ361719 | This study |
| A. wodanis | 02/569 | Salmo salar | JQ361720 | This study |
| A. wodanis | 02/382 | Salmo salar | JQ361721 | This study |
| A. wodanis | 01/401 | Salmo salar | JQ361722 | This study |
| A. wodanis | 88/441 (T) | Salmo salar | JQ361723 | This study |
| A. wodanis | 06/194-A | Salmo salar | JQ361724 | This study |
| A. wodanis | 06/194-B | Salmo salar | JQ361725 | This study |
| A. wodanis | 06/139 | Salmo salar | JQ361726 | This study |
| A. wodanis | 06/170 | Salmo salar | JQ361727 | This study |
| A. wodanis | 96/688 | Salmo salar | JQ361728 | This study |
| A. wodanis | 03/160 | Salmo salar | JQ361729 | This study |
| A. wodanis | 06/178 | Oncorhynchus mykiss | JQ361731 | This study |
| A. wodanis | 04/17347 | Gadus morhua | JQ361730 | This study |
| A. wodanis | SR6 | Sepiola robusta | EU185827 | Ast et al. (2009) |
| A. wodanis | SA12 | Sepiola affinis | EU185826 | Ast et al. (2009) |
| A. wodanis | ATCCBAA104 (T) | Salmo salar | EU257757 | Brevik et al. (2007) |
| Photobacterium | ||||
| P. phosphoreum | SP001 | Gut of Cebidichthys violaceus (Family Stichaeidae) | JX312085 | This study |
| P. phosphoreum | SP002 | Gut of Lycodes eudipleurostictus | JX312086 | This study |
| P. phosphoreum | SP004 | Gut of Cottunculus microps | JX312087 | This study |
| P. phosphoreum | SP005 | Gut of Onogadus argentatus | JX312088 | This study |
| Photobacterium sp. | SP0044 | Marine sediment | JX312089 | This study |
| Vibrio | ||||
| V. anguillarum | NB10 | Gadus morhua | DQ068933 | Rehnstam et al. (1989), Eiler and Bertilsson (2006) |
| Vibrio sp. | B9-25 | Halichondria sp. (demosponge) | JQ361717 | This study |
| V. splendidus | 03/122 | Hippoglossus hippoglossus | JQ361735 | This study |
| V. splendidus | 00/860 | Labrus mixtus | JQ361736 | This study |
| V. splendidus | 02/066 | Gadus morhua | JQ361733 | This study |
| V. splendidus | 04/276 | Gadus morhua | JQ361734 | This study |
| V. splendidus | 02/14916 | Gadus morhua | JQ361732 | This study |
| V. splendidus | LMG 19031 (T) | Gadus morhua | EF094892 | Gomez-Gil et al. (2006) |
| V. tapetis | 99/196 | Oncorhynchus mykiss | JQ361737 | This study |
T, type strain; ATCC, American Type Culture Collection; LMG, Belgium Co-ordinated Collection of Micro-organisms, Laboratorium voor Microbiologie, Universiteit Gent, Belgium; NCIMB, National Culture of Industrial, Marine and Food Bacteria, Aberdeen, Scotland.
Escherichia coli ArcticExpress (DE3) was grown overnight at 30°C in LB medium.
Sample preparation and HPLC-MS/MS analysis
The concentration of AHLs in spent media was measured as follows: AHLs were extracted from spent media and compared to commercial AHL standards with known concentrations which were extracted from fresh media using the same extraction protocol, as described below. Hence, it was the relative relationships between measured AHLs from spent media and the corresponding values from commercial AHLs that were used to calculate the final AHL concentrations in samples.
Four acidified 75-μl technical replicates, which were collected at each time point or OD, were each subjected to three consecutive extractions with three volumes (225 μl) of ethyl acetate. The ethyl acetate phase from the three extractions was pooled (675 μl) and dried using a rotary vacuum centrifuge (savant instruments Inc. model PH40-11), and samples were finally stored at −20°C for subsequent HPLC-MS/MS analysis. One technical replicate was redissolved in 150 μl of 20% acetonitrile with 0·1% formic acid for qualitative HPLC-MS/MS analysis. Similarly, three technical replicates were redissolved in 20% acetonitrile with 0·1% formic acid, which contained a fixed amount of an internal AHL standard [100 ng/ml (i.e. 330–400 nmol l−1 depending on the molecular weight of the AHL]. HPLC was performed by separating 20 μl of the 150 μl from each sample on a Hypersil GOLD C18 reverse-phase column (50 × 2·1 mm, 1·9 μm particle size; Thermo Fisher Scientific, Waltham, MA, USA) equilibrated with 5% acetonitrile, using a Accela autosampler and pump (Thermo Fisher Scientific). Mobile phase was 0·1% formic acid in water and 0·1% formic acid in HPLC-grade acetonitrile, and these were used to create the following gradient elution profile: 5% acetonitrile for 18 s, a linear increase in acetonitrile to 90% over 162 s and then isocratic 90% acetonitrile for 60 s. Then in next 60 s, the column was equilibrated with 5% acetonitrile. The column was then re-equilibrated for 60 s with 5% acetonitrile before the next sample injection. The flow rate was 500 μl min−1 for all steps, and the column was kept at 30°C for all separations.
The HPLC-separated compounds were introduced into the Ion Max electrospray ionization probe of the LTQ Orbitrap XL machine (Thermo Fisher Scientific). The probe was equipped with a 32-gauge stainless steel needle. Nitrogen was used for all type of gasses in the ion source. Electrospray settings were as follows: sheath gas flow rate 70, auxiliary gas flow rate 10, sweep gas flow rate 10, spray voltage +4·50 kV, capillary temperature 330°C, capillary voltage 40 V and tube lens 90 V. The protonated parent ions from the electron spray were next selected and fragmentized with CID using LTQ (Linear Ion Trap Quadrupole) tandem MS in SRM mode under positive ion conditions. When subjected to tandem MS, all AHLs are broken down to the same fragment with the theoretical value m/z 102·055. This fragment contains only the head (lactone) of the AHL (see Fig. 1). CID parameters during tandem MS were as follows: isolation width = 1·7, normalized collision energy = 30, act Q = 0·250 and act time = 30 ms for all components. Maximum injection time was 25 ms, and automatic gain control (AGC) target setting is 1·00E+04 ions.
Figure 1.
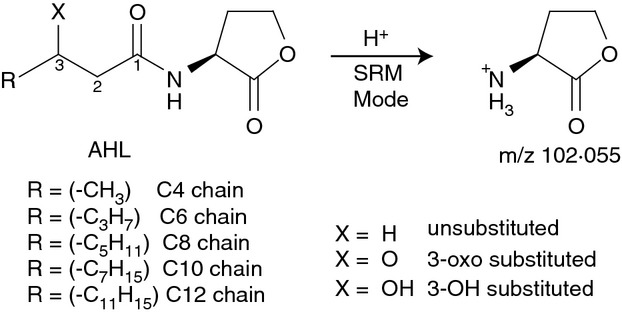
Basic chemical structure of AHLs and their fragmentation products produced during tandem MS in SRM mode. Chain lengths of AHLs screened in this study were from C4 to C12 with an increment of two carbons. Functional groups of the third carbon were 3-oxo, 3-OH or unsubstituted.
SRM mode involves selecting a parent ion and breaking it with a constant energy to give fragment ions. One such parent–fragment pair is called an SRM transition. To minimize the number of simultaneous SRM transitions and maximize the number of data points over each peak, the data collection window was divided into 6 segments (for details see Table S1). Data were collected from m/z 101–103. Ion chromatograms were extracted from the raw data files from m/z 101·8–102·6 for each compound (see Fig. S1 for typical ion chromatograms). The peaks were automatically integrated with optimized integration settings for each compound using Thermo Excalibur 2·07. For the entire study, one-point calibration was used (instead of using standard curves), as previously described (Peters and Maurer 2007). One-point calibration was used for each purchased standard AHL. Calibration was performed in triplicates for each sample run, in same growth media as in samples.
In quantitative analyses, an internal standard was added to all biological samples and AHL standard mixture in equal amount to correct for deviations in injection volume of the autosampler and to correct for changes in the instrument sensitivity. 3-oxo-C12-HSL, 3-OH-C12-HSL, C10-HSL and C12-HSL were chosen as internal standards depending on the test sample. The AHL standard mixture was made fresh for each run.
The limit of detection (LOD) and limit of quantification (LOQ) were determined (LOQs listed in Table 2) from the mix of synthetic AHLs serially diluted into growth medium to a minimum concentration of 0·2 nmol l−1, extracted and subjected to HPLC-MS/MS analysis. LOD was defined as the lowest AHL concentration where the signal-to-noise ratio was ≥ 3 : 1 (MacDougall et al. 1980), and LOQ was theoretically set to LOD multiplied by 3·33 (Thomsen et al. 2003).
Table 2.
Limit of AHL quantification for HPLC-MS/MS (SRM) method
| AHLs | LOQ (nmol l−1) LB25 | LOQ (nmol l−1) SWT | LOQ (nmol l−1) LB | LOQ (nmol l−1) H2O |
|---|---|---|---|---|
| C4-HSL | 12·92 | 12·92 | 12·92 | 12·92 |
| 3-oxo-C4-HSL | 20·06 | 11·27 | 20·06 | 6·33 |
| 3-OH-C4-HSL | 19·85 | 11·15 | 19·85 | 19·85 |
| 3-OH-C6-HSL | 5·99 | 3·20 | 5·99 | 3·37 |
| 3-oxo-C6-HSL | 10·35 | 3·27 | 5·82 | 5·82 |
| C6-HSL | 3·06 | 1·63 | 3·06 | 3·06 |
| 3-oxo-C8-HSL | 9·37 | 5·01 | 9·37 | 5·27 |
| 3-OH-C8-HSL | 2·98 | 2·68 | 2·98 | 1·67 |
| C8-HSL | 3·23 | 1·81 | 3·23 | 1·81 |
| 3-oxo-C10-HSL | 2·54 | 2·54 | 2·54 | 2·54 |
| 3-OH-C10-HSL | 1·57 | 0·88 | 0·88 | 0·88 |
| C10-HSL | 1·58 | 2·82 | 1·58 | 0·89 |
| 3-OH-C12-HSL | 1·35 | 1·35 | 2·40 | 0·76 |
| 3-oxo-C12-HSL | 1·29 | 4·08 | 1·29 | 4·08 |
| C12-HSL | 4·80 | 1·51 | 1·51 | 1·51 |
AHL, Acyl-homoserine lactones; LOQ, limit of quantification.
Calculated as 3·33 times of LOD values (signal-to-noise ratio better than 3:1), practically its values with signal-to-noise ratio are greater than 10:1.
Phylogenetic analysis
The host phylogeny was based on 16S rDNA sequences from forty-five Vibrionaceae strains, and Photorhabdus luminescens and Grimontia hollisae were used as the out-group. Available 16S rDNA sequences were obtained from GenBank, and for the remaining strains, 16S rDNA was PCR-amplified and sequenced. Accession numbers are provided in Table 1. The partial 16S rDNA sequences were aligned automatically by ClustalW (Larkin et al. 2007) and manually edited in BioEdit v.7·0·9 (Hall 1999). Sequence positions that could be reliably aligned were used, and the final alignment consisted of 852 nucleotide positions and 45 sequences (Dataset S1). The phylogenetic tree was constructed in MEGA v.5.03 (Tamura et al. 2011) using the neighbour-joining (NJ) method and the maximum composite likelihood substitution model. Stability of nodes was tested with a NJ bootstrap analysis (maximum composite likelihood model and 10 000 pseudo-replicates).
Results
AHL detection method
HPLC followed by tandem MS in SRM mode was used to measure concentrations of AHLs. As a standard protocol, HPLC was run with 5 min from injection to elution and 1-min column equilibration before next injection. To minimize the number of simultaneous SRM transitions and maximize the number of data points over each peak, the data collection window was divided into 6 segments (for details see Table S1).
Before running biological samples, we first determined the LOD and LOQ. A mix of synthetic AHLs was serially diluted in water or growth medium (LB, LB25 or SWT) to a minimum concentration of 0·2 nmol l−1, extracted and subjected to our HPLC-MS/MS protocol (see Material and methods). Three replicates were performed for each test concentration. LOD was defined as the lowest AHL concentration where the signal-to-noise ratio was ≥ 3 : 1 (MacDougall et al. 1980), and LOQ was theoretically set to LOD multiplied by 3·33 (Thomsen et al. 2003). Table 2 shows the LOQ values. For C4-chained AHLs and longer-chained AHLs, LOQ ranged between 6·33–20·06 and 0·76–10·35 nmol l−1, respectively. In other words, to reliably quantify, for example, C4-chained AHLs, the AHL concentration in a sample must be ≥ 6·33–20·06 nmol l−1 depending on which medium is used.
Next, the linearity of AHL measurements was tested over a broad range of concentrations (15–3000 nmol l−1), in water or same media as described above. Measurements were plotted, and resulting R2 values between 0·9781 and 0·9996 (for LB, LB25, SWT media and H2O – only LB25 data are shown in Fig. S2) demonstrated linear relationships between expected AHL concentrations and experimental measurements. Accuracy (i.e. deviation from the true value) was determined by adding 14 synthetic AHLs (C10-HSL was arbitrarily chosen as the internal standard) at three different concentration ranges (15–30, 900–1800 and 1300–2700 nmol l−1) to a supernatant of Escherichia coli ArcticExpress (DE3) overnight culture (Table S2). Samples were subjected to HPLC-MS/MS. This strain was chosen because it does not carry AHL-producing enzymes (Van Houdt et al. 2006). The majority of values were within 10% of the expected concentrations, with three exceptions in lowest concentration range (15–30 nmol l−1), that is, C4-HSL (expected/detected=31 : 42 nmol l−1), 3-OH-C6-HSL (25 :22 nmol l−1) and 3-OH-C8-HSL (23 : 16 nmol l−1). Similarly, there were two deviations above 10% for medium and higher concentration ranges, that is, 3-OH-C4-HSL (1568 : 1410 and 2352 : 2028 nmol l−1) and 3-oxo-C6-HSL (2180 : 1860 nmol l−1). We suspect that major contributors to these variations are measurement errors (especially at low AHL concentrations) and degradation of the analytical standards. Measurement errors would include variations between technical replicates (random error) and lowered accuracy because all AHLs are compared to one single internal standard (systematic error). The most important systematic error in electrospray MS is the phenomenon known as ion suppression, where matrix components eluting at the same time as the analyte suppress the signal of the analyte. Random errors could be minimized by increasing the number of replicates. Ion suppression could be minimized by several approaches like better sample preparation, running standards in the exact same matrix as the analyte (performed as close as possible), altered chromatographic profile, diluting the sample, changing the mobile phase's organic solvent, spiking the sample with standards (time-consuming) and so on. The best method is likely to use one stable isotopically labelled internal standard (SIL) for each AHL. The SIL should preferably have the exact same retention time as the analyte to be exposed to the same random spray variations and ion suppression effects. Deuterium labelling might give slightly different retention times, therefore 13C-, 15N- or 17O-labelled standards are preferred. These are, however, usually unavailable or very expensive.
Finally, the precision (as relative standard deviation) of the method was calculated using the same data as described above, to test the reproducibility of the detected value (Table S2). Precision ranged between 0·1 and 13·0% with four values above 10%, that is, 3-oxo-C4-HSL (13%), 3-oxo-C6-HSL (12%), 3-OH-C8-HSL (11%) and 3-OH-C4-HSL (10%). This shows that results were, in general, reproducible (or precise) between replicate measurements and that AHLs were successfully recovered from bacterial culture supernatants in a reproducible fashion.
AHLs in Aliivibrio fischeri ES114
Next we wanted to test our method using the model bacterium A. fischeri ES114 and compare AHL measurements with previous results (Stabb et al. 2008). For cultivation of A. fischeri ES114, we chose SWT medium and three different temperatures, that is, 12, 22 and 30°C. For each temperature, two cultures (biological replicates) were started at OD600 0·05, and samples were collected at different optical densities. Using 3-oxo-C12-HSL as internal standard [based on qualitative HPLC-MS/MS (SRM) analysis], the concentration of individual AHLs from the resulting growth culture supernatants was measured in triplicates. Table 3 shows the result which suggests that A. fischeri ES114 typically contains six AHLs (when grown in SWT medium) above LOQ, with highest concentrations of 3-oxo-C6-HSL and C8-HSL. Interestingly, the 3-oxo-C6-HSL profile was highly dependent on temperature. For example, at 12°C, 3-oxo-C6-HSL was found at 670 ± 120 and 1380 ± 320 nmol l−1, at OD600 ∼0·5 and ∼1·0, respectively, but was found below LOQ when cells were grown at 30°C (although below LOQ, our measurements suggest approx. 0·15 nmol l−1 at OD600 ∼1·5, data not shown). In contrast, concentrations of C8-HSL appeared less dependent on temperature. Other AHLs that were detected above LOQ include C4-HSL, C6-HSL, 3-OH-C8-HSL and C10-HSL.
Table 3.
AHL concentrations in spent media from Aliivibrio fischeri ES114
| Sample (OD600) | Temp | C4-HSL (nmol l−1) | 3-oxo-C6-HSL (nmol l−1) | C6-HSL (nmol l−1) | 3-OH-C8-HSL (nmol l−1) | C8-HSL (nmol l−1) | C10-HSL (nmol l−1) | Reference |
|---|---|---|---|---|---|---|---|---|
| 0·49 ± 0·03 | 12°C | 62 ± 2 | 670 ± 120 | 22 ± 4 | – | 80 ± 20 | – | This study |
| 1·00 ± 0·02 | 12°C | 79 ± 4 | 1380 ± 320 | 75 ± 5 | 5·9 ± 0·7 | 810 ± 50 | 17 ± 1 | This study |
| 0·66 ± 0·00 | 22°C | 68 ± 2 | 20 ± 3 | 2·80 ± 0·30 | – | 52 ± 3 | – | This study |
| 1·65 ± 0·05 | 22°C | 81 ± 3 | 100 ± 45 | 12 ± 1 | 5·1 ± 0·5 | 242 ± 18 | 5·2 ± 0·3 | This study |
| 2·5 ± 0·1 | 22°C | 96 ± 7 | 190 ± 82 | 34 ± 2 | 14 ± 2 | 744 ± 120 | 15 ± 2 | This study |
| 1·16 ± 0·08 | 30°C | 65 ± 8 | – | 2·7 ± 0·3 | – | 91 ± 6 | 2·3 ± 0·3 | This study |
| 1·56 ± 0·02 | 30°C | 70 ± 8 | – | 4·8 ± 0·2 | – | 160 ± 10 | 4·1 ± 0·4 | This study |
| 0·5 | ? | 0·01 | 35 | Stabb et al. (2008) | ||||
| 1·5 | ? | 0·1 | 1100 | Stabb et al. (2008) | ||||
| 2·8 | ? | 0·2 | Stabb et al. (2008) | |||||
| ∼0·5 | 28°C | ∼2 | Lupp and Ruby (2004) | |||||
| ∼1·5 | 28°C | ∼20 | Lupp and Ruby (2004) | |||||
| ∼3·5 | 28°C | ∼80 | Lupp and Ruby (2004) |
The tandem MS SRM method was used for quantitative analysis with internal standard (3-oxo-C12-HSL). Values are given as nmol l−1 of AHLs calculated against one-point calibration of known standards. Two parallel colonies were grown and harvested at different optical densities.
Tested samples were grown at 12, 22 and 30°C in SWT medium. Cultures were grown from OD600 0·05. –, values below LOQ. ?, unknown growth temperature.
Ruby and co-workers (Stabb et al. 2008) reported two AHLs in A. fischeri ES114, that is, 3-oxo-C6-HSL and C8-HSL. 3-oxo-C6-HSL was measured at 0·01, 0·1 and 0·2 nmol l−1 at OD595 0·5, 1·5 and 2·8, respectively, which is very similar to what we found at 30°C, but several orders of magnitude lower than our measurements at 12 and 22°C. Furthermore, Stabb et al., reported C8-HSL at 35 nmol l−1 at OD595 0·5, which is in close agreement with our measurement (80 ± 20 and 53 ± 3 at 12 and 22°C, respectively), but at OD595 = 1·5, C8-HSl was measured at 1100 nmol l−1. Lupp and Ruby (Lupp and Ruby 2004) measured C8-HSL using a bioassay, also using A. fischeri ES114. After growth in SWT medium at 28°C, they reported approximately 2, 20 and 80 nmol l−1 at OD600 ∼0·5, ∼1·5 and ∼3·5. In summary, we conclude that A. fischeri ES114 may contain six different AHLs, typically with 3-oxo-C6-HSL and C8-HSL at highest concentrations. Measurements of 3-oxo-C6-HSL and C8-HSL appear to be in general agreement with previous data (Lupp and Ruby 2004; Stabb et al. 2008), although the concentration of AHLs can greatly vary depending on growth parameters.
Screening of 57 Vibrionaceae strains for AHL production
Following the results from A. fischeri ES114, we screened an additional 56 Vibrionaceae strains, which were grown in two biological replicates in LB25 at 12°C and harvested after 50 h of growth. LB25 was used for convenience and because this medium could support growth of all tested strains. (The majority of tested strains are of Arctic or sub-Arctic marine origin.) AHLs were measured in three technical replicates per biological replicate using our HPLC-MS/MS protocol, and AHL concentrations were compared to known standards. Variations between biological replicates were generally low (Table S3). For simplicity, the final AHL measurements were organized into three categories, that is, ‘high’ (>5000 nmol l−1), ‘medium’ (25–5000 nmol l−1) and ‘low’ (<25 nmol l−1) and mapped accordingly onto a 16S rDNA host phylogeny (Fig. 2). Data from 24 strains are presented, whereas the remaining 33 were excluded from the figure because of redundancy in the data (listed in Table S4). Twenty-one nontested strains were included in the tree as reference strains to increase the phylogenetic diversity in the data set.
Figure 2.

Detected AHLs mapped onto a 16S rDNA ML phylogeny. Bootstrap values above internal nodes were calculated using the NJ method and the maximum composite likelihood model. Clades containing strains that were tested for AHL production are named Clades I–VI. GenBank accession numbers are shown in brackets for species that were added to increase the phylogenetic diversity in the tree. Numbers in parentheses to the left of Clades I–VI denote the number of strains in each clade that were tested, but excluded from the final tree because of redundancy in the data. Asterisks denote strains that grew slowly with a final OD600=0·1 when harvested after 50 h of growth. Complete list of results is shown in Table S3. Concentrations of AHLs are grouped into four categories: ‘high’ >5 μmol l−1 (+++), ‘medium’ 25–5000 nmol l−1 (++), ‘low’<25 nmol l−1 (+) and values below LOQ (-).
Figure 2 shows that (i) tested strains (except Aliivibrio wodanis SA12) group into one of six phylogenetically distinct clades (named Clades I–VI), and (ii) half (12 strains) produce multiple AHLs, two strains produce two AHLs, four strains produce one AHL, and we were unable to detect AHL in six (nine in total of 57; see Table S4).
All representatives of Clade I produce 8–11 different AHLs, with 3-oxo-C6-HSL in ‘high’ quantities. A. wodanis SA12 is placed immediately outside of Clade I, but shows an AHL profile that resembles those of Clade I. In Clade II, A. fischeri ES114 was the only representative tested, and detectable levels of 5 AHLs were identified. This contrasts the earlier finding when using SWT medium where we found six AHLs (C4-HSL was below LOQ when grown in LB25). Clade III represents a group of A. wodanis strains that produce ‘medium’ amount of 3-OH-C10-HSL, except for A. wodanis 01/401, which also produces ‘medium’ amount of C8-HSL. Clade IV represents two Aliivibrio strains (Aliivibrio R8-63 and Aliivibrio R8-67) that are phylogenetically distinct from other Aliivibrio species and have no apparent AHL production. Several representatives from the Vibrio genus were grouped into Clade V and show somewhat different AHL profiles. Specifically, no AHLs were detected in two members, that is, Vibrio sp. B9-25 and V. tapetis 99/196. However, it should be noted that the B9-25 strain grew slowly and had only reached an OD of 0·1 at the time of measurement. Vibrio splendidus LMG 19031 was found to produce one AHL, that is, ‘high’ quantities of 3-OH-C4-HSL, V. splendidus 02/066 produced C4-HSL and 3-OH-C4-HSL, and the remaining two strains produced multiple AHLs. Vibrio anguillarum NB10 produced 3-OH-C6-HSL (‘medium’), 3-oxo-C10-HSL (‘medium’) and 3-OH-C10-HSL (‘low’). This is in overall agreement with earlier findings (Milton et al. 2001; Buchholtz et al. 2006). Photobacteria formed Clade VI, and none of these produced AHLs above LOQ. A complete list of quantitative measurements is shown in Table S4.
Discussion
We have used a sensitive HPLC-MS/MS method and AHL standards to first detect (qualitative analysis) and then quantify (with an appropriate internal standard) the presence of fifteen different AHLs in 57 different Vibrionaceae strains, five, seven and 45 of which belong to the Photobacterium,Vibrio and Aliivibrio genera, respectively. AHL quantification was mapped onto a host phylogeny tree. Typically, closely related strains produced similar AHL profiles, but different profiles were also found among closely related strains (e.g. Vibrio splendidus).
HPLC-MS/MS as a method to detect and quantify AHLs in bacterial cultures
Methods to detect AHLs in biological samples are becoming increasingly more sensitive, and different types of MS protocols have recently been developed with the purpose to find these signalling molecules in low concentrations, for example, picomoles of AHLs (Makemson et al. 2006). However, the use of such protocols for screening purposes has been hampered by several factors. MS methods typically suffer from the demand of relatively large sample sizes in order to detect low concentrations of AHLs. In addition, extraction and analysis procedures are time-consuming and relatively costly. Some protocols include solid-phase extraction to isolate AHLs (Fekete et al. 2010), and this further adds to the handling time. In this study, we set out to facilitate small sample sizes and minimum handling times, along with scalability and automated analysis of samples. In our extraction protocol, we used 75 μl spent growth media and ethyl acetate as the extraction solvent. AHLs in spent growth media were stabilized with hydrochloric acid before storage at −20°C and subsequent HPLC-MS/MS analysis. Samples could be safely stored for 2 months without affecting the quality of the HPLC-MS/MS analysis. The ethyl acetate extracts were dried and redissolved in 20% acetonitrile, which was run on HPLC-MS/MS. During LC, acetonitrile was used as the eluent for the reverse-phase chromatography. Methanol has been used in the majority of earlier work (Hanzelka et al. 1999; Yates et al. 2002), but it was recently shown that methanol forms more adducts compared to acetonitrile (Cataldi et al. 2008). The extracted AHLs were typically run in sets of 200 samples per day. MS/MS in SRM mode was regarded as the suitable method, based on previous reports (Morin et al. 2003; Gould et al. 2006; Ortori et al. 2011; May et al. 2012), because the SRM method provides better selectivity for C4 AHLs (3-OH-C4-HSL, C4-HSL, 3-oxo-C4-HSL) than full-scan Orbitrap. Our results also showed that C4-chained AHLs were more difficult to detect and quantify compared to the longer-chained AHLs. There are two main reasons for this. First, C4-chained AHLs are detected as relatively broad peaks near the injection peak where the mass baseline (noise level) is high (Fig. S1). Second, the C4-chained AHLs elute when the mobile-phase solvent consists mostly of water (approximately 90% water and 10% acetonitrile), which then typically also contain more metal ions such as sodium and potassium. The AHLs are, therefore, more likely to form, for example, sodium adducts, which create additional problems during the interpretations of collected data. Chances of running into problems with sodium and other unwanted adducts are, however, reduced by using acetonitrile and water as mobile-phase solvents (Cataldi et al. 2008).
Perhaps the most important limitation to experiments as described here is that the AHL production in bacteria is greatly dependent on growth parameters. Differences in, for example, medium composition, growth temperatures, starting optical densities and shaker speed can greatly affect the results. Hence, as we have experienced during this study, reproducing the growth conditions and results from previous studies can be very difficult. Moreover, different species and/or isolates can have very different growth requirement; hence, direct comparison of results from different species/isolates can also be challenging.
AHL production in Vibrionaceae
In Vibrionaceae, the production of specific AHLs has been carefully studied for several model bacteria, for example, Aliivibrio fischeri (Kuo et al. 1994), Vibrio anguillarum (Buchholtz et al. 2006) and Vibrio harveyi (Cao and Meighen 1989), and their AHL-producing enzymes have been characterized in detail (Schaefer et al. 1996; Milton et al. 1997, 2001; Hanzelka et al. 1999). In A. fischeri, AinS is responsible for the production of C8-HSL (Hanzelka et al. 1999), whereas LuxI is responsible for the production of 3-oxo-C6-HSL and C6-HSL (Kuo et al. 1994). Our results suggest the existence of at least six AHLs in A. fischeri ES114. No previous study has reported this many AHLs in A. fischeri. One explanation for this could be that previous studies have used techniques, for example, field desorption (FD) ionization with double-focusing (magnetic and electric sectors in series) MS (Eberhard et al. 1981), desorption chemical ionization probe and electron impact ionization with magnetic sector MS (Kuo et al. 1994), that differ from our LTQ MS with SRM approach. AHL concentrations reported by Stabb et al. (2008) are based on a method described earlier (Gray and Greenberg 1992) where radioisotopes were used. Hence, they could detect very low levels of AHLs, but their analysis was restricted to specific AHLs (3-oxo-C6-HSL and C8-HSL). In our approach, we searched for 15 different AHLs by using their specific retention times during HPLC, their molecular mass to charge ratio and their fragmentation product (lactone ring; m/z 102·055). There is significantly more AHLs than has been searched for earlier, for example, Kuo et al. (Kuo et al. 1994) searched for 6 and May et al. (May et al. 2012) searched for 8 different AHLs. May et al., also searched for C4-HSL, but they used LM medium (LB media with 2% salt). In a similar medium (LB25), we also found C4-HSL below LOQ in A. fischeri ES114.
Although we have detailed knowledge on a few model bacteria, the distribution of AHL-based QS systems in environmental Vibrionaceae isolates has been unclear. It has also been largely unknown whether the majority of Vibrionaceae members produce similar or very different AHL profiles. This was recently addressed by two independent studies, in which they screened for QS signals in 25 (Yang et al. 2011) and 106 (García-Aljaro et al. 2012) Vibrionaceae strains. Using different biosensors and TLC, they found a variety of AHLs. Although these semi-quantitative methods are efficient methods for screening many samples for the presence of QS signal molecules, they are also inherently limited by (i) their abilities to discriminate between the many different AHLs (chain lengths, hydroxy/oxo modifications); (ii) their abilities to discriminate between AHLs and AHL mimics (chemically different molecules that have similar activities as AHLs in biosensor assays); and (iii) that the methods are typically less reliable when detecting AHLs at very low concentrations. In this study, we screened 57 Vibrionaceae members for AHL production using the HPLC-MS/MS and AHL standards and provided quantitative measurements of fifteen different AHLs (C4–C12-chained AHLs with unsubstituted 3′ carbons or 3′ Oxo or OH modifications; Fig. 1). Thirteen of the fifteen tested AHLs were found in the bacterial samples surveyed in this study, C12-HSL and 3-oxo-C12-HSL were never detected, and C10-HSL and 3-OH-C12-HSL were rarely found. As in previous studies, we conclude that AHLs are found widespread in Vibrio and Aliivibrio, with only a handful of isolates completely lacking AHL production (under our defined growth conditions, and when using our detection method). Furthermore, we show that closely related species typically produce similar AHL profiles, although interesting exceptions do exist.
Why multiple AHLs in bacteria?
The phylogenetic tree in Fig. 2 shows that half of the tested strains produce multiple AHLs, whereas others produce one, two or even none. Likely explanations for this AHL diversity are for example, that one AHL can bind to and regulate the activity of different receivers or that several AHLs bind to and regulate same receiver(s). Both of these cases can be seen in A. fischeri where the AinS product C8-HSL binds to both AinR and LuxR at intermediate cell densities. In addition to binding C8-HSL, LuxR also binds 3-oxo-C6-HSL at high cell densities (Lupp et al. 2003). Moreover, LuxR type of regulators can be classified into five categories based on their activation mechanisms (Stevens et al. 2011). The first type (TraR type) is activated by tight AHL binding; the second type (LuxR type) represents dimers that are activated after AHL binding; the third type (MrtR type) represents nonfunctional monomers that dimerize and are activated upon AHL binding; the fourth type (EsaR type) represents functional dimers that are inactivated upon AHL binding, and finally the fifth type (SdiA type) represents monomers that are activated only upon binding to AHL, but still remain as monomers. This illustrates some of the diversity of activation mechanisms that AHLs are involved in.
Acknowledgments
This work was financed by The Norwegian Research Council and The University of Tromsø. We are grateful to Geir Å. Hansen for assistance with the growth of bacterial cultures, Bjørn Altermark for providing some of the Aliivibrio 16S rRNA gene sequences and Bryan Wilson for corrections and suggestions to the manuscript.
Supporting Information
Additional Supporting Information may be found in the online version of this article:
Figure S1 Ion chromatograms of AHLs with retention time (RT).
Figure S2 Linearity of AHL measurement over a broad concentration range.
Table S1 AHLs standards with their retention time and fragments generated by the SRM method used in this study for analysis.
Table S2 Validation of precision and accuracy of Escherichia coli ArcticExpress (DE3) supernatant spiked with AHLs.
Table S3 AHL concentrations in spent media from A. fischeri ES114. Measurements (average of three technical replicates with standard deviation) from two biological replicates are shown.
Table S4 Quantitative analysis of fifty-seven bacteria from Vibrionaceae family.
Dataset S1 16S rRNA gene sequences from 45 strains used to make the phylogenetic tree in Fig. 2.
References
- Ast JC, Urbanczyk H, Dunlap PV. Multi-gene analysis reveals previously unrecognized phylogenetic diversity in Aliivibrio. Syst Appl Microbiol. 2009;32:379–386. doi: 10.1016/j.syapm.2009.04.005. [DOI] [PubMed] [Google Scholar]
- Baldrich E, Munoz FX, Garcia-Aljaro C. Electrochemical detection of quorum sensing signaling molecules by dual signal confirmation at microelectrode arrays. Anal Chem. 2011;83:2097–2103. doi: 10.1021/ac1028243. [DOI] [PubMed] [Google Scholar]
- Boettcher KJ, Ruby EG. Detection and quantification of Vibrio fischeri autoinducer from symbiotic squid light organs. J Bacteriol. 1995;177:1053–1058. doi: 10.1128/jb.177.4.1053-1058.1995. [DOI] [PMC free article] [PubMed] [Google Scholar]
- Brevik OJ, Nylund A, Ottem K. 2007. Aliivibrio salmonicida strain NCIMB 2262 16S ribosomal RNA gene, partial sequence, directly submitted to GenBank: EU257756.1. submitted by University of Bergen, Thormolens gt. 55, Bergen 5020, Norway.
- Buchholtz C, Nielsen KF, Milton DL, Larsen JL, Gram L. Profiling of acylated homoserine lactones of Vibrio anguillarum in-vitro and in-vivo: influence of growth conditions and serotype. Syst Appl Microbiol. 2006;29:433–445. doi: 10.1016/j.syapm.2005.12.007. [DOI] [PubMed] [Google Scholar]
- Cao JG, Meighen EA. Purification and structural identification of an autoinducer for the luminescence system of Vibrio harveyi. J Biol Chem. 1989;264:21670–21676. [PubMed] [Google Scholar]
- Cataldi TR, Bianco G, Abate S. Profiling of N-acyl-homoserine lactones by liquid chromatography coupled with electrospray ionization and a hybrid quadrupole linear ion-trap and Fourier-transform ion-cyclotron-resonance mass spectrometry (LC-ESI-LTQ-FTICR-MS) J Mass Spectrom. 2008;43:82–96. doi: 10.1002/jms.1275. [DOI] [PubMed] [Google Scholar]
- Cataldi TR, Bianco G, Abate S. Accurate mass analysis of N-acyl-homoserine-lactones and cognate lactone-opened compounds in bacterial isolates of Pseudomonas aeruginosa PAO1 by LC-ESI-LTQ-FTICR-MS. J Mass Spectrom. 2009;44:182–192. doi: 10.1002/jms.1479. [DOI] [PubMed] [Google Scholar]
- Cataldi TR, Bianco G, Fonseca J, Schmitt-Kopplin P. Perceiving the chemical language of Gram-negative bacteria: listening by high-resolution mass spectrometry. Anal Bioanal Chem. 2013;405:493–507. doi: 10.1007/s00216-012-6371-2. [DOI] [PubMed] [Google Scholar]
- Cha C, Gao P, Chen YC, Shaw PD, Farrand SK. Production of acyl-homoserine lactone quorum-sensing signals by Gram-negative plant-associated bacteria. Mol Plant Microbe Interact. 1998;11:1119–1129. doi: 10.1094/MPMI.1998.11.11.1119. [DOI] [PubMed] [Google Scholar]
- Chambers CE, Visser MB, Schwab U, Sokol PA. Identification of N-acylhomoserine lactones in mucopurulent respiratory secretions from cystic fibrosis patients. FEMS Microbiol Lett. 2005;244:297–304. doi: 10.1016/j.femsle.2005.01.055. [DOI] [PubMed] [Google Scholar]
- Cuadrado-Silva CT, Castellanos L, Arévalo-Ferro C, Osorno OE. Detection of quorum sensing systems of bacteria isolated from fouled marine organisms. Biochem Syst Ecol. 2013;46:101–107. [Google Scholar]
- Eberhard A, Burlingame A, Eberhard C, Kenyon G, Nealson K, Oppenheimer N. Structural identification of autoinducer of Photobacterium fischeri luciferase. Biochemistry. 1981;20:2444–2449. doi: 10.1021/bi00512a013. [DOI] [PubMed] [Google Scholar]
- Eberl L, Winson MK, Sternberg C, Stewart GS, Christiansen G, Chhabra SR, Bycroft B, Williams P, et al. Involvement of N-acyl-l-hormoserine lactone autoinducers in controlling the multicellular behaviour of Serratia liquefaciens. Mol Microbiol. 1996;20:127–136. doi: 10.1111/j.1365-2958.1996.tb02495.x. [DOI] [PubMed] [Google Scholar]
- Eiler A, Bertilsson S. Detection and quantification of Vibrio populations using denaturant gradient gel electrophoresis. J Microbiol Methods. 2006;67:339–348. doi: 10.1016/j.mimet.2006.04.002. [DOI] [PubMed] [Google Scholar]
- Favre-Bonté S, Pache J-C, Robert J, Blanc D, Pechère J-C, van Delden C. Detection of Pseudomonas aeruginosa cell-to-cell signals in lung tissue of cystic fibrosis patients. Microb Pathog. 2002;32:143–147. doi: 10.1006/mpat.2001.0487. [DOI] [PubMed] [Google Scholar]
- Fekete A, Frommberger M, Rothballer M, Li X, Englmann M, Fekete J, Hartmann A, Eberl L, et al. Identification of bacterial N-acylhomoserine lactones (AHLs) with a combination of ultra-performance liquid chromatography (UPLC), ultra-high-resolution mass spectrometry, and in-situ biosensors. Anal Bioanal Chem. 2007;387:455–467. doi: 10.1007/s00216-006-0970-8. [DOI] [PubMed] [Google Scholar]
- Fekete A, Kuttler C, Rothballer M, Hense BA, Fischer D, Buddrus-Schiemann K, Lucio M, Muller J, et al. Dynamic regulation of N-acyl-homoserine lactone production and degradation in Pseudomonas putida IsoF. FEMS Microbiol Ecol. 2010;72:22–34. doi: 10.1111/j.1574-6941.2009.00828.x. [DOI] [PubMed] [Google Scholar]
- Frommberger M, Schmitt-Kopplin P, Ping G, Frisch H, Schmid M, Zhang Y, Hartmann A, Kettrup A. A simple and robust set-up for on-column sample preconcentration – nano-liquid chromatography – electrospray ionization mass spectrometry for the analysis of N-acylhomoserine lactones. Anal Bioanal Chem. 2004;378:1014–1020. doi: 10.1007/s00216-003-2400-5. [DOI] [PubMed] [Google Scholar]
- Fuqua WC, Winans SC, Greenberg EP. Quorum sensing in bacteria: the LuxR-LuxI family of cell density-responsive transcriptional regulators. J Bacteriol. 1994;176:269–275. doi: 10.1128/jb.176.2.269-275.1994. [DOI] [PMC free article] [PubMed] [Google Scholar]
- García-Aljaro C, Vargas-Cespedes GJ, Blanch AR. Detection of acylated homoserine lactones produced by Vibrio spp. and related species isolated from water and aquatic organisms. J Appl Microbiol. 2012;112:383–389. doi: 10.1111/j.1365-2672.2011.05199.x. [DOI] [PubMed] [Google Scholar]
- Gomez-Gil B, Alvarez-Villasenor R, Berecochea A. 2006. Vibrio splendidus strain CAIM 319 16S ribosomal RNA gene, partial sequence, direct submission. CIAD, A.C. Mazatlan Unit for Aquaculture, AP. 711, Mazatlan, Sinaloa 82000, Mexico.
- Gould TA, Herman J, Krank J, Murphy RC, Churchill ME. Specificity of acyl-homoserine lactone synthases examined by mass spectrometry. J Bacteriol. 2006;188:773–783. doi: 10.1128/JB.188.2.773-783.2006. [DOI] [PMC free article] [PubMed] [Google Scholar]
- Gray KM, Greenberg EP. Physical and functional maps of the luminescence gene cluster in an autoinducer-deficient Vibrio fischeri strain isolated from a squid light organ. J Bacteriol. 1992;174:4384–4390. doi: 10.1128/jb.174.13.4384-4390.1992. [DOI] [PMC free article] [PubMed] [Google Scholar]
- Gutierrez CK, Matsui GY, Lincoln DE, Lovell CR. Production of the Phytohormone Indole-3-Acetic Acid by Estuarine Species of the Genus Vibrio. Appl Environ Microbiol. 2009;75:2253–2258. doi: 10.1128/AEM.02072-08. [DOI] [PMC free article] [PubMed] [Google Scholar]
- Hall TA. BioEdit: a user-friendly biological sequence alignment editor and analysis program for Windows 95/98/NT. Nucleic Acids Symp Ser. 1999;41:95–98. [Google Scholar]
- Hanzelka BL, Parsek MR, Val DL, Dunlap PV, Cronan JE, Jr, Greenberg EP. Acylhomoserine lactone synthase activity of the Vibrio fischeri AinS protein. J Bacteriol. 1999;181:5766–5770. doi: 10.1128/jb.181.18.5766-5770.1999. [DOI] [PMC free article] [PubMed] [Google Scholar]
- Hentzer M, Givskov M. Pharmacological inhibition of quorum sensing for the treatment of chronic bacterial infections. J Clin Investig. 2003;112:1300–1307. doi: 10.1172/JCI20074. [DOI] [PMC free article] [PubMed] [Google Scholar]
- Hjerde E, Lorentzen MS, Holden MT, Seeger K, Paulsen S, Bason N, Churcher C, Harris D, et al. The genome sequence of the fish pathogen Aliivibrio salmonicida strain LFI1238 shows extensive evidence of gene decay. BMC Genomics. 2008;9:616. doi: 10.1186/1471-2164-9-616. [DOI] [PMC free article] [PubMed] [Google Scholar]
- Jones S, Yu B, Bainton NJ, Birdsall M, Bycroft BW, Chhabra SR, Cox AJ, Golby P, et al. The lux autoinducer regulates the production of exoenzyme virulence determinants in Erwinia carotovora and Pseudomonas aeruginosa. EMBO J. 1993;12:2477–2482. doi: 10.1002/j.1460-2075.1993.tb05902.x. [DOI] [PMC free article] [PubMed] [Google Scholar]
- Kaufmann GF, Sartorio R, Lee SH, Rogers CJ, Meijler MM, Moss JA, Clapham B, Brogan AP, et al. Revisiting quorum sensing: discovery of additional chemical and biological functions for 3-oxo-N-acylhomoserine lactones. Proc Natl Acad Sci, USA. 2005;102:309–314. doi: 10.1073/pnas.0408639102. [DOI] [PMC free article] [PubMed] [Google Scholar]
- Kuo A, Blough NV, Dunlap PV. Multiple N-acyl-l-homoserine lactone autoinducers of luminescence in the marine symbiotic bacterium Vibrio fischeri. J Bacteriol. 1994;176:7558–7565. doi: 10.1128/jb.176.24.7558-7565.1994. [DOI] [PMC free article] [PubMed] [Google Scholar]
- Larkin MA, Blackshields G, Brown NP, Chenna R, McGettigan PA, McWilliam H, Valentin F, Wallace IM, et al. Clustal W and Clustal X version 2.0. Bioinformatics. 2007;23:2947–2948. doi: 10.1093/bioinformatics/btm404. [DOI] [PubMed] [Google Scholar]
- Lowery CA, Park J, Gloeckner C, Meijler MM, Mueller RS, Boshoff HI, Ulrich RL, Barry CE, 3rd, et al. Defining the mode of action of tetramic acid antibacterials derived from Pseudomonas aeruginosa quorum sensing signals. J Am Chem Soc. 2009;131:14473–14479. doi: 10.1021/ja9056079. [DOI] [PMC free article] [PubMed] [Google Scholar]
- Lupp C, Ruby EG. Vibrio fischeri LuxS and AinS: comparative study of two signal synthases. J Bacteriol. 2004;186:3873–3881. doi: 10.1128/JB.186.12.3873-3881.2004. [DOI] [PMC free article] [PubMed] [Google Scholar]
- Lupp C, Urbanowski M, Greenberg EP, Ruby EG. The Vibrio fischeri quorum-sensing systems ain and lux sequentially induce luminescence gene expression and are important for persistence in the squid host. Mol Microbiol. 2003;50:319–331. doi: 10.1046/j.1365-2958.2003.t01-1-03585.x. [DOI] [PubMed] [Google Scholar]
- MacDougall D, Lal J, Amore FJ, Langner RR, Cox GV, McClelland NI. Guidelines for data acquisition and data quality evaluation in environmental chemistry. Anal Chem. 1980;52:2242–2249. [Google Scholar]
- Makemson J, Eberhard A, Mathee K. Simple electrospray mass spectrometry detection of acylhomoserine lactones. Luminescence. 2006;21:1–6. doi: 10.1002/bio.873. [DOI] [PubMed] [Google Scholar]
- May AL, Eisenhauer ME, Coulston KS, Campagna SR. Detection and quantitation of bacterial acylhomoserine lactone quorum sensing molecules via liquid chromatography-isotope dilution tandem mass spectrometry. Anal Chem. 2012;84:1243–1252. doi: 10.1021/ac202636d. [DOI] [PubMed] [Google Scholar]
- McClean KH, Winson MK, Fish L, Taylor A, Chhabra SR, Camara M, Daykin M, Lamb JH, et al. Quorum sensing and Chromobacterium violaceum: exploitation of violacein production and inhibition for the detection of N-acylhomoserine lactones. Microbiology. 1997;143(Pt 12):3703–3711. doi: 10.1099/00221287-143-12-3703. [DOI] [PubMed] [Google Scholar]
- Meighen EA. Genetics of bacterial bioluminescence. Annu Rev Genet. 1994;28:117–139. doi: 10.1146/annurev.ge.28.120194.001001. [DOI] [PubMed] [Google Scholar]
- Milton DL. Quorum sensing in vibrios: complexity for diversification. Int J Med Microbiol. 2006;296:61–71. doi: 10.1016/j.ijmm.2006.01.044. [DOI] [PubMed] [Google Scholar]
- Milton DL, Hardman A, Camara M, Chhabra SR, Bycroft BW, Stewart GS, Williams P. Quorum sensing in Vibrio anguillarum: characterization of the vanI/vanR locus and identification of the autoinducer N-(3-oxodecanoyl)-l-homoserine lactone. J Bacteriol. 1997;179:3004–3012. doi: 10.1128/jb.179.9.3004-3012.1997. [DOI] [PMC free article] [PubMed] [Google Scholar]
- Milton DL, Chalker VJ, Kirke D, Hardman A, Camara M, Williams P. The LuxM homologue VanM from Vibrio anguillarum directs the synthesis of N-(3-hydroxyhexanoyl) homoserine lactone and N-hexanoylhomoserine lactone. J Bacteriol. 2001;183:3537–3547. doi: 10.1128/JB.183.12.3537-3547.2001. [DOI] [PMC free article] [PubMed] [Google Scholar]
- Morin D, Grasland B, Vallée-Réhel K, Dufau C, Haras D. On-line -performance liquid chromatography-mass spectrometric detection and quantification of N-acylhomoserine lactones, quorum sensing signal molecules, in the presence of biological matrices. J Chromatogr A. 2003;1002:79–92. doi: 10.1016/s0021-9673(03)00730-1. [DOI] [PubMed] [Google Scholar]
- Ng WL, Bassler BL. Bacterial quorum-sensing network architectures. Annu Rev Genet. 2009;43:197–222. doi: 10.1146/annurev-genet-102108-134304. [DOI] [PMC free article] [PubMed] [Google Scholar]
- Nhan DT, Cam DT, Wille M, Defoirdt T, Bossier P, Sorgeloos P. Quorum quenching bacteria protect Macrobrachium rosenbergii larvae from Vibrio harveyi infection. J Appl Microbiol. 2010;109:1007–1016. doi: 10.1111/j.1365-2672.2010.04728.x. [DOI] [PubMed] [Google Scholar]
- Ortori CA, Dubern JF, Chhabra SR, Camara M, Hardie K, Williams P, Barrett DA. Simultaneous quantitative profiling of N-acyl-l-homoserine lactone and 2-alkyl-4(1H)-quinolone families of quorum-sensing signaling molecules using LC-MS/MS. Anal Bioanal Chem. 2011;399:839–850. doi: 10.1007/s00216-010-4341-0. [DOI] [PubMed] [Google Scholar]
- Osorno O, Castellanos L, Ramos FA, Arévalo-Ferro C. Gas Chromatography – Biochemicals, Narcotics and Essential Oils. In: Salih DB, editor. Gas Chromathography as a Tool in Quorum Sensing Studies. Rijeka, Croatia: InTech; 2012. pp. 67–96. [Google Scholar]
- Peters FT, Maurer HH. Systematic comparison of bias and precision data obtained with multiple-point and one-point calibration in six validated multianalyte assays for quantification of drugs in human plasma. Anal Chem. 2007;79:4967–4976. doi: 10.1021/ac070054s. [DOI] [PubMed] [Google Scholar]
- Rasch M, Buch C, Austin B, Slierendrecht WJ, Ekmann KS, Larsen JL, Johansen C, Riedel K, et al. An inhibitor of bacterial quorum sensing reduces mortalities caused by Vibriosis in rainbow trout (Oncorhynchus mykiss, Walbaum) Syst Appl Microbiol. 2004;27:350–359. doi: 10.1078/0723-2020-00268. [DOI] [PubMed] [Google Scholar]
- Ravn L, Christensen AB, Molin S, Givskov M, Gram L. Methods for detecting acylated homoserine lactones produced by Gram-negative bacteria and their application in studies of AHL-production kinetics. J Microbiol Methods. 2001;44:239–251. doi: 10.1016/s0167-7012(01)00217-2. [DOI] [PubMed] [Google Scholar]
- Rehnstam AS, Norqvist A, Wolf-Watz H, Hagstrom A. Identification of Vibrio anguillarum in fish by using partial 16S rRNA sequences and a specific 16S rRNA oligonucleotide probe. Appl Environ Microbiol. 1989;55:1907–1910. doi: 10.1128/aem.55.8.1907-1910.1989. [DOI] [PMC free article] [PubMed] [Google Scholar]
- Romero-Campero FJ, Perez-Jimenez MJ. A model of the quorum sensing system in Vibrio fischeri using P systems. Artif Life. 2008;14:95–109. doi: 10.1162/artl.2008.14.1.95. [DOI] [PubMed] [Google Scholar]
- Savka MA, Le PT, Burr TJ. LasR receptor for detection of long-chain quorum-sensing signals: identification of N-acyl-homoserine lactones encoded by the avsI locus of Agrobacterium vitis. Curr Microbiol. 2011;62:101–110. doi: 10.1007/s00284-010-9679-1. [DOI] [PubMed] [Google Scholar]
- Schaefer AL, Val DL, Hanzelka BL, Cronan JE, Jr, Greenberg EP. Generation of cell-to-cell signals in quorum sensing: acyl homoserine lactone synthase activity of a purified Vibrio fischeri LuxI protein. Proc Natl Acad Sci, USA. 1996;93:9505–9509. doi: 10.1073/pnas.93.18.9505. [DOI] [PMC free article] [PubMed] [Google Scholar]
- Shaw PD, Ping G, Daly SL, Cha C, Cronan JE, Jr, Rinehart KL, Farrand SK. Detecting and characterizing N-acyl-homoserine lactone signal molecules by thin-layer chromatography. Proc Natl Acad Sci, USA. 1997;94:6036–6041. doi: 10.1073/pnas.94.12.6036. [DOI] [PMC free article] [PubMed] [Google Scholar]
- Stabb EV, Bose JL, Ruby EG. Quorum signaling and symbiosis in the marine luminous bacterium Vibrio fischeri. In: Winans SC, Bassler BL, editors. Chemical Communication Among Bacteria. Washington, DC: ASM Press; 2008. pp. 233–250. [Google Scholar]
- Stevens AM, Queneau Y, Soulere L, von Bodman S, Doutheau A. Mechanisms and synthetic modulators of AHL-dependent gene regulation. Chem Rev. 2011;111:4–27. doi: 10.1021/cr100064s. [DOI] [PubMed] [Google Scholar]
- Tamura K, Peterson D, Peterson N, Stecher G, Nei M, Kumar S. MEGA5: molecular evolutionary genetics analysis using maximum likelihood, evolutionary distance, and maximum parsimony methods. Mol Biol Evol. 2011;28:2731–2739. doi: 10.1093/molbev/msr121. [DOI] [PMC free article] [PubMed] [Google Scholar]
- Teplitski M, Mathesius U, Rumbaugh KP. Perception and degradation of N-acyl homoserine lactone quorum sensing signals by mammalian and plant cells. Chem Rev. 2011;111:100–116. doi: 10.1021/cr100045m. [DOI] [PubMed] [Google Scholar]
- Thomsen V, Schatzlein D, Mercuro D. Limits of detection in spectroscopy. Spectroscopy. 2003;18:112–114. [Google Scholar]
- Valiente E, Bruhn JB, Nielsen KF, Larsen JL, Roig FJ, Gram L, Amaro C. Vibrio vulnificus produces quorum sensing signals of the AHL-class. FEMS Microbiol Ecol. 2009;69:16–26. doi: 10.1111/j.1574-6941.2009.00691.x. [DOI] [PubMed] [Google Scholar]
- Van Houdt R, Aertsen A, Moons P, Vanoirbeek K, Michiels CW. N-acyl-l-homoserine lactone signal interception by Escherichia coli. FEMS Microbiol Lett. 2006;256:83–89. doi: 10.1111/j.1574-6968.2006.00103.x. [DOI] [PubMed] [Google Scholar]
- Wang J, Quan C, Wang X, Zhao P, Fan S. Extraction, purification and identification of bacterial signal molecules based on N-acyl homoserine lactones. Microb Biotechnol. 2011;4:479–490. doi: 10.1111/j.1751-7915.2010.00197.x. [DOI] [PMC free article] [PubMed] [Google Scholar]
- West SA, Winzer K, Gardner A, Diggle SP. Quorum sensing and the confusion about diffusion. Trends Microbiol. 2012;20:586–594. doi: 10.1016/j.tim.2012.09.004. [DOI] [PubMed] [Google Scholar]
- Yang Q, Han Y, Zhang XH. Detection of quorum sensing signal molecules in the family Vibrionaceae. J Appl Microbiol. 2011;110:1438–1448. doi: 10.1111/j.1365-2672.2011.04998.x. [DOI] [PubMed] [Google Scholar]
- Yates EA, Philipp B, Buckley C, Atkinson S, Chhabra SR, Sockett RE, Goldner M, Dessaux Y, et al. N-acylhomoserine lactones undergo lactonolysis in a pH-, temperature-, and acyl chain length-dependent manner during growth of Yersinia pseudotuberculosis and Pseudomonas aeruginosa. Infect Immun. 2002;70:5635–5646. doi: 10.1128/IAI.70.10.5635-5646.2002. [DOI] [PMC free article] [PubMed] [Google Scholar]
Associated Data
This section collects any data citations, data availability statements, or supplementary materials included in this article.
Supplementary Materials
Figure S1 Ion chromatograms of AHLs with retention time (RT).
Figure S2 Linearity of AHL measurement over a broad concentration range.
Table S1 AHLs standards with their retention time and fragments generated by the SRM method used in this study for analysis.
Table S2 Validation of precision and accuracy of Escherichia coli ArcticExpress (DE3) supernatant spiked with AHLs.
Table S3 AHL concentrations in spent media from A. fischeri ES114. Measurements (average of three technical replicates with standard deviation) from two biological replicates are shown.
Table S4 Quantitative analysis of fifty-seven bacteria from Vibrionaceae family.
Dataset S1 16S rRNA gene sequences from 45 strains used to make the phylogenetic tree in Fig. 2.