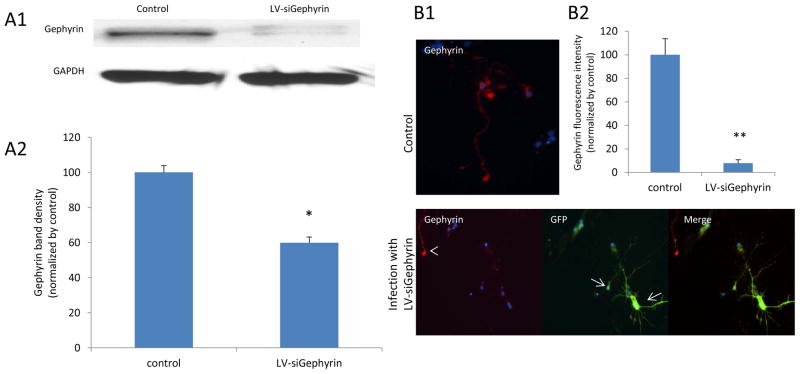
Figure 3. Infection by LV-siGephyrin inhibits gephyrin expression on cultured mouse amygdala neurons.
Panel A1 is a western blot result showing gephyrin expression on neurons infected with LV-siGephyrin compared to non-infected control neurons. The gephyrin expression in infected cells was significantly decreased, compared to the control, * p<0.002 (A2). Panel B is an ICC result, demonstrating decreased gephyrin on infected, GFP expressing neurons, (arrows in B1) compared to non-infected neurons (arrowhead). B2 represents the quantified fluorescence intensity of gephyrin from B1. (** p = 0.001, compared to control).

