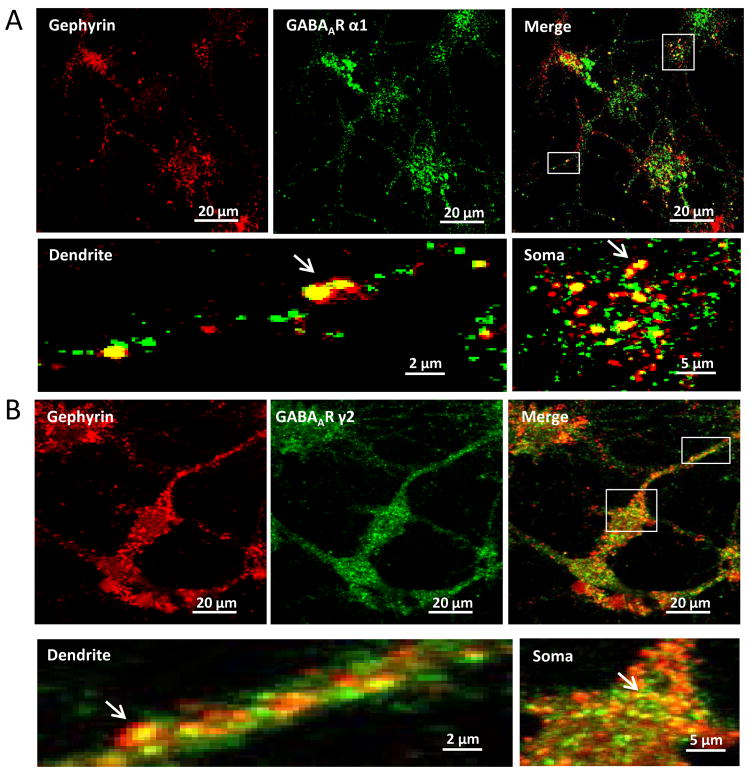
Figure 5. Confocal microscopy shows co-localization of gephyrin and GABAAR α1 or γ2 subunits on cultured mouse amygdala neurons.
Panel A shows red-fluorescent gephyrin and green-fluorescent total α1 subunits on dendrites and somata. The merged picture emphasizes the co-localization of both. The pictures of dendrite and soma correspond to the areas in the merged picture, showing details of co-localization of puncta pointed by arrows. Panal B represents red-fluorescent gephyrin and green-fluorescent total γ2 subunits. The pictures of dendrite and soma are the framed areas in the merged picture. The arrows point to the co-localized puncta.

