

Abstract
We performed a molecular phylogenetic study on HIV-1 polymerase sequences of men who have sex with men (MSM) and heterosexual patient samples in Kenya to characterize any observed HIV-1 transmission networks. HIV-1 polymerase sequences were obtained from samples in Nairobi and coastal Kenya from 84 MSM, 226 other men, and 364 women from 2005 to 2010. Using Bayesian phylogenetics, we tested whether sequences clustered by sexual orientation and geographic location. In addition, we used trait diffusion analyses to identify significant epidemiological links and to quantify the number of transmissions between risk groups. Finally, we compared 84 MSM sequences with all HIV-1 sequences available online at GenBank. Significant clustering of sequences from MSM at both coastal Kenya and Nairobi was found, with evidence of HIV-1 transmission between both locations. Although a transmission pair between a coastal MSM and woman was confirmed, no significant HIV-1 transmission was evident between MSM and the comparison population for the predominant subtype A (60%). However, a weak but significant link was evident when studying all subtypes together. GenBank comparison did not reveal other important transmission links. Our data suggest infrequent intermingling of MSM and heterosexual HIV-1 epidemics in Kenya.
Introduction
Sex between men has only recently been recognized as an important route of HIV-1 transmission in sub-Saharan Africa.1 Molecular phylogenetic studies have shown that HIV-1 transmission networks among men who have sex with men (MSM) in western countries only occasionally include infections among women.2–5 However, this might be different in sub-Saharan Africa where the majority of MSM report sex with both men and women.1,6,7 In a high-risk cohort of MSM in Coastal Kenya, 83% reported bisexual behavior during their follow-up and the estimated HIV-1 incidence was as high as nine per 100 person years.8–10 Mixing of high-risk MSM with heterosexual contacts might thus contribute to the ongoing HIV-1 epidemic.
Several molecular phylogenetic studies have shown the potential of HIV-1 polymerase (pol) sequences to provide insight into HIV-1 transmission networks, revealing infections related by time, geographic area, and risk group.2,3,5,11–23 To investigate MSM HIV-1 transmission networks and the level of mixing with the general population we performed a molecular phylogenetic study with HIV-1 pol sequences. Sequences were selected from a cohort study among MSM and female sex workers (FSW) in coastal Kenya and MSM sex workers in Nairobi, and from female and male patients who participated in antiretroviral drug resistance monitoring studies in hospital-based clinics in the same geographic areas. The route of infection of the hospital clinic comparison population was unknown, but was assumed to be heterosexual for women. To reveal any other transmission networks, a comparison of the sequences from MSM was made with all sequences available online at GenBank.
Materials and Methods
Study population and nucleotide sequences
MSM–International AIDS Vaccine Initiative (IAVI) cohort. From July 2005, a prospective study of adults at high risk for HIV-1 acquisition in coastal Kenya began enrolling volunteers.9 Participants were HIV-1 negative, aged 18–49 years, and reported any of the following: transactional sex work, a recent sexually transmitted infection (STI), multiple sexual partners, sex with an HIV-1-infected partner, or anal sex in the past 3 months.6–8 In 2007, HIV-1-negative MSM were recruited into a similar high-risk cohort in Nairobi.9 These at-risk volunteers were followed monthly or quarterly. At each visit, detailed sexual behavior questionnaires were completed, and volunteers received free condoms and HIV counseling and testing. HIV testing included two rapid antibody tests employed in parallel (Determine, Abbott Laboratories, Abbott Park, IL; Unigold, Trinity Biotech plc, Bray, Ireland) followed by a p24-antigen test to detect HIV infection prior to antibody seroconversion (Vironostika HIV-1 p24 ELISA, Biomérieux, Ltd., France). When incident HIV infection was detected, the last available seronegative p24-negative sample was tested for the presence of HIV-1 RNA (Amplicor Monitor v. 1.5, Roche). The estimated date of infection was defined as the midpoint between the last seronegative and first seropositive sample, or 14 days prior to the first p24 antigen-positive sample, or 10 days prior to the first RNA-positive sample, in the absence of a positive p24 antigen or antibody test. Pol sequences were obtained from the first HIV-1 RNA-positive sample for antiretroviral drug resistance testing, as described previously.24 Seroconverters were referred for HIV treatment and care and invited to bring their main sexual partner for a single visit, at which time a plasma sample was obtained from consenting HIV-positive partners to derive pol sequence data.
Comparison cohorts
PharmAccess African Studies to Evaluate Resistance (PASER-M) cohort Kenya
PASER-M is a multicountry prospective cohort of HIV-1-infected individuals initiating antiretroviral therapy (ART) in routine circumstances, including two sites in Kenya since 2007.25 Pretreatment population-based pol sequences were obtained from 448 prevalent samples including 225 individuals attending outpatient clinic services at Coast Province General Hospital in Mombasa, and 223 individuals attending Mater Hospital in Nairobi, as described previously.26 No risk behavior data were collected and although the date of HIV-1 infection was unknown, the date of sampling was available for all sequences.
Kilifi District Hospital (KDH) cohort
KDH is a government hospital that has been providing comprehensive HIV services including free ART and prevention of mother-to-child transmission since 2004. Population-based pol sequences were obtained from samples collected from 121 HIV clinic attendees who were either newly diagnosed or undergoing treatment with ART between July 2008 and June 2009, as described previously.27 Children aged <16 years were excluded from this study. No risk behavior data were collected and although the date of HIV-1 infection was unknown, the date of sampling was available for all sequences.
IAVI
Samples from heterosexual seroconverters and their sexual partners identified in the IAVI cohorts were included in the comparison population cohort for their respective geographic location. One man who was identified as the main sexual partner of an MSM in the seroconverter cohort was included in the MSM cohort.
Phylogenetic analysis
Sequence alignment and HIV-1 subtype determination
Sequences including the entire protease gene (codon 1–99) and the first 320 amino acids of the reverse transcriptase (RT) gene were aligned using Clustal W in Seaview and checked manually.28 Subtypes were classified using SCUEAL29 available at the webserver www.datamonkey.org. Resistance mutations were determined based on the International AIDS Society–USA 2010 guidelines.30 To prevent false clustering due to convergent evolution, 36 amino acid sites associated with major drug resistance were excluded from phylogenetic analysis.
Potential transmission pairs–distance tree
A 1,000-bootstrap phylogenetic maximum-likelihood tree of RNA pol sequences was constructed in MEGA, under a General Time Reversible model with four discrete gamma categories.31 Ambiguous sites were ignored. Potential transmission pairs with corresponding sequences connected by distances ≤0.015 substitutions per nucleotide site forming clusters with bootstraps values ≥70 were selected.15,32,33 Time from infection to onward transmission for the MSM seroconverters was defined as the time between respective estimated dates of infection of all potential transmission pairs.3
Bayesian phylogenetic analysis
We applied a Bayesian Markov chain Monte Carlo (MCMC) method as implemented in BEAST v1.7 for phylogenetic analysis of time-stamped sequence data34 using three different data selections. Because the majority of sequences in our sample belonged to subtype A1 (50%), we first performed an analysis restricted to this subtype (“strict-A1”). A second analysis was performed including all subtype A sequences (“A-loose”), and the third analysis included all sequences (Table 1). For each dataset, a neighbor-joining tree constructed in Seaview was used as a starting tree for BEAST analysis.28 To allow for variation in molecular evolutionary rate among lineages and through time, we used the uncorrelated log-normal relaxed molecular clock with a discretized gamma-distributed general time reversible substitution model.35 The nonparametric Bayesian skyline coalescent model was used, since it does not require prior assumptions on the demographic history.36 We used a previously published normal prior to the time of the most recent common ancestor (tMRCA) of subtype A1 (1,954.2), with 95% Bayesian credible intervals (1,939.7–1,967.7).37 Analyses of 250 million MCMC generations were performed in duplicate. Evolutionary parameters were sampled every 50,000 generations and a total of 5,000 posterior trees were retrieved. After removing 10–30% of burn-in and combining evolutionary parameters and trees using LogCombiner, convergence of the MCMC output was inspected and confirmed in Tracer.38
Table 1.
Subtype and Patient Baseline Information for the Polymerase Sequences
| MSM | Comparison population coast | Comparison population Nairobi | |||||
|---|---|---|---|---|---|---|---|
| Study group by geographic area | MSM coast | MSM Nairobi | Men | Women | Men | Women | Total |
| Total number of sequences | 62 (9%) | 22 (3%) | 121 (18%) | 244 (36%) | 105 (16%) | 120 (18%) | 674 |
| Median year of diagnosis | 2009 (IQR: 2008–2010) | 2008 (IQR: 2007–2010) | 2008 (IQR: 2008–2008) | 2008 (IQR: 2008–2009) | 2008 (IQR: 2008–2009) | 2008 (IQR: 2008–2009) | |
| Range | 2005–2010 | 2006–2010 | 2001–2009 | 2002–2010 | 1999–2009 | 2001–2009 | |
| Median age at diagnosis (years) | 24 (IQR: 22–28) | 25 (IQR: 22–27) | 38 (IQR: 33–45) | 32 (IQR: 26–38) | 38 (IQR: 33–45) | 36 (IQR: 31–42) | |
| Range | 18–39 | 19–31 | 23–60 | 16–67 | 21–66 | 20–59 | |
| Seroconversion interval (months)a | 1.0 (IQR: 0.5–2.7) | 2.8 (IQR: 2.6–3.0) | — | — | — | — | |
| CD4 count at time of sequencing (cells/microliter) | 544 (IQR: 375–683) | 404 (IQR: 303–487) | 136 (IQR: 62–217) | 132 (IQR: 64–201) | 156 (IQR: 104–218) | 165 (IQR: 90–220) | |
| Sequenced after start of ART | 0 | 0 | 3% | 8% | 0 | 0 | |
| % with any resistant mutation (by drug class: PI, NRTI, NNRTI) | 6.5 (0.0, 1.6, 4.8) | 9.1 (0.0, 0.0, 9.1) | 9.1 (2.5, 5.8, 5.8) | 7.4 (0.8, 5.3, 5.7) | 10.5 (1.9, 5.7, 9.5) | 5.8 (0.8, 2.5, 5.0) | |
| % with resistant mutations against two drug classes | 0 | 0 | 5 | 4.5 | 6.7 | 2.5 | |
| Subtype “A1 strict” | 31 (9%) | 10 (3%) | 63 (19%) | 119 (35%) | 53 (16%) | 64 (19%) | 339 (50%) |
| A-ancestral | 0 | 1 | 0 | 0 | 2 | 1 | |
| A2 | 0 | 0 | 0 | 2 | 0 | 0 | |
| A3 | 0 | 0 | 0 | 2 | 0 | 0 | |
| A, A1 recombinant | 1 | 0 | 1 | 3 | 6 | 2 | |
| A-ancestral, A1-recombinant | 4 | 3 | 1 | 6 | 1 | 1 | |
| A-ancestral, A2-recombinant | 0 | 0 | 1 | 1 | 0 | 0 | |
| A1, A3 recombinant | 0 | 2 | 1 | 3 | 0 | 2 | |
| A1, A4 recombinant | 5 | 0 | 1 | 1 | 0 | 1 | |
| A1, AE recombinant | 0 | 0 | 2 | 2 | 1 | 5 | |
| Total subtype A: “A-loose” | 42 (10%) | 16 (4%) | 68 (17%) | 139 (34%) | 63 (16%) | 76 (19%) | 404 (60%) |
| A-ancestral, C-recombinant | 0 | 0 | 2 | 1 | 0 | 0 | |
| A-ancestral, D-recombinant | 1 | 0 | 4 | 0 | 0 | 2 | |
| A1, C recombinant | 0 | 0 | 0 | 9 | 2 | 1 | |
| A1, D recombinant | 1 | 2 | 1 | 19 | 6 | 8 | |
| A1, G recombinant | 0 | 0 | 0 | 1 | 0 | 0 | |
| A1, U recombinant | 0 | 0 | 0 | 1 | 1 | 0 | |
| A2, D recombinant | 0 | 0 | 3 | 6 | 1 | 0 | |
| A4, D recombinant | 0 | 0 | 0 | 0 | 1 | 0 | |
| B | 0 | 1 | 0 | 0 | 0 | 0 | |
| C | 3 | 1 | 9 | 17 | 9 | 14 | |
| C, D recombinant | 0 | 0 | 1 | 3 | 0 | 1 | |
| C, G recombinant | 0 | 0 | 0 | 1 | 0 | 0 | |
| D | 5 | 2 | 13 | 23 | 11 | 7 | |
| D, G recombinant | 0 | 0 | 0 | 1 | 0 | 0 | |
| D, U recombinant | 0 | 0 | 0 | 0 | 2 | 0 | |
| G | 1 | 0 | 2 | 2 | 0 | 2 | |
| CRF16 | 0 | 0 | 4 | 1 | 0 | 0 | |
| CRF16-like | 0 | 0 | 0 | 3 | 2 | 2 | |
| CRF21 | 0 | 0 | 0 | 1 | 0 | 1 | |
| Complex | 10 | 0 | 13 | 16 | 7 | 6 | |
Only MSM seroconverters, and thus not the one male partner at the coast.
MSM, men who have sex with men; IQR, interquartile range; ART, antiretroviral therapy; PI, protease inhibitor; NRTI, nucleoside reverse transcriptase inhibitor; NNRTI, nonnucleoside reverse transcriptase inhibitor.
Correlation of HIV phylogeny with geographic and epidemiological traits
To test if HIV-1 pol sequences in the phylogenetic tree were structured more strongly by risk group than expected by chance alone, and if this effect was supported statistically given the uncertainty in the Bayesian tree topologies, we performed phylogenetic-trait association analyses for each dataset using Bayesian tip-association significance testing (BaTS).39 The last 1,000 posterior trees obtained by BEAST were used as input, thereby accommodating uncertainty at the phylogenetic level.39 Variations on presumed sexual orientation (MSM vs. comparison group), sex, geographic region, and cohort were assigned onto the tips of 1,000 posterior sampled trees and the phylogenetic-trait association was assessed for 1,000 randomizations. The maximum monophyletic clade (MC) size statistic was estimated for each trait. This statistic is positively correlated with phylogenetic-trait association and provides an estimate of the mean cluster size of sequences sampled for each trait. The significance test of the null hypothesis that traits are randomly correlated with phylogenetic tips is defined as critical (p<0.01), marginally significant (0.01≤p≤0.05), or not significant (p>0.05).
Assessing statistical significance and counting of transmissions among traits
We applied a discrete symmetric diffusion approach to model diffusion between six risk groups: MSM coast, MSM Nairobi, Comparison male coast, Comparison male Nairobi, Comparison female coast, and Comparison female Nairobi.40,41 Bayesian stochastic search variable selection (BSSVS) was employed to identify the most parsimonious description of the transmission routes among the considered traits. After a 10–30% burn-in, the rate matrix of the BEAST output was used to compute a Bayes factor test to identify the most significant epidemiological links between the assigned traits. We used a standard truncated Poisson prior with a mean of log 2 and an offset of K-1, where K represents the number of discrete traits. Following the original description of this approach in a phylogenetic context, rates supported by Bayes factor ≥3 were considered significant.40 In addition, to estimate the posterior expectations of the number of transitions among traits along all branches of an unknown phylogeny (Markov jumps), a robust counting approach was used.34,42,43 TreeAnnotator was used to summarize the maximum clade credibility (MCC) tree, which was visualized in FigTree version 1.4.38
Comparison with online sequences
To compare the MSM sequences with sequences sampled globally, we selected the 10 closest blasts for each of the 84 MSM sequences online at GenBank by November 2011 (www.ncbi.nlm.nih.gov). A 1,000-bootstrap maximum likelihood tree was built for the aligned selection of sequences in MEGA.31 Information on patient and study was obtained from the Los Alamos National Laboratory (www.hiv.lanl.gov).
Ethics approval
The KDH and IAVI cohorts in Kilifi obtained ethics approval from the Kenya Medical Research Institute National Ethical Review Committee. The IAVI cohort in Nairobi and the PASER-M cohort obtained ethics approval from the Kenyatta National Hospital Ethics and Research Committee at the University of Nairobi. The PASER-M cohort also obtained ethics approval at the Academic Medical Centre of the University of Amsterdam, The Netherlands. Informed consent was collected from all volunteers prior to the conduct of any study procedures.
Results
Study population and nucleotide sequence classification
Table 1 presents the characteristics of the study population. HIV-1 pol sequences were analyzed from 674 persons, aged 16 years or older at diagnosis. In total, 84 sequences were from known MSM (83 seroconverters and one partner); 62 participated in Coastal Kenya and 22 in the Nairobi cohort. The comparison population comprised in total 590 sequences, 365 from Coastal Kenya and 225 from Nairobi. These included 18 heterosexual seroconverters sampled in the IAVI cohorts (five men and 13 women, including one woman and one man from Nairobi) and samples from four sexual partners identified in the IAVI cohorts (two male partners of female seroconverters and one female partner of MSM seroconverters, all Coastal Kenya). Sexual behavior data were not available from the comparison populations, except for heterosexual seroconverters and partners in the IAVI cohort. For all risk groups subtype A1 was most dominant.
Potential transmission pairs
Twenty-six MSM sequences (31%) formed potential transmission pairs. One pair contained sequences from an MSM and his known female partner (subtype D), and one pair contained sequences from two MSM from Nairobi (subtype D). All other pairs were among 23 sequences from MSM living in the coastal areas only. In one MSM pair from the coast, both were infected with a strain containing a K103N mutation at RT. The median time difference between dates of infection for MSM seroconverter pairs was 0.5 years (IQR: 0.3–1.1). No mixing of risk groups was found except for the one known transmission pair. Among the comparison sequences 15 pairs were identified (5%), pertaining to 13 women and 13 men from the comparison cohorts and two females and their male partners from the IAVI cohort. Eleven pairs comprised sequences from both sexes, two from only men and two from only women. Looking deeper into the phylogenetic tree (Supplementary Fig. S1; Supplementary Data are available online at www.liebertpub.com/aid), 58 (69%) MSM sequences were in 23 clusters of size 2–6. Six (26%) of these clusters also included sequences from female participants. The median branch length for MSM was 0.018 substitutions/site (IQR: 0.004–0.051) and, for the comparison group, this was 0.04 substitutions/site (IQR: 0.03–0.06).
Quantifying the extent of structure by epidemiological traits
Table 2 shows the results of the phylogenetic trait-association tests for the three analyses (“A1 strict,” “A-loose,” and “all subtypes”). These consistently revealed significant phylogenetic clustering of MSM sequences, in total as well as by geographic location (p<0.01). When including all sequences in the analysis significant phylogenetic-trait associations were also observed for the comparison population and for sexual category. No significant phylogenetic-trait associations were found for geographic location alone.
Table 2.
Phylogenetic Trait-Association Test on Structuring of the Transmission Networks in Kenya
| Subtype A1 | Subtype A-loose | All sequences | |||||||
|---|---|---|---|---|---|---|---|---|---|
| N | MC (95% HPD) | p-value | N | MC (95% HPD) | p-value | N | MC (95% HPD) | p-value | |
| By route of transmission per geographic region | |||||||||
| Comparison population coast | 182 | 5.7 (4–7) | 0.222 | 209 | 4.9 (4–7) | 0.992 | 366 | 5.7 (5–8) | 0.597 |
| MSM coast | 30 | 4.7 (4–9) | 0.002 | 40 | 5.2 (5–7) | 0.001 | 61 | 6.0 (6–6) | 0.001 |
| MSM Nairobi | 10 | 2.1 (2–3) | 0.032 | 16 | 3.0 (3–3) | 0.001 | 22 | 4.0 (4–4) | 0.001 |
| Comparison population Nairobi | 117 | 4.1 (3–5) | 0.181 | 139 | 3.7 (3–5) | 0.243 | 225 | 4.1 (3–5) | 0.362 |
| By route of transmission | |||||||||
| Comparison population | 299 | 29.1 (20–40) | 0.072 | 348 | 25.1 (23–32) | 0.114 | 591 | 32.8 (32–33) | 0.036 |
| MSM | 40 | 4.8 (4–9) | 0.003 | 56 | 5.6 (5–7) | 0.001 | 83 | 9.0 (9–9) | 0.001 |
| By sex | |||||||||
| Women | 183 | 7.1 (7–8) | 0.077 | 215 | 6.2 (5–7) | 0.249 | 364 | 8.9 (7–13) | 0.024 |
| Men | 156 | 5.4 (4–9) | 0.210 | 189 | 6.4 (5–10) | 0.089 | 310 | 9.6 (9–11) | 0.009 |
| By geographic location | |||||||||
| Coast | 212 | 7.2 (5–11) | 0.327 | 249 | 9.4 (7–14) | 0.055 | 427 | 9.7 (9–11) | 0.080 |
| Nairobi | 127 | 4.1 (3–5) | 0.329 | 155 | 3.9 (3–5) | 0.416 | 247 | 4.4 (4–5) | 0.581 |
| By cohort | |||||||||
| KDH | 60 | 2.3 (2–4) | 0.919 | 69 | 2.3 (2–4) | 0.943 | 121 | 2.2 (2–3) | 0.998 |
| IAVI | 50 | 4.8 (4–9) | 0.005 | 67 | 5.6 (5–7) | 0.001 | 105 | 9.0 (9–9) | 0.001 |
| PASER | 229 | 7.8 (6–11) | 0.369 | 268 | 8.2 (7–11) | 0.370 | 448 | 9.6 (8–13) | 0.323 |
MC, monophyletic clade; MSM, men who have sex with men.
Identification of significant epidemiological links
Figure 1 shows the Bayesian MCC tree of all 674 sequences (“all subtypes”) obtained using a Bayesian phylogenetic diffusion analysis that considered the discrete traits risk group by spatial location. Figure 2 shows the rates supported by Bayes factor ≥3 (Fig. 2A) and a simplified trait structure combining the results obtained for the three datasets (Fig. 2B). Significant links for all three datasets were found between men and women from the comparison population at the coast and between men and women in Nairobi. Between MSM at the coast and MSM in Nairobi significant links were found when considering A-loose and all sequences together. A significant link between the comparison population and MSM was found for the coastal region when considering all sequences. While the BSSVS gives the statistical support for transitions, the robust counting approach makes it possible to quantify the number of transitions among risk groups along the posterior distribution of trees. This analysis shows that despite the very strong BF support between MSM in the coastal region and Nairobi obtained with the BSSVS analysis, the number of transitions between MSM from these two locations is limited, with four jumps being counted both for the A-loose and the “all subtypes” datasets. The number of jumps between MSM in the coastal region and the comparison male population in the same region was estimated to be 2 for the dataset comprising “all subtypes.”
FIG. 1.

Bayesian maximum clade credibility (MCC) tree of 674 HIV-1 sequences from Kenya. Each branch of the phylogeny has been colored according to the study cohort (legend). Each node has been colored according to the most probable risk group, and the size of the corresponding circle is proportional to the ancestral state probability of the most probable risk group at a particular phylogenetic node. Subtype classification is shown on the right. For simplicity, a broad definition of subtype is shown (for example, “A” refers to A-loose and includes subsubtypes A1, A2, and A3, but also A-like sequences).
FIG. 2.
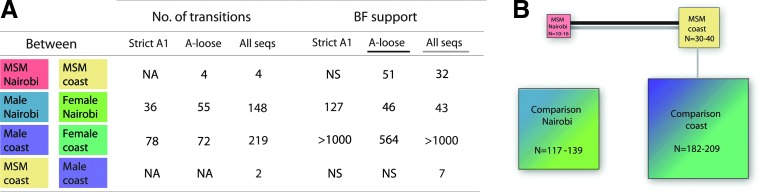
(A) Number and support of transitions among risk groups. Only Markov counts for well-supported transitions between risk groups are shown. NA, not applicable; NS, not significant. (B) Bayes factors test result schema showing linkages for A-like subtypes (black line) and across all study populations (gray line). The relative size of the boxes refers to the size of the population as shown in Table 1 for the various subtype selections.
Comparison with online sequences
A selection of the 322 unique pol sequences was obtained from GenBank (Supplementary Fig. S2). The only subtype B infection in our study from an MSM from Nairobi was part of a European cluster. The only subtype G infection from an MSM from the coast clustered with sequences from Europe, Kenya, and Cameroon. A subtype C sequence from a coastal MSM clustered with an isolate from Zambia.
Discussion
Despite the high percentage of MSM reporting bisexual behavior, the transmission networks among MSM in our study populations mainly involved other MSM both in coastal Kenya and Nairobi, with significant transmission detected between both geographic locations.
First, except for the confirmation of a transmission pair with a known female partner of an MSM, our results did not include apparent transmission pairs between MSM and other female participants. Transmission pairs provide information on only a very constrained selection of the tips of the tree. As all but one MSM in our study were recent seroconverters sequenced shortly after infection, the branch tips in the phylogenetic tree are shorter for this group than for the comparison population that included mostly prevalent infections. However, the shorter branch lengths for MSM might also reflect a shorter time from infection to onward transmission for MSM compared to the comparison population.7,44,45 Also, the subgroup of MSM might have been more densely sampled than the comparison population.
Through the Bayesian discrete diffusion analysis and the phylogenetic-association test, we not only obtained information from the entire evolutionary history of HIV-1 dispersal by using time-calibrated phylogenies, but also took into account uncertainty in tree topology and uncertainty in the ancestral risk group reconstruction by using the posterior distribution of trees instead of assuming one “true” tree.46 The BaTS analysis and Bayes factor test showed similar results for all three datasets and results were confirmed in separate runs and using different models. The BaTS analysis indicates a segregation of MSM transmission networks with more frequent clustering per geographic region. The Bayes factor tests indicated significant HIV-1 gene flow between MSM at the coast and MSM in Nairobi. These findings support reports that there is frequent movement of MSM sex workers between Coastal Kenya and Nairobi.47 Gene flow between men and women in the comparison population by geographic region was also significant. Only the Bayes factor test on all sequences together indicated a weak but significant link between MSM and the male but not the female comparison population at the coast.
Our study populations were convenience samples not selected to be representative of the general population and represent only a very small proportion of the Kenyan epidemic.48 This is reflected in the phylogenetic tree consisting of many small clusters, as was observed in the KDH population.27 As such, it remains unclear for how long the transmission network chains remained within risk groups and caution should be employed when generalizing these results to the wider Kenyan populations. The phylogenetic tree suggests the root of the tree as HIV-1 among women from the coast, which could simply reflect the fact that women from the coast comprised the largest share of the sequences involved in this study (36%).18 Moreover, the linkage found between the male comparison population and MSM does not necessarily imply an onward link with the female comparison population; because no sexual behavior data were available from the comparison group, we cannot exclude the possibility that some of the males in the comparison group were infected by male sexual contact.
A similar distribution of HIV-1 subtypes among MSM and the comparison population might indicate transmission between MSM and women, and so do 26% of the clusters in the distance tree that include sequences from both MSM and female participants. Introduction of HIV-1 subtype A1 in East Africa seems to have taken place in the 1960s and 1970s, as was found in another study.22 Furthermore, our results suggest that subsubtype A1 MSM epidemics have most likely ignited, at least in the 1980s and 1990s. It will be interesting for future studies to estimate the evolutionary history of subtype dispersal among risk groups in other spatial regions and to update the evolutionary dynamics in Kenyan risk groups as new sequence data are made available.
Even though transmission between MSM and women does occur, our data do not suggest this is very common. HIV-1 epidemics in MSM and heterosexuals seem to be self-sustaining in the study areas. Nevertheless, several factors may affect our results. The volunteers within the comparison population are older than the MSM. The IAVI cohort contained nearly all incident cases infected between 2005 and 2010. The comparison groups were both comprised of nearly all prevalent cases enrolled between 2007 and 2009. Therefore, the timing of infection in the comparison group is unknown, and this could limit the suitability of the comparison population for this work. As Kenya's AIDS indicator survey in 2012–2013 will collect biological and behavioral information from a large number of HIV-1-infected persons, including questions on sex behavior and sexual orientation for the first time, a more thorough study of transmission networks will be possible in the near future in Kenya.
In conclusion, this is the first phylogenetic study in sub-Saharan Africa that investigated transmission networks involving MSM and heterosexual populations. We found a decreased level of mixing between MSM and the comparison population than expected randomly, but we did find support for epidemiological links within and, importantly, between risk groups. Results suggest that public health interventions should target both MSM and heterosexual populations to reduce HIV-1 transmission in Kenya.
Supplementary Material
Acknowledgments
The authors would like to thank the HIV Monitoring Foundation in Amsterdam, The Netherlands for supporting this study; Willem Vermin at SARA, Amsterdam, for help in using R on the supercomputer; Michael Worobey at the University of Arizona, Tucson, Arizona, for reading and commenting on an earlier draft of the article; Philippe Lemey at the Katholieke Universiteit, Leuven, Belgium, for helpful comments on the study design; and Bas E. Dutilh at the University of Nijmegen, The Netherlands, for discussions and help with the figures. We thank all participants in the study and the International AIDS Vaccine Initiative (IAVI) for supporting the high-risk cohort study in Kilifi and Nairobi, and the staff of the HIV/STI project at The Kenya Medical Research Institute–Wellcome Trust Research Programme (KWTRP) in Kilifi and KAVI-Kangemi, Nairobi, for their commitment to serving MSM.
The KWTRP at the Centre for Geographical Medicine Research–Kilifi is supported by core funding from the Wellcome Trust (#077092). Nuno Rodrigues Faria is supported by Fundação para a Ciência e Tecnologia, under Grant SFRH/BD/64530/2009. The KEMRI-Clinic in Mtwapa also received support from the University of Washington Center for AIDS Research (CFAR), an NIH-funded program (P30 AI027757). This work was made possible in part by the generous support of the American people through the United States Agency for International Development (USAID). The contents are the responsibility of the study authors and do not necessarily reflect the views of USAID, the NIH, or the United States Government. This report was published with permission from the Director of KEMRI. The PharmAccess African Studies to Evaluate Resistance (PASER) is an initiative of the PharmAccess Foundation, with financial support provided by the Ministry of Foreign Affairs of The Netherlands through a partnership with Stichting Aids Fonds (Grant 12454).
Daniela Bezemer and Nuno Rodrigues Faria designed the analytical approach of the study, performed data analysis, and wrote the first draft of the article. Amin Hassan designed the Kilifi District Hospital (KDH) cohort study and performed sequence analysis of KDH samples. Raph L. Hamers designed the “PASER M” cohort studies and edited the manuscript. Gaudensia Mutua provided clinical data collections and study oversight of the (IAVI) MSM cohort study in Nairobi. Omu Anzala designed the (IAVI) MSM cohort study in Nairobi. Kishor Mandaliya designed the “PASER M” cohort studies. Patricia Cane designed the Kilifi District Hospital (KDH) cohort study and performed sequence analysis of KDH samples. James A. Berkley designed the Kilifi District Hospital (KDH) cohort study and edited the manuscript. Tobias F. Rinke de Wit designed “PASER M” cohort studies and edited the manuscript. Carole Wallis performed sequence analysis of “IAVI” and “PASER M” cohort samples and edited the manuscript. Susan M. Graham designed the (IAVI) MSM cohort study in Coastal Kenya, performed clinical data collections, and edited the manuscript. Matthew A Price designed the (IAVI) MSM cohort studies in Nairobi and Coastal Kenya and edited the manuscript. Roel Coutinho proposed the study analysis and edited the manuscript. Eduard J Sanders designed the (IAVI) MSM cohort study in Coastal Kenya, performed clinical data collections, and edited the manuscript. All authors have read and approved the final article.
Author Disclosure Statement
Patricia Cane is a small shareholder at GSK and is on the advisory board for Viiv Heathcare.
References
- 1.Beyrer C, Baral SD, Walker D, Wirtz AL, Johns B, and Sifakis F: The expanding epidemics of HIV type 1 among men who have sex with men in low- and middle-income countries: Diversity and consistency. Epidemiol Rev 2010;32(1):137–151 [DOI] [PubMed] [Google Scholar]
- 2.Lewis F, Hughes GJ, Rambaut A, Pozniak A, and Leigh Brown AJ: Episodic sexual transmission of HIV revealed by molecular phylodynamics. PLoS Med 2008;18;5(3):e50. [DOI] [PMC free article] [PubMed] [Google Scholar]
- 3.Bezemer D, van Sighem AI, Lukashov V, et al. : Transmission networks of HIV-1 among men having sex with men in the Netherlands. AIDS 2010;24(2):271–282 [DOI] [PubMed] [Google Scholar]
- 4.Holmes EC, Zhang LQ, Robertson P, et al. : The molecular epidemiology of human immunodeficiency virus type 1 in Edinburgh. J Infect Dis 1995;171(1):45–53 [DOI] [PubMed] [Google Scholar]
- 5.Kouyos RD, von W, V, Yerly S, et al. : Molecular epidemiology reveals long-term changes in HIV type 1 subtype B transmission in Switzerland. J Infect Dis 2010;201(10):1488–1497 [DOI] [PubMed] [Google Scholar]
- 6.Tovanabutra S, Sanders EJ, Graham SM, et al. : Evaluation of HIV type 1 strains in men having sex with men and in female sex workers in Mombasa, Kenya. AIDS Res Hum Retroviruses 2010;26(2):123–131 [DOI] [PubMed] [Google Scholar]
- 7.Sanders EJ, Graham SM, Okuku HS, et al. : HIV-1 infection in high risk men who have sex with men in Mombasa, Kenya. AIDS 2007;21(18):2513–2520 [DOI] [PubMed] [Google Scholar]
- 8.Price MA, Rida W, Mwangome M, et al.: Identifying at-risk populations in Kenya and South Africa: HIV incidence in cohorts of men who report sex with men, sex workers, and youth. J Acquir Immune Defic Syndr 2012;59(2):185–193 [DOI] [PubMed] [Google Scholar]
- 9.Sanders EJ, Okuku HS, Smith AD, et al. : High HIV-1 incidence, correlates of HIV-1 acquisition, and high viral loads following seroconversion among MSM. AIDS 2013;27(3):437–446 [DOI] [PMC free article] [PubMed] [Google Scholar]
- 10.Mannava P, Geibel S, King'ola N, Temmerman M, and Luchters S: Male sex workers who sell sex to men also engage in anal intercourse with women: Evidence from Mombasa, Kenya. PLoS One 2013;8(1):e52547. [DOI] [PMC free article] [PubMed] [Google Scholar]
- 11.Resik S, Lemey P, Ping LH, et al. : Limitations to contact tracing and phylogenetic analysis in establishing HIV type 1 transmission networks in Cuba. AIDS Res Hum Retroviruses 2007;23(3):347–356 [DOI] [PubMed] [Google Scholar]
- 12.Fisher M, Pao D, Brown AE, et al. : Determinants of HIV-1 transmission in men who have sex with men: A combined clinical, epidemiological and phylogenetic approach. AIDS 2010;24(11):1739–1747 [DOI] [PubMed] [Google Scholar]
- 13.Gifford RJ, de OT, Rambaut A, et al. : Phylogenetic surveillance of viral genetic diversity and the evolving molecular epidemiology of human immunodeficiency virus type 1. J Virol 2007;81(23):13050–13056 [DOI] [PMC free article] [PubMed] [Google Scholar]
- 14.Hue S, Gifford RJ, Dunn D, Fernhill E, and Pillay D: Demonstration of sustained drug-resistant human immunodeficiency virus type 1 lineages circulating among treatment-naive individuals. J Virol 2009;83(6):2645–2654 [DOI] [PMC free article] [PubMed] [Google Scholar]
- 15.Hue S, Clewley JP, Cane PA, and Pillay D: HIV-1 pol gene variation is sufficient for reconstruction of transmissions in the era of antiretroviral therapy. AIDS 2004;18(5):719–728 [DOI] [PubMed] [Google Scholar]
- 16.Hue S, Pillay D, Clewley JP, and Pybus OG: Genetic analysis reveals the complex structure of HIV-1 transmission within defined risk groups. Proc Natl Acad Sci USA 2005;102(12):4425–4429 [DOI] [PMC free article] [PubMed] [Google Scholar]
- 17.Bahl J, Nelson MI, Chan KH, et al. : Temporally structured metapopulation dynamics and persistence of influenza A H3N2 virus in humans. Proc Natl Acad Sci USA 2011;108(48):19359–19364 [DOI] [PMC free article] [PubMed] [Google Scholar]
- 18.Faria NR, Hodges-Mameletzis I, Silva JC, et al. : The phylogeographic footprint of colonial history in the global dispersal of HIV-2 group A. J Gen Virol 2012;93:889–899 [DOI] [PMC free article] [PubMed] [Google Scholar]
- 19.Faria NR, Suchard MA, Abecasis A, et al. : Phylodynamics of the HIV-1 CRF02_AG clade in Cameroon. Infect Genet Evol 2012;12(2):453–460 [DOI] [PMC free article] [PubMed] [Google Scholar]
- 20.de Oliveira T., Pillay D, and Gifford RJ: The HIV-1 subtype C epidemic in South America is linked to the United Kingdom. PLoS One 2010;5(2):e9311. [DOI] [PMC free article] [PubMed] [Google Scholar]
- 21.Junqueira DM, de Medeiros RM, Matte MC, et al. : Reviewing the history of HIV-1: spread of subtype B in the Americas. PLoS One 2011;6(11):e27489. [DOI] [PMC free article] [PubMed] [Google Scholar]
- 22.Gray RR, Tatem AJ, Lamers S, et al. : Spatial phylodynamics of HIV-1 epidemic emergence in east Africa. AIDS 2009;23(14):F9–F17 [DOI] [PMC free article] [PubMed] [Google Scholar]
- 23.Worobey M, Gemmel M, Teuwen DE, et al. : Direct evidence of extensive diversity of HIV-1 in Kinshasa by 1960. Nature 2008;455(7213):661–664 [DOI] [PMC free article] [PubMed] [Google Scholar]
- 24.Price MA, Wallis CL, Lakhi S, et al. : Transmitted HIV type 1 drug resistance among individuals with recent HIV infection in East and Southern Africa. AIDS Res Hum Retroviruses 2011;27(1):5–12 [DOI] [PMC free article] [PubMed] [Google Scholar]
- 25.Hamers RL, Oyomopito R, Kityo C, et al.: Cohort profile: The PharmAccess African (PASER-M) and the TREAT Asia (TASER-M) monitoring studies to evaluate resistance—HIV drug resistance in sub-Saharan Africa and the Asia-Pacific. Int J Epidemiol 2012;41(1):43–54 [DOI] [PMC free article] [PubMed] [Google Scholar]
- 26.Hamers RL, Wallis CL, Kityo C, et al. : HIV-1 drug resistance in antiretroviral-naive individuals in sub-Saharan Africa after rollout of antiretroviral therapy: A multicentre observational study. Lancet Infect Dis 2011;11(10):750–759 [DOI] [PubMed] [Google Scholar]
- 27.Hue S, Hassan AS, Nabwera H, et al. : HIV type 1 in a rural coastal town in Kenya shows multiple introductions with many subtypes and much recombination. AIDS Res Hum Retroviruses 2012;28(2):220–224 [DOI] [PMC free article] [PubMed] [Google Scholar]
- 28.Gouy M, Guindon S, and Gascuel O: SeaView version 4: A multiplatform graphical user interface for sequence alignment and phylogenetic tree building. Mol Biol Evol 2010;27(2):221–224 [DOI] [PubMed] [Google Scholar]
- 29.Kosakovsky Pond SL, Posada D, Stawiski E, et al.: An evolutionary model-based algorithm for accurate phylogenetic breakpoint mapping and subtype prediction in HIV-1. PLoS Comput Biol 2009;5(11):e1000581. [DOI] [PMC free article] [PubMed] [Google Scholar]
- 30.Johnson VA, Brun-Vezinet F, Clotet B, et al.: Update of the drug resistance mutations in HIV-1: December 2010. Top HIV Med 2010;18(5):156–163 [PubMed] [Google Scholar]
- 31.Tamura K, Peterson D, Peterson N, Stecher G, Nei M, and Kumar S: MEGA5: Molecular evolutionary genetics analysis using maximum likelihood, evolutionary distance, and maximum parsimony methods. Mol Biol Evol 2011;28(10):2731–2739 [DOI] [PMC free article] [PubMed] [Google Scholar]
- 32.Felsenstein J: Confidence limits on phylogenies: An approach using the bootstrap. Evolution 1985;39:783–791 [DOI] [PubMed] [Google Scholar]
- 33.Bezemer D, van Sighem A, de Wolf F, et al. : Combination antiretroviral therapy failure and HIV super-infection. AIDS 2008;22(2):309–311 [DOI] [PubMed] [Google Scholar]
- 34.Drummond AJ, Suchard MA, Xie D, and Rambaut A: Bayesian phylogenetics with BEAUti and the BEAST 1.7. Mol Biol Evol 2012;29(8):1969–1973 [DOI] [PMC free article] [PubMed] [Google Scholar]
- 35.Drummond AJ, Ho SY, Phillips MJ, and Rambaut A: Relaxed phylogenetics and dating with confidence. PLoS Biol 2006;4(5):e88. [DOI] [PMC free article] [PubMed] [Google Scholar]
- 36.Drummond AJ, Rambaut A, Shapiro B, and Pybus OG: Bayesian coalescent inference of past population dynamics from molecular sequences. Mol Biol Evol 2005;22(5):1185–1192 [DOI] [PubMed] [Google Scholar]
- 37.Abecasis AB, Vandamme AM, and Lemey P: Quantifying differences in the tempo of human immunodeficiency virus type 1 subtype evolution. J Virol 2009;83(24):12917–12924 [DOI] [PMC free article] [PubMed] [Google Scholar]
- 38.FigTree and Tracer: http://tree.bio.ed.ac.uk/software, 2012
- 39.Parker J, Rambaut A, and Pybus OG: Correlating viral phenotypes with phylogeny: Accounting for phylogenetic uncertainty. Infect Genet Evol 2008;8(3):239–246 [DOI] [PubMed] [Google Scholar]
- 40.Lemey P, Rambaut A, Drummond AJ, and Suchard MA: Bayesian phylogeography finds its roots. PLoS Comput Biol 2009;5(9):e1000520. [DOI] [PMC free article] [PubMed] [Google Scholar]
- 41.Faria NR, Suchard MA, Rambaut A, and Lemey P: Toward a quantitative understanding of viral phylogeography. Curr Opin Virol 2011;1(5):423–429 [DOI] [PMC free article] [PubMed] [Google Scholar]
- 42.O'Brien JD, Minin VN, and Suchard MA: Learning to count: Robust estimates for labeled distances between molecular sequences. Mol Biol Evol 2009;26(4):801–814 [DOI] [PMC free article] [PubMed] [Google Scholar]
- 43.Minin VN. and Suchard MA: Counting labeled transitions in continuous-time Markov models of evolution. J Math Biol 2008;56(3):391–412 [DOI] [PubMed] [Google Scholar]
- 44.Skar H, Axelsson M, Berggren I, et al. : Dynamics of two separate but linked HIV-1 CRF01_AE outbreaks among injection drug users in Stockholm, Sweden, and Helsinki, Finland. J Virol 2011;85(1):510–518 [DOI] [PMC free article] [PubMed] [Google Scholar]
- 45.Sanders EJ, Thiong'o AN, Okuku HS, et al. : High prevalence of Chlamydia trachomatis and Neisseria gonorrhoeae infections among HIV-1 negative men who have sex with men in coastal Kenya. Sex Transm Infect 2010;86(6):440–441 [DOI] [PubMed] [Google Scholar]
- 46.Kramer MA, Cornelissen M, Paraskevis D, et al.: HIV transmission patterns among The Netherlands, Suriname, and The Netherlands Antilles: A molecular epidemiological study. AIDS Res Hum Retroviruses 2011;27(2):123–130 [DOI] [PubMed] [Google Scholar]
- 47.Geibel S, Luchters S, King'ola N, Esu-Williams E, Rinyiru A, and Tun W: Factors associated with self-reported unprotected anal sex among male sex workers in Mombasa, Kenya. Sex Transmitt Dis 2008;35(8):746–752 [DOI] [PubMed] [Google Scholar]
- 48.UNAIDS: 2011 Report on the global AIDS epidemic. www.unaids.org/en/, 2011
Associated Data
This section collects any data citations, data availability statements, or supplementary materials included in this article.