Significance
The ability of parasites to modify the behavior of their hosts is a widespread phenomenon, but the underlying mechanisms remain to be deciphered. Locusts such as Locusta migratoria manilensis are infamous for their ability to aggregate into gregarious migratory swarms that pose a major threat to food security. The microsporidian parasite Paranosema locustae can disrupt swarm formation by migratory locusts, but the underlying mechanisms of this action remain unexplored. In this study, we found that P. locustae and the native gut bacteria that produce the aggregation pheromone are mutually refractory. The reduction in aggregation pheromone reduces the production of the neurotransmitter serotonin (which initiates gregarization) and dopamine (which induces and maintains gregarization), preventing swarm behavior of migratory locusts.
Keywords: behavioral modification, microsporidia, gut biota
Abstract
Locusts are infamous for their ability to aggregate into gregarious migratory swarms that pose a major threat to food security. Aggregation is elicited by an interplay of visual, tactile, and chemical stimuli, but the aggregation pheromone in feces is particularly important. Infection by the microsporidian parasite Paranosema (Nosema) locustae is known to inhibit aggregation of solitary Locusta migratoria manilensis and to induce gregarious locusts to shift back to solitary behavior. Here we suggest that P. locustae achieves this effect by acidifying the hindgut and modulating the locust immune response, which suppresses the growth of the hindgut bacteria that produce aggregation pheromones. This in turn reduces production of the neurotransmitter serotonin that initiates gregarious behavior. Healthy L. migratoria manilensis exposed to olfactory stimuli from parasite-infected locusts also produced significantly less serotonin, reducing gregarization. P. locustae also suppresses biosynthesis of the neurotransmitter dopamine that maintains gregarization. Our findings reveal the mechanisms by which P. locustae reduces production of aggregation pheromone and blocks the initiation and maintainence of gregarious behavior.
The ability of parasites to alter the behavior of their hosts is a widespread phenomenon that fascinates both scientists and nonscientists alike, touching as it does on core philosophical issues such as the existence of free will (1). Nevertheless, the underlying mechanisms for behavioral modifications are only beginning to be deciphered (2). A dozen species of locusts (Orthoptera: Acrididae) periodically undergo a phase change from solitary to gregarious. Solitary locusts avoid each other except for mating, whereas gregarious locusts are attracted to one another and migrate, feed, mate, and lay eggs in swarms that can produce devastating transcontinental plagues (3).
The phase change from solitary to gregarious usually begins with aggregation brought about by an interplay of tactile, visual, and olfactory stimuli (4, 5). The principal chemical stimuli are provided by a mixture of semiochemicals released from locusts and their fecal pellets, collectively known as aggregation pheromones. Fecal aggregation pheromones are the product of hindgut bacteria (6–9). Five fecal volatiles (nonanal, hexanal, benzaldehyde, cyclohexanol, and 2,5-dimethyl-pyrazine) compose the aggregation pheromones of the oriental migratory locust, Locusta migratoria manilensis (Meyen 1835) (10), which is responsible for destructive plagues in China, southeast Asia, and the Pacific region (11). The neurotransmitters serotonin and dopamine are also involved in the phase transitions. Serotonin can initiate gregarious behavior in the migratory locust, whereas dopamine is able to induce and maintain gregarious behavior. Thus, dopaminergic and serotonergic systems play synergistic roles in regulating behaviors (12–15).
Paranosema (Nosema) locustae Canning, a microsporidian parasite, can infect per os most locust species and has been developed as a biological control agent (16). This parasite initiates infection in the midgut and subsequently spreads to almost all parts of the insect, including the hindgut, fat body, nervous tissues, hemocytes, and gonads (17). The parasite spores are transmitted to nymphs and adults through cannibalism of infected dead insects, fecal contamination, and transovarial transfer from infected females to their offspring (18, 19). Infection of locusts by P. locustae results in impaired development, mobility, and reproductive capacity. More importantly, infection by P. locustae inhibits aggregation of solitary locusts and induces gregarious locusts to transform back to the solitary phase, thereby controlling swarm outbreaks even before it causes direct mortality (20).
The aim of the present study was to determine how P. locustae alters the host locust’s social behavior. We demonstrate that this parasite reduces production of the aggregation pheromone and suppresses initiation and maintenance of gregarious behavior by inhibiting the growth of hindgut bacteria and decreasing the production of serotonin and dopamine.
Results and Discussion
Fecal Volatiles from L. migratoria manilensis Infected by P. locustae Show Reduced Ability to Induce Aggregation of Both Infected and Healthy Insects.
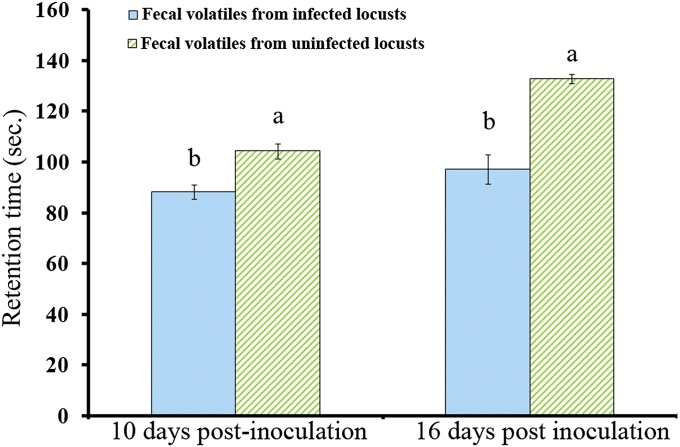
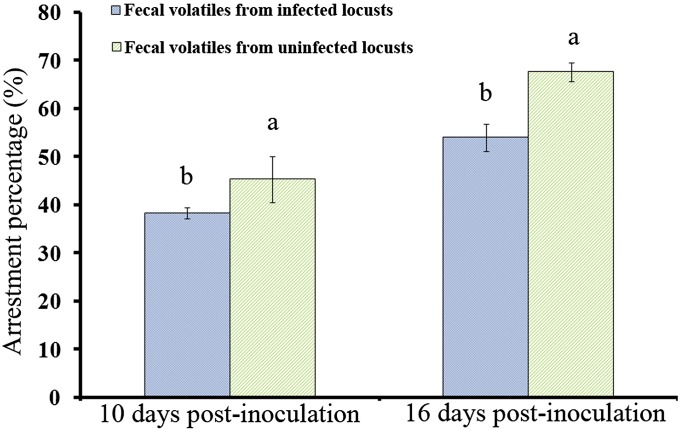
In a previous study, we found that infection by P. locustae significantly impaired the response of locusts to fecal volatiles from either infected or uninfected insects (9). In the present study, we used olfactometric bioassays to show that healthy locusts have a significantly greater aggregation response to fecal volatiles from healthy locusts compared with fecal volatiles from locusts infected by P. locustae for ≥10 d (20,000 spores per locust). The retention time (i.e., time spent in the compartment of the olfactometer containing fecal volatiles) of healthy fifth instar nymphs was 15.5% lower with fecal volatiles from infected locusts (at 10 d postinoculation) compared with fecal volatiles from healthy insects (χ2 = 6.564, P = 0.01; n = 20). Arrestment (percent of locusts attracted into the compartment containing fecal volatiles) of healthy locusts also was significantly reduced (χ2 = 7.410, P = 0.006; n = 20) (Figs. 1 and 2). Likewise, retention time and arrestment of healthy adult locusts exposed to fecal volatiles from infected locusts (16 d postinfection) were decreased by 26.6% (χ2 = 7.410, P = 0.006; n = 20) and 33.1% (χ2 = 8.308, P = 0.004; n = 20), respectively, compared with those exposed to fecal volatiles from healthy locusts (Figs. 1 and 2).
Fig. 1.
Retention responses (i.e., time spent in fecal volatiles containing compartment of the olfactometer; mean ± SE) of healthy locusts to fecal volatiles from locusts that had been infected (20,000 spores per locust) by P. locustae for 10 or 16 d. Values with different letters are significantly different (P < 0.05, Kruskal–Wallis test).
Fig. 2.
Arrestment percentage (mean ± SE) of healthy locusts responding to fecal volatiles from locusts that had been infected (20,000 spores per locust) by P. locustae for 10 or 16 d. Values with different letter are significantly different (P < 0.05, Kruskal–Wallis test).
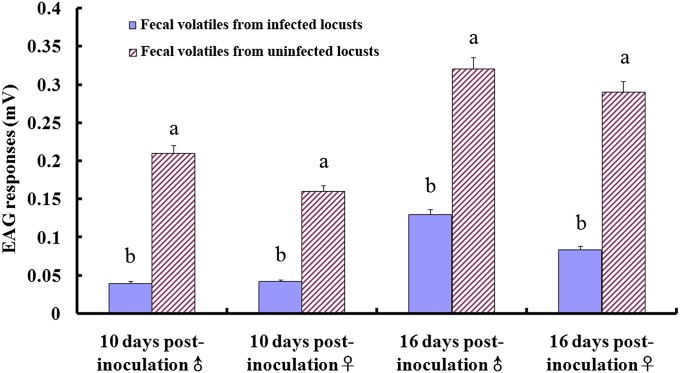
Fig. 3 shows the results of electroantennography (EAG) experiments when antennae from fifth instar and adult locusts were stimulated with fecal volatiles from healthy and infected insects. Antennal responses were up to fourfold higher when stimulated with fecal volatiles from healthy locusts. Thus, the reduced aggregation response to fecal volatiles from parasite-infected insects coincides with antennal responses.
Fig. 3.
EAG responses (mV; mean ± SE) of healthy locusts to fecal volatiles from locusts at 10 and 16 d after inoculation with P. locustae (20,000 spores per third instar nymph). Values are means of six replicates. Values with different letters are significantly different (P < 0.05, one-way ANOVA).
Infection by P. locustae Significantly Reduces the Amount of Nonanal Excreted in the Feces of Nymph and Adult L. migratoria manilensis Locusts.
We looked for P. locustae-induced changes that could account for the reduced antennal responses and aggregation behavior. We used nonanal to quantify the impact of P. locustae on the aggregation pheromone, because it is a major component of this pheromone. The amount of nonanal at 9 and 10 d postinoculation (20,000 spores per third instar) was reduced by 40.3% and 53.2%, respectively; by this time the P. locustae were 3- and 4-d-old fifth instars, respectively (Table 1). Lower doses (2 and 200 spores per insect) also significantly reduced the production of nonanal relative to uninfected insects, but to a significantly lesser extent (P < 0.05) (Table 1). These data suggest that the effect of P. locustae infection on fecal nonanal production is dose- and time-dependent.
Table 1.
Impact of P. locustae infection on nonanal production by nymphs
| Inoculation dose | Nonanal, ng/g | |
| 9 d postinoculation | 10 d postinoculation | |
| Untreated | 27.45 ± 5.23a | 81.72 ± 10.10a |
| 2 spores/locust | 22.14 ± 2.99ab | 50.93 ± 6.09b |
| 200 spores/locust | 14.80 ± 1.99bc | 41.28 ± 2.82b |
| 20,000 spores/locust | 16.40 ± 3.06bc | 38.25 ± 2.82b |
Data are mean ± SE levels of nonanal released from feces of third instar nymphs at 9 and 10 d after inoculation with P. locustae. Any two treatments with the same lower-case letter are not significantly different at α = 0.05 (one-way ANOVA).
By the time P. locustae-infected third instar nymphs had developed into adults, the levels of nonanal had become dependent on sex. Infected male adults emitted significantly more nonanal than the female adults (P < 0.05), but only infected females demonstrated significantly lower nonanal production compared with healthy insects (P < 0.05). With a high inoculum (20,000 spores per insect), the production of nonanal by the 4- and 5-d-old adult females (at 15 and 16 d postinoculation, respectively) was decreased by 73.4% (P < 0.05) and 62.8% (P < 0.05), respectively. Similar to nymphs, in adults lower inoculum doses produced significantly smaller reductions in nonanal production (Table 2).
Table 2.
Impact of P. locustae on nonanal production by adult locusts
| Nonanal, ng/g | |||
| Inoculation dose | 14 d postinoculation | 15 d postinoculation | 16 d postinoculation |
| Males | |||
| Untreated | 7.38 ± 1.67ab | 19.27 ± 4.10a | 35.70 ± 6.07a |
| 2 spores/locust | 12.25 ± 1.91a | 16.08 ± 4.70a | 30.75 ± 5.93a |
| 200 spores/locust | 7.70 ± 1.05ab | 21.02 ± 5.23a | 25.97 ± 0.83a |
| 20,000 spores/locust | 5.01 ± 2.96b | 17.14 ± 7.88a | 30.35 ± 6.89a |
| Females | |||
| Untreated | 10.97 ± 0.66a | 11.69 ± 2.36a | 18.31 ± 3.12a |
| 2 spores/locust | 8.50 ± 0.83a | 14.64 ± 4.56a | 24.05 ± 3.55a |
| 200 spores/locust | 1.28 ± 0.80b | 6.98 ± 2.91ab | 19.51 ± 2.72a |
| 20,000 spores/locust | 1.64 ± 1.64b | 3.11 ± 2.38b | 6.82 ± 1.10b |
Data are mean ± SE levels of nonanal released from feces of locusts at 14, 15, and 16 d after inoculation (i.e., 3-, 4-, and 5-d-old adult locusts). Any two treatments with the same lower-case letter are not significantly different at the level of α = 0.05 (one-way ANOVA).
Infection by P. locustae Reduces the Hindgut Bacterial Population in Migratory Locusts by Acidification.
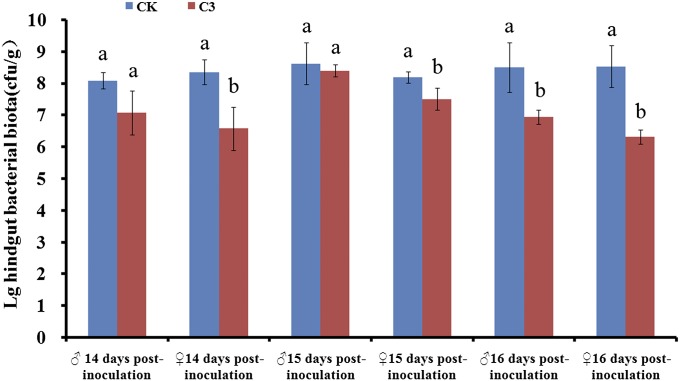
Because readily cultivatable hindgut bacteria are principally responsible for the synthesis of aggregation pheromone (6–8), we first investigated the effect of P. locustae on the number of bacterial colony-forming units (CFU) in the hindgut. Inoculum doses up to 20,000 spores per third instar nymph did not affect CFU counts at ≤10 d after inoculation (SI Appendix, Fig. S1); however, the CFU count in adult females at 14, 15, and 16 d postinoculation (20,000 spores per third instar) was reduced by 21.3% (χ2 = 9.501, P = 0.029; n = 8), 8.6% (χ2 = 9.462, P = 0.024; n = 8), and 25.9% (χ2 = 8.744, P = 0.033; n = 8), respectively. CFU counts in adult males at 14 and 15 d postinoculation were similar to those of noninfected adult locusts (χ2 = 2.333, P = 0.127; n = 8 and χ2 = 1.190, P = 0.275; n = 8, respectively), but CFU counts were reduced by 18.3% at day 16 (χ2 = 9.462, P = 0.024; n = 8) (Fig. 4).
Fig. 4.
Hindgut bacterial biota (mean ± SE) of L. migratoria manilensis at 14, 15, and 16 d postinoculation with P. locustae. CK, uninfected locusts (blue); C3, locusts infected with 20,000 P. locustae spores (red). Values with different letters are significantly different (P < 0.05, Kruskal–Wallis test).
From the hindguts of 5-d-old adult males and females, we isolated five primary cultivable bacteria. Phylogenetic analysis based on 16s rRNA sequences (SI Appendix, Table S7) identified these as Enterococcus spp, Enterobacter spp, Microbacterium spp, Lactococcus spp, and Weissella spp (SI Appendix, Fig. S2).
We then examined how parasitic infection reduced the hindgut bacterial population. Because a neutral pH provides a favorable environment for the locust microbiota (7), we tested the effect of parasite infection on pH values in the midgut and hindgut. Infection by P. locustae did not significantly change the pH in the midgut (SI Appendix, Fig. S3), but significantly reduced the pH in the hindgut, from 6.3 to 5.6 (P < 0.05), at 16 d postinoculation (SI Appendix, Fig. S4).
Because we could not collect sufficient hindgut content to serve as a medium in which to perform in vitro testing of the effect of acidification on the growth of the five primary hindgut bacteria, we used LB broth instead. Enterobacter spp and Lactococcus spp grew well at pH 6.3, but growth was almost completely inhibited at pH 5.6. Enterococcus spp, Microbacterium spp, and Weissella spp were able to grow at pH 5.6, at a significantly slower rate than seen at pH 6.3 (SI Appendix, Fig. S5). These results suggest acidification as the cause of the reduced hindgut bacterial population after P. locustae infection.
Gut Bacteria Confer Colonization Resistance to P. locustae.
We next investigated the effect of gut microbiota on infection of the hindgut by parasites. To do this, we depleted the gut bacteria by feeding the locusts with an antibiotic mixture, then immediately inoculated the locusts with P. locustae. At 16 d postinoculation, the antibiotic-treated locusts had significantly more hindgut parasites than the nontreated locusts (P < 0.05) (SI Appendix, Fig. S6), indicating that the hindgut bacteria provide a protective barrier against parasitic infection. Mutual inhibition of microbiota and parasites have been reported in other insect–parasite systems (20).
Exposure to Locusts Infected by P. locustae Reduces Serotonin Production in Healthy and Sick Locusts.
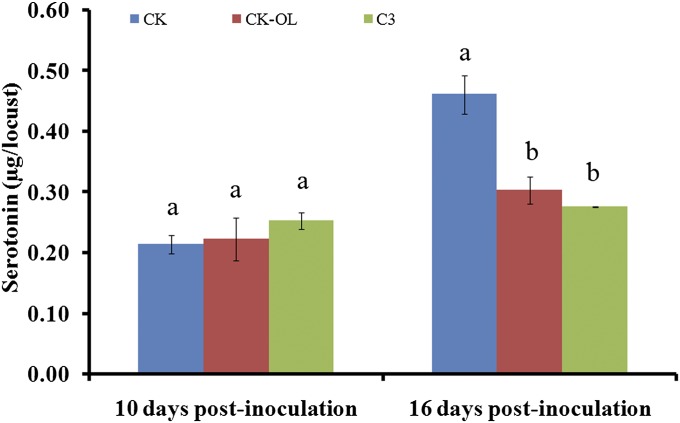
To study the mechanism by which a reduction in hindgut bacteria and aggregation pheromone suppresses gregarization, we assayed the level of serotonin, a neurotransmitter that initiates gregarization in L. migratoria manilensis. At 10 d after inoculation of third instar nymphs (20,000 spores per locust), the resulting 4-d-old fifth instars had similar levels of serotonin as uninfected healthy insects (χ2 = 1.19, P = 0.275; n = 15). However, at 16 d after inoculation (i.e., 5-d-old adults), serotonin levels were reduced by 40.2% compared with healthy insects (χ2 = 8.486, P = 0.004; n = 15). From 4-d-old fifth instar to 5-d-old adults (a gap of 6 d), serotonin levels rose 1.7-fold in healthy locusts, but remained unchanged in infected locusts.
We next assayed serotonin levels in healthy locusts that had been exposed to infected locusts. Healthy and P. locustae-infected locusts were individually reared in transparent plastic tubes that were capped with mesh and placed in a gregarious colony room, so the insects were not in physical contact but were exposed to the colony’s aggregation pheromone. Healthy locusts exposed to locusts infected 10 d earlier (20,000 spores per locust) showed similar serotonin levels as those exposed to healthy insects (χ2 = 0.105, P = 0.746; n = 15); however, healthy locusts exposed to infected locusts for 16 d produced 36.8% less serotonin compared with those exposed to healthy locusts (χ2 = 5.133, P = 0.023; n = 15) (Fig. 5).
Fig. 5.
Production (mean ± SE) of serotonin in the CNS of healthy and P. locustae-infected locusts that were exposed to olfactory stimuli from healthy locusts or to insects infected 10 or 16 d earlier (20,000 spores perthird instar nymphs). CK, uninfected locusts exposed to stimuli from healthy locusts (blue); CK-OL, uninfected locusts exposed to stimuli from infected locusts (red); C3, infected locusts exposed to stimuli from infected locusts (green). Values with different letters are significantly different (P < 0.05, Kruskal–Wallis test).
Genome-Wide Expression Analysis Reveals That Parasite Infection Suppresses Dopamine Production and Detoxification of Reactive Oxygen Species.
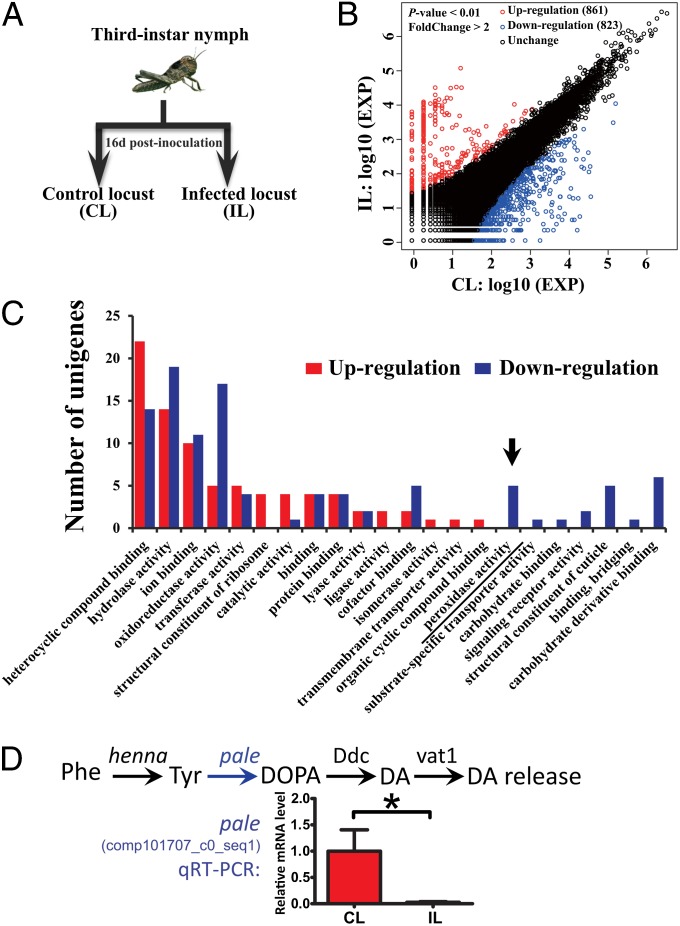
To systematically investigate the effect of P. locustae on phase changes, we used deep sequencing (RNA-Seq) to compare the transcriptomes of healthy locusts and locusts infected by P. locustae for 16 d (Fig. 6A). By 16 d, P. locustae infection causes significant reductions in the hindgut bacterial population and in the production of aggregation pheromones and serotonin. De novo assembly of transcripts resulted in 77,394 unigenes after removal of suspected parasite genes. Among these expressed unigenes, 1,684 showed differential expression between infected locusts and control locusts (fold change >2, P < 0.01 based on DESeq), of which 861 were up-regulated and 823 were down-regulated (Fig. 6B). The proportions and comparisons of differentially expressed unigenes and their distributions in three main Gene Ontology functional categories are summarized in SI Appendix, Fig. S7. The top three regulated categories were organic substance metabolic process, heterocyclic binding, and hydrolase activity. Remarkably, all five unigenes involved in peroxidase activity were down-regulated in infected locusts (Fig. 6C). Given that the primary role of peroxidases is to detoxify reactive oxygen species, their overall decrease could lead to an elevated level of reactive oxygen species, resulting in increased toxicity to parasites and hindgut bacteria.
Fig. 6.
Overview of RNA-Seq analysis of the effect of P. locustae infection on migratory locusts. (A) Experimental design of RNA-Seq analysis. (B) Overview of the differentially expressed unigenes calculated by DESeq. EXP, expression level based on normalization by DESeq. (C) Distribution of DEGs in the category of molecular function calculated by GO classification analysis. (D) P. locustae infection dramatically reduces expression of the gene pale, which encodes the rate-limiting enzyme for the biosynthesis of dopamine. (Upper) Schematic representation of dopamine metabolic module. (Lower) Quantitative RT-PCR validation of the down-regulation of pale. Phe, phenylalanine; Tyr, l-tyrosine; DOPA, 3,4-dihydroxy-l-phenylalanine; DA, dopamine.
Differentially expressed gene (DEG) analysis identified the KEGG ontology of tyrosine hydroxylase (K00501). RNA-Seq and subsequent validation by quantitative RT-PCR confirmed that the unigenes in this KEGG ontology are down-regulated by P. locustae infection (Fig. 6D). The expression of one of these unigenes, corresponding to the gene pale that encodes a tyrosine hydroxylase (comp101707_c0_seq1; sequence shown in SI Appendix, Table S6), the rate-limiting enzyme that controls the biosynthesis of dopamine in migratory locusts (15), was reduced 37.4-fold (Fig. 6D). Other researchers have reported that suppressing the expression of pale by 75% using RNAi reduces dopamine production, causing a shift from gregarious behavior to solitary behavior (15). The reduced production of the neurotransmitters serotonin (which initiates gregarization) and dopamine (which induces and maintains gregarization) is consistent with P. locustae infection blocking the aggregation of solitary locusts and inducing gregarious locusts to transform back to the solitary phase.
Other results obtained from RNA-Seq analysis are presented in SI Appendix, Results.
Conclusion
This study reveals that the mechanism by which the microsporidian parasite P. locustae inhibits the transition from solitary behavior to gregarious behavior and transforms the gregarious phase back to solitary behavior involves a reduction in the hindgut bacterial population that produces the aggregation pheromone. We identified acidification of the hindgut and increased production of reactive oxygen species as contributing to the reduction in bacterial populations. The pronounced acidification by itself could account for this inhibition. The reduction in aggregation pheromone reduces levels of serotonin and dopamine, which work synergistically to initiate, induce, and maintain gregarization of migratory locusts. The mutual inhibition between gut microbiota and parasites with impaired swarm behavior of migratory locusts could be exploited to develop novel microsporidian formulas and application technologies to enhance the ability of P. locustae to control locusts.
The ability of parasites to modify the behavior of their hosts is well documented. These modifications are mostly beneficial to the parasites. For example, grasshoppers infected with the hairworm parasite become more likely to fling themselves into water and drown, benefitting the hairworm, which can reproduce only in water (2). Conversely, the behavioral changes caused by P. locustae infection do not appear to be beneficial to the parasite, but do seem beneficial to the locust population. P. locustae is transmitted through cannibalism of infected dying insects, fecal contamination, and transovarial transfer from infected females to their offspring; thus, aggregation of locusts presumably would facilitate transmission of the parasite. However, infection by P. locustae suppresses aggregation of locusts, making the insects antisocial to avoid disease transmission.
Materials and Methods
Insects and Parasites.
The L. migratoria manilensis migratory locusts used in this study were obtained from a laboratory colony originating from a stock obtained from the Key Laboratory for Bio-Control of Locusts of the Chinese Ministry of Agriculture, Beijing. The locusts were maintained as described previously (9).
The original stock of P. locustae was obtained from the US Department of Agriculture, Agricultural Research and Service, Rangeland Insect Laboratory, Montana State University, Bozeman. Propagation of parasites was performed as described previously (21).
Collection of Fecal Volatiles and Analysis of Nonanal.
Volatiles from feces were collected as described previously (10). In brief, volatiles from 3 g of feces were collected by headspace solid-phase microextraction (100 μm polydimethylsiloxane; Supelco) for 0.5 h, and then desorbed for 3 min at 250 °C.
Nonanal in the fecal volatiles was analyzed with a Hewlett Packard model 6890 Series II gas chromatograph equipped with a splitless capillary injector system, a flame ionization detector, and HP 3365 Series II ChemStation (HP Vectra and compatible software products; Agilent Technologies). The gas chromatograph oven was fitted with an HP fused carbowax capillary column (50 m × 0.2 mm × 0.1 μm) programmed initially at 40 °C for 5 min, then increasing in 3 °C/min increments to 100 °C, at 8 °C/min increments to 160 °C, and at 20 °C/min increments to 250 °C. Chromatographic peaks were integrated using Hewlett Packard HP 3365 Series II ChemStation. The nonanal content in feces was quantified by the GC-external standard method (standard curve: Y = 7.1787 X − 4.649, R2 = 0.9952, where X is the peak area from standard nonanal and Y is the nonanal quantity). Statistical analyses were performed using SPSS version 11.50.
Exposure to Olfactory Stimuli from Locusts.
Locusts were placed individually in clear plastic pint glass tubes (7 × 6 × 6 cm) with double-layered aluminum mesh covering the top. Thirty tubes were placed in a large rearing cage (140 × 120 × 120 cm) in the gregarious colony room (5 × 4 × 3 m; 30–32 °C; light-dark cycle of 12:12 h; relative humidity 60–70%). Thus, these insects received olfactory stimuli from other locusts, but had no physical contact with those locusts. This experiment was repeated three times, with three replicates for each repeat.
EAG Tests.
Nymph and adult L. migratoria manilensis locusts were removed from rearing cages and maintained in small individual cages. After 2 h without food, an antenna was removed from each locust using fine forceps. The antenna was then cut with a scalpel at the base of the third broad segment, and the EAG responses of the antenna elicited by volatiles from 8 g of locust feces were measured as described previously (9).
Behavioral Bioassays.
A two-choice olfactometer made of transparent glass (9) was used to investigate aggregation of locusts [fifth instar nymphs (3–4 d-old) and 3–5 d-old adults] elicited by fecal volatiles. Each locust was observed for 3 min. The bioassay room was aerated by a duct system that maintained a negative pressure. All tests were replicated three times with 20 insects for each replicate, and each locust was used only once. The distribution and time spent in each compartment (retention time in s) of the olfactometer were recorded. The arrestment percent was calculated as 100 (T/n), where T is the number of locusts found in the treated compartment and n is the total number of locusts tested.
Quantification of Hindgut Bacterial Biota of L. migratoria manilensis
Locusts were starved for 24 h, after which their hindguts were dissected, weighed, and homogenized in 800 µL of sterile water. The homogenates were then serially diluted 10-, 100-, and 1,000-fold. The 10 μL of each diluted homogenate was evenly plated on an LB plate and incubated at 28 °C for 24 h to determine bacterial numbers by counting CFU. Results are shown as CFU/g.
Quantification of Serotonin in Nervous Tissue Extracts.
After being exposed to olfactory stimulus, locusts were separated and left undisturbed in a muslin-covered plastic container for 1 h. The container was then gently lifted with long forceps and snap- frozen in liquid nitrogen. Mouthparts, wings, and legs were removed, and the main body was placed on a dissection block on ice. The complete thoracic ganglia and ventral nerve cord were dissected and homogenized in 50 μL of trichloroacetic acid (0.1 g/mL). The homogenate was then centrifuged for 30 min at 17,500 × g. The supernatant was dried for 8 h in a freeze-drying apparatus, and the residue was dissolved in 50 μL of ddH2O for reverse-phase HPLC analysis of serotonin (5-hydroxytryptamine; 5HT) as described previously (13). The standard serotonin was purchased from Sigma-Aldrich. The serotonin concentration in the CNS was quantified by the HPLC-external standard method (standard curve: Y = 0.3042 X + 0.0688, R2 = 0.9973, where X is peak height from standard serotonin and Y is serotonin concentration).
Measurement of pH in Insect Midguts and Hindguts.
Hindguts or midguts were dissected and collected into a centrifugal tube, and the intestinal contents were squeezed out by centrifugation (Eppendorf C5424R, Germany) at 3,000 rpm for 10 min. Supernatant pH values were immediately measured with micro pH meter (In Lab Micro Mettler). There were three replicates with 10 insects each. The experiment was repeated three times.
Classification of Bacterial Isolates from Hindguts and Determination of Their Growth Under Different pH Values.
Bacteria isolated from the hindguts of migratory locusts were classified using phylogenetic analysis based on the 16s rRNA sequence as described previously (22). The primers for 16s RNA cloning are listed in SI Appendix, Table S1.
Bacterial growth was tested on an automatic microbial growth analyzer (Bioscreen C; Oy Growth Curves Ab Ltd., Helsinki) as described previously (23). LB broth was used as the medium. To test the effect of pH on the growth of hindgut bacteria, the LB broth was adjusted to pH 6.3 or 5.6. The bacteria were cultured at 37 °C for 36 h, with OD600 values recorded automatically every hour. There were three replicates for each treatment, and the experiment was repeated three times.
Detection of Colonization Resistance Provided by Gut Microbiota.
To deplete gut bacteria, third instar nymphs were fed individually with an antibiotic mixture (penicillin, gentamicin, rifampicin, and streptomycin, 500 μg/mL each) twice daily for 2 d. Control nymphs were fed with sterile water. All nymphs were inoculated with 20,000 P. locustae spores per locust and reared as described above. At 16 d postinoculation, the hindguts were dissected individually, weighed, and homogenized in sterile water. The mixture was then centrifuged (Eppendorf C5424R, Germany) at 500 rpm for 20 min, and the number of spores in the supernatant was quantified with a hemocytometer. There were three replicates, each with 10 insects. The experiment was repeated three times.
Transcriptomic Analysis Using RNA-Seq.
To systematically investigate the effect of P. locustae on the phase change of L. migratoria manilensis, we used a high-throughput sequencing platform (HiSeq 2500; Illumina) to compare gene expression in healthy locusts and locusts infected by P. locustae. The inoculation dose was 20,000 spores per third instar nymphs. After 16 d, the insects were dissected, and fat bodies were collected for RNA preparation with TRIzol reagent (Life Technologies). Construction of libraries and sequencing with the Illumina HiSeq 2500 platform were performed by Berry Genomics. After paired-end sequencing, clean reads were obtained using NGS QC Toolkit (24).
Owing to the unavailability of locust genome sequence, Trinity version 2013-02-25 was used to de novo assemble the clean reads to obtain reference unigenes (25). Alignment was performed using Bowtie 2 (26), and the RPKM method (27) was used to calculate the expression of transcripts. The differential expressed transcripts were identified using DESeq software (28). KO numbers of transcripts were obtained by BLASTX against KEGG (29) and then mapped back to the database to obtain pathways. Finally, Blast2GO was used for functional annotation and enrichment of the DEGs (P < 10−5) (30).
Supplementary Material
Acknowledgments
We thank L. Zhang for assisting with tests of locust hindgut bacterial biota and X. Shi for assisting with serotonin analyses. This work was funded by the National Natural Science Foundation of China (Grant 31272092, to W.S.), the Program on Helping Xinjiang with Technology (Grant 201291136, to W.S.), the 1,000 Young Talents Program of China (to W.F.), and the Zhejiang Provincial Natural Science Foundation of China (Grant LR13C010001, to W.F.).
Footnotes
The authors declare no conflict of interest.
This article is a PNAS Direct Submission.
Data deposition: The raw reads obtained by RNA sequencing reported in this paper have been deposited in the Sequence Read Archive (SRA), http://www.ncbi.nlm.nih.gov/sra (accession no. SRP033118).
This article contains supporting information online at www.pnas.org/lookup/suppl/doi:10.1073/pnas.1314009111/-/DCSupplemental.
References
- 1.Adamo SA, Webster JP. Neural parasitology: How parasites manipulate host behaviour. J Exp Biol. 2013;216(Pt 1):1–2. doi: 10.1242/jeb.082511. [DOI] [PubMed] [Google Scholar]
- 2.Libersat F, Delago A, Gal R. Manipulation of host behavior by parasitic insects and insect parasites. Annu Rev Entomol. 2009;54:189–207. doi: 10.1146/annurev.ento.54.110807.090556. [DOI] [PubMed] [Google Scholar]
- 3.Buhl J, et al. From disorder to order in marching locusts. Science. 2006;312(5778):1402–1406. doi: 10.1126/science.1125142. [DOI] [PubMed] [Google Scholar]
- 4.Byers JA. Pheromones and chemical ecology of locusts. Biol Rev Camb Philos Soc. 1991;66:347–378. [Google Scholar]
- 5.Pener MP, Yerushalmi Y. The physiology of locust phase polymorphism: An update. J Insect Physiol. 1998;44(5-6):365–377. doi: 10.1016/s0022-1910(97)00169-8. [DOI] [PubMed] [Google Scholar]
- 6.Dillon RJ, Vennard CT, Charnley AK. Exploitation of gut bacteria in the locust. Nature. 2000;403(6772):851. doi: 10.1038/35002669. [DOI] [PubMed] [Google Scholar]
- 7.Dillon RJ, Charnley K. Mutualism between the desert locust Schistocerca gregaria and its gut microbiota. Res Microbiol. 2002a;153(8):503–509. doi: 10.1016/s0923-2508(02)01361-x. [DOI] [PubMed] [Google Scholar]
- 8.Dillon RJ, Vennard CT, Charnley AK. A note: Gut bacteria produce components of a locust cohesion pheromone. J Appl Microbiol. 2002b;92(4):759–763. doi: 10.1046/j.1365-2672.2002.01581.x. [DOI] [PubMed] [Google Scholar]
- 9.Shi WP, Njag PGN. Disruption of aggregation behavior of oriental migratory locusts (Locusta migratoria manilensis) infected with Nosema locustae. J Appl Entomol. 2004;128:414–418. [Google Scholar]
- 10.Shi WP, Sun HL, Edward N, Yan YH. Fecal volatile components elicit aggregation in the oriental migratory locust, Locusta migratoria manilensis (Orthoptera: Acrididae) Insect Sci. 2011;18:166–174. [Google Scholar]
- 11.Centre of Overseas Pest Research . The Locust and Grasshopper Agricultural Manual. London: Centre of Overseas Pest Research; 1982. pp. 449–467. [Google Scholar]
- 12.Rogers SM, et al. Substantial changes in central nervous system neurotransmitters and neuromodulators accompany phase change in the locust. J Exp Biol. 2004;207(Pt 20):3603–3617. doi: 10.1242/jeb.01183. [DOI] [PubMed] [Google Scholar]
- 13.Anstey ML, Rogers SM, Ott SR, Burrows M, Simpson SJ. Serotonin mediates behavioral gregarization underlying swarm formation in desert locusts. Science. 2009;323(5914):627–630. doi: 10.1126/science.1165939. [DOI] [PubMed] [Google Scholar]
- 14.Verlinden H, Badisco L, Marchal E, Van Wielendaele P, Vanden Broeck J. Endocrinology of reproduction and phase transition in locusts. Gen Comp Endocrinol. 2009;162(1):79–92. doi: 10.1016/j.ygcen.2008.11.016. [DOI] [PubMed] [Google Scholar]
- 15.Ma ZY, Guo W, Guo X, Wang X, Kang L. Modulation of behavioral phase changes of the migratory locust by the catecholamine metabolic pathway. Proc Natl Acad Sci USA. 2011;108(10):3882–3887. doi: 10.1073/pnas.1015098108. [DOI] [PMC free article] [PubMed] [Google Scholar]
- 16.Lange CE. The host and geographical range of the grasshopper pathogen Paranosema (Nosema) locustae revisited. J Orthop Res. 2005;14:137–141. [Google Scholar]
- 17.Solter LF, Becnel JJ, Oi DH. Insect Pathology, Microsporidian Entomopathogens. Boston: Academic Press; 2012. pp. 221–263. [Google Scholar]
- 18.Canning EU. The life cycle of Nosema locustae Canning in locusta migratoria migratorioides (R&F) and its infectivity to other hosts. J Invertebr Pathol. 1962;4:37–247. [Google Scholar]
- 19.Canning EU. The pathogenicity of Nosema locustae Canning. J Insect Pathol. 1962;4:248–256. [Google Scholar]
- 20.Cirimotich CM, et al. Natural microbe-mediated refractoriness to Plasmodium infection in Anopheles gambiae. Science. 2011;332(6031):855–858. doi: 10.1126/science.1201618. [DOI] [PMC free article] [PubMed] [Google Scholar]
- 21.Fu XJ, Hunter DM, Shi WP. Effect of Paranosema (Nosema) locustae (Microsporidia) on morphological phase transformation of Locusta migratoria manilensis (Orthoptera:Acrididae) Biocontrol Sci Technol. 2010;20:683–693. [Google Scholar]
- 22.Clarridge JE., 3rd Impact of 16S rRNA gene sequence analysis for identification of bacteria on clinical microbiology and infectious diseases. Clin Microbiol Rev. 2004;17(4):840–862. doi: 10.1128/CMR.17.4.840-862.2004. [DOI] [PMC free article] [PubMed] [Google Scholar]
- 23.Lambert RJ, Pearson J. Susceptibility testing: accurate and reproducible minimum inhibitory concentration (MIC) and non-inhibitory concentration (NIC) values. J Appl Microbiol. 2000;88(5):784–790. doi: 10.1046/j.1365-2672.2000.01017.x. [DOI] [PubMed] [Google Scholar]
- 24.Patel RK, Jain M. NGS QC Toolkit: A toolkit for quality control of next generation sequencing data. PLoS ONE. 2012;7(2):e30619. doi: 10.1371/journal.pone.0030619. [DOI] [PMC free article] [PubMed] [Google Scholar]
- 25.Grabherr MG, et al. Full-length transcriptome assembly from RNA-Seq data without a reference genome. Nat Biotechnol. 2011;29(7):644–652. doi: 10.1038/nbt.1883. [DOI] [PMC free article] [PubMed] [Google Scholar]
- 26.Langmead B, Salzberg SL. Fast gapped-read alignment with Bowtie 2. Nat Methods. 2012;9(4):357–359. doi: 10.1038/nmeth.1923. [DOI] [PMC free article] [PubMed] [Google Scholar]
- 27.Mortazavi A, Williams BA, McCue K, Schaeffer L, Wold B. Mapping and quantifying mammalian transcriptomes by RNA-Seq. Nat Methods. 2008;5(7):621–628. doi: 10.1038/nmeth.1226. [DOI] [PubMed] [Google Scholar]
- 28.Anders S, Huber W. Differential expression analysis for sequence count data. Genome Biol. 2010;11:R106. doi: 10.1186/gb-2010-11-10-r106. [DOI] [PMC free article] [PubMed] [Google Scholar]
- 29.Kanehisa M, Goto S. KEGG: Kyoto Encyclopedia of Genes and Genomes. Nucleic Acids Res. 2000;28(1):27–30. doi: 10.1093/nar/28.1.27. [DOI] [PMC free article] [PubMed] [Google Scholar]
- 30.Conesa A, et al. Blast2GO: A universal tool for annotation, visualization and analysis in functional genomics research. Bioinformatics. 2005;21(18):3674–3676. doi: 10.1093/bioinformatics/bti610. [DOI] [PubMed] [Google Scholar]
Associated Data
This section collects any data citations, data availability statements, or supplementary materials included in this article.


