

Significance
The brain undergoes significant maturation during adolescence that influences reward sensitivity and risk-taking behavior. However, it is unknown if the adolescent brain truly values rewards in a way that is unique from the mature brain or if confounding factors contribute to this developmental difference. Here we show that adolescents place greater value on rewards than do adults through exaggerated activation of the ventral striatum and that this valuation increases gambling behavior. This developmental effect remains even when controlling for income and task performance. We also find that heightened reward sensitivity leads to more advantageous risk-taking in adolescents versus adults. These data provide behavioral and neural evidence for ontogenetic differences in how value computation is used to bias reward-related behavior during adolescence.
Abstract
Previous work shows that the adolescent reward system is hyperactive, but this finding may be confounded by differences in how teens value money. To address this, we examined the neural ontogeny of objective value representation. Adolescent and adult participants performed a monetary gambling task in which they chose to accept or reject gambles of varying expected value. Increasing expected value had a stronger influence over gambling choices in adolescents relative to adults, an effect that was paralleled by greater activation in the ventral striatum in adolescents. This unique adolescent ventral striatum response remained even after matching groups on acceptance behavior. These behavioral and neural data suggest that the value of available options has a greater influence in adolescent versus adult choices, even when objective value and subjective choice are held constant. This research provides further evidence that hyperactivation of reward circuitry in adolescence may be a normative ontogenetic shift that is due to greater valuation in the adolescent brain.
Adolescence is characterized by heightened sensitivity to rewards (1). This phenotype is subserved by exaggerated neural response in ventral striatum (VS) to the anticipation (2) and receipt of expected (3–5) and unexpected reward (6) in adolescents versus other age groups. The question remains, however, whether this effect is mediated by ontogenetic differences or simply a methodological consequence of using money as the rewarding stimulus. In other words, does the adolescent brain attribute greater value to available rewards, or is the effect driven by adolescents valuing money to a greater extent than adults because they typically have less access to and experience with it? The goal of this study was to disentangle these possibilities by examining subjective valuation (indexed by behavior) of objectively valued choices.
Subjective value (SV) is defined as the value that an individual places on a stimulus (7). To make a choice, an organism determines the SV of each alternative and then selects the one with the greatest SV (8, 9). A recent metaanalysis of 206 studies of SV in adults identified the ventromedial prefrontal cortex (VMPFC) and VS as a “valuation system” (8). These regions represent SV during choice for monetary stimuli (10–14), charitable donations (15), consumer goods (16), and food (17–19). Despite the wealth of knowledge on the neural correlates of SV in adults, no previous studies have examined the neurobiological development of SV, which precludes ruling out the possibility that previous findings in support of a hyperactive adolescent reward system were confounded by differences in participant valuation.
One approach to understanding the neural computation of SV is through measurement of expected value (EV), the sum of all of the possible outcomes of a particular choice multiplied by their probabilities (20). In adults, increasing EV yields parametric activation increases in bilateral VS, midbrain, medial prefrontal cortex (MPFC), and dorsolateral prefrontal cortex (DLPFC) (21–25).
It is currently unknown if there are ontogenetic differences in how EV is represented in the brain and whether these differences confer a greater influence in value-based choices in adolescents versus adults. We investigated the adolescent and adult neural response to parametrically increasing EV using a simple mixed gambles task (Fig. 1) (12) during functional magnetic resonance imaging (fMRI). We hypothesized that adolescents would exhibit greater behavioral sensitivity (accept more gambles) to increasing EV. Neurobiologically, we predicted that VS activation would modulate in proportion to increasing EV more for adolescents than for adults. A secondary analysis was conducted to test the hypothesis that an exaggerated VS activation in adolescents would be observed even after matching adolescents and adults on subjective valuation (acceptance of gambles). In other words, we predicted that even adults who behaved like adolescents in terms of gambling behavior would not exhibit hyperactive striatal activation.
Fig. 1.

Example of three trials from the mixed gambles task. Participants responded within 3,000 ms by pressing one of four keys. A jittered interstimulus interval followed before the subsequent trials. Gamble outcomes were not revealed during the scan.
Results
Behavioral Results.
An analysis of variance (ANOVA) analysis revealed a main effect of trial type on accept rates [F(2,38) = 44.20, P < 0.001]. Across all participants, trials with positive EV (EV+ trials) were accepted significantly more often than trials with EV of zero (EV0 trials) [MEV+ = 48.28% (SD = 28.12%), MEV0 = 31.80% (SD = 28.72%), t (39) = 4.504, P = 0.000], which were accepted significantly more often than trials with negative EV (EV− trials) [M EV− = 13.52% (SD = 13.54%), t (39) = 5.406, P = 0.000]. No significant differences were observed between adolescent and adult participants in the percentage of EV+ trials accepted [Madolescent = 50.17% (SD = 28.40%), Madult = 46.20% (SD = 28.47%), t (38) = 0.442, P = 0.661], the percentage of EV0 trials accepted [Madolescent = 31.09% (SD = 27.92%), Madult = 32.58% (SD = 30.32%), t (38) = −0.162, P = 0.872], or the percentage of EV− trials accepted [Madolescent = 13.20% (SD = 13.90%), Madult = 13.87% (SD = 13.51%), t (38) = −0.154, P = 0.878].
Hierarchical linear modeling (HLM) revealed a significant effect of the slope of EV on response [β = 0.18, t (35) = 5.79, P < 0.001], where increasing EV increased the likelihood of an accept response. The model also showed a significant effect of age group [β = −0.09, t (35) = −2.38, P = 0.023] such that parametric changes in positive EV had a greater effect on response for adolescents than for adults (Fig. 2). Income was added as an additional level 1 predictor to the multilevel model to determine if it explained the relationship between increasing EV and rate of acceptance in adolescents. As illustrated in Fig. S1, amount of disposable income did not have an effect on the relationship between EV and acceptance rates. To determine if the adolescent sensitivity to increasing EV was specific to changes in risk, we examined the 24 “gain-only” and 24 “loss-only” trials that were randomly interspersed throughout the experiment and which were not risky (i.e., outcome was known to the participant) (Materials and Methods and Fig. S2). HLM analyses were used to determine if behavior (acceptance rates) would also show developmental differences for reward amounts that were not at risk. Results show that acceptance rates do not change in either adolescents or adults when there is no risk involved in both gain-only and loss-only trials (Fig. S2), suggesting that the adolescents behaved similarly to adults when there was no risk involved.
Fig. 2.

The effect of increasing EV on behavioral responses for adolescents and adults. For both groups, increasing EV increased the likelihood of accepting a gamble. The influence of increasing EV on response was greater for adolescents versus adults.
No significant differences were observed between adolescent and adult participants in reaction time (RT) for EV+ trials [Madolescent = 1,364 ms (SD = 297 ms), Madult = 1,354 ms (SD = 241 ms), t (38) = 0.115, P = 0.909], EV− trials [Madolescent = 1,375 ms (SD = 310 ms), Madult = 1,293 ms (SD = 230 ms), t (38) = 0.939, P = 0.354], or EV0 trials [Madolescent = 1,393 ms (SD = 360 ms), Madult = 1,245 ms (SD = 192 ms), t (38) = 1.624, P = 0.113].
General Linear Model Results.
Whole-brain analyses revealed significant activation associated with parametrically increasing EV in the superior MPFC (X = 6, Y = 28, Z = 34), DLPFC (X = 40, Y = 34, Z = 28), and bilateral clusters encompassing the lateral occipital cortex, angular gyrus, and supramarginal gyrus (X = 52, Y = −40, Z = 42; X = −36, Y = −66, Z = 48); activation in these regions increased with increasing EV (Fig. 3A). The negative parametric contrast, identifying regions wherein activation decreased with increasing EV, revealed significant activation in bilateral regions including amygdala (X = 18, Y = −6, Z = −20; X = −24, Y = −6, Z = −22), parahippocampal gyrus (X = 24, Y = −34, Z = −18; X = −22, Y = −40, Z = −18), hippocampus (X = 24, Y = −14, Z = −18; X = −24, Y = −14, Z = −22), and insula (X = 36, Y = −18, Z = 4; X = −40, Y = −12, Z = 0) (Fig. 3B).
Fig. 3.

Parametric analyses revealed neural activation that changes in proportion with increasing EV. (A) Regions showing increasing activation with increasing EV. (B) Regions showing decreasing activation with increasing EV. Data represent activation collapsed across all participants.
Comparison by Age Group.
Region of interest (ROI) analyses revealed a significant parametric activation difference in response to increasing EV between adolescents and adults in the left VS (X = −12, Y = 6, Z = −10), z = 3.01, P = 0.0223, cluster size = 8 voxels (Fig. 4). In left VS, adolescents showed greater neural sensitivity to increasing EV than did adults. No significant differences between adolescents and adults in response to increasing EV were observed in ROI analyses for MPFC, DLPFC, or right VS. In addition, no significant differences in negative parametric activation in response to increasing EV were observed in ROI analyses for right amygdala, left amygdala, right insula, or left insula. No significant differences in left VS activation were observed between adolescents and adults when all trial types (EV−, EV0, and EV+) were grouped together (Fig. S3); however, there is a trend toward slightly less activation for adolescents than for adults during EV− trials (P = 0.175).
Fig. 4.

(A) Significant activation was observed for adolescent participants in left VS in response to parametrically increasing EV, z = 3.45, P = 0.012, cluster size = 28 voxels. No significant activation was observed for adult participants. (B) There was a significant developmental difference in left VS, z = 3.01, P = 0.0223.
Performance-Matched Analysis.
To isolate the unique contribution of ontogeny to the observed neural differences between age groups, we conducted a secondary analysis in which participants were matched on trial acceptance behavior. This analysis allowed us to determine if the ontogenetic differences in VS activation in the primary analysis remained even when adolescents and adults were matched on both objective value (EV of presented trials) and subjective valuation behavior (acceptance of trials). We focused on trials with high expected value because these trials were the ones most likely to elicit accept behavior—only participants who accepted these trials at a rate of >80% were included (Fig. 5A) (n = 23; 14 adolescents and 9 adults). The analysis revealed that adolescents exhibited greater activation in the right VS compared with adults (Fig. 5B) (greater left VS activation in adolescents was also observed at uncorrected threshold).
Fig. 5.
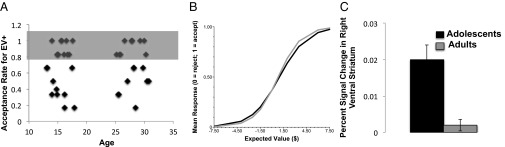
(A) A performance-matched analysis only included data from adult and adolescent participants (indicated in gray box) who accepted >80% of gambles. (B) An HLM analysis confirms that the subset of participants highlighted in A do not differ in their behavior. (C) This analysis revealed greater activation in adolescents in right VS (12, 10, −6) (corrected).
Discussion
The aim of this study was to identify neural representation of EV in the adolescent brain. Consistent with the strong consensus in the adult literature (8), we observed activation of MPFC and DLPFC and adjacent cortical regions during EV computations. Our observation of decreased activation in insula in response to increasing EV is also supported by existing findings (23, 26). However, we observed robust developmental differences in the VS, such that adolescents exhibited significantly greater activation than adults (who showed virtually no activation in this region), suggesting that maturational changes in neural representation of valuation during adolescence are most robust in the VS. Furthermore, we found hyperactivation in the adolescent striatum even when adolescents were compared with adults who exhibited the same gambling behavior. By incentivizing participants with monetary rewards, several studies (e.g., refs. 2–4, 27) have observed greater VS activation in adolescents versus adults, which may simply be a manifestation of the relatively less money/income that adolescents have relative to adults, leading to the possibility that the money is more intrinsically valuable to the adolescents. However, these findings suggest that the unique adolescent response to rewards is mediated by ontogenetic differences in valuation and that it is not simply a methodological consequence of using money as the rewarding stimulus. Our finding that income did not explain differences in neural activation between groups provides further evidence for this claim.
Role of EV on Adolescent Choices.
There are a few plausible explanations for the greater VS sensitivity in adolescents during computation of EV. One possibility is that adolescents are less adept than adults at computing EV and so VS activation is simply a response to the potential monetary earnings. However, the observed similarities among adolescents and adults in preference for trials with positive EV and low acceptance rate of trials with negative EV suggests that adolescents are just as capable as adults at discriminating the EV trial types. A second possibility is that the adolescent brain places greater value on potential rewards than does the adult brain. Two pieces of evidence support this speculation: first, parametric increases in EV were more influential in increasing the likelihood of accepting the gambles in adolescents, particularly on the highest-EV trials. In fact, these data suggest that adolescents were making more advantageous choices than adults in the face of positive EV; for instance, on trials with a positive EV of $6 (as shown in Fig. 1), adolescents accepted the gamble at a rate of 65% (compared with 48% in adults). We speculate that on these EV+ trials, the likelihood of accepting the gamble was higher in the adolescents because they were swayed by the possibility of winning the larger dollar amount and less focused on the chance of losing the relatively smaller amount. On these trials, the heightened adolescent sensitivity to reward was in fact adaptive because it led to a more rational choice (i.e., accepting a gamble with high positive EV). Despite the allure of the positive dollar amounts, however, the adolescents discerned between the different trial types; on trials with negative EV, their likelihood of accepting the gamble was, like adults, virtually zero. Together, the behavioral data on the positive and negative EV trials suggest that although adolescents are as astute as adults when presented with a disadvantageous choice, their heightened sensitivity in reward circuitry leads to better choices than adults on advantageous trials.
This adaptable behavior in adolescence may be evidence for a more flexible reward system (28), one that encourages more or less approach behavior based on dynamic options. The finding of adolescent behavioral flexibility in response to changes in reward, rather than simply bias toward potential gains across magnitudes, is reinforced by the fact that collapsed across all EV+ trials, adolescents and adults do not differ in their proportion of trials accepted or their absolute neural response to those trials (Fig. S3). Consistent with our findings, adolescents and adults have been shown to be similarly risk-tolerant for EV+ gambles with 50% probability of winning (29); notably, both studies show that adolescent risk tolerance increases with increasing expected value relative to adults, indicative of sensitivity to value in conditions where risk is explicit. One by-product of this flexibility is the appearance of adolescents as being more avoidant of aversive stimuli (including disadvantageous risks) than adults are, which is in keeping with their somewhat reduced neural activation in response to EV− trials relative to adults in the current study (Fig. S3). This is consistent with heightened adolescent behavioral sensitivity to aversive stimuli (30) and similar or heightened measurements of adolescent risk perception relative to adults (31), which challenges the anecdotal lore that adolescents think they are invulnerable to negative outcomes. More research on this important question is necessary.
In an ecological sense, what might be the broader implications of a more flexible system during adolescence? If the goal of adolescence is to help individuals reach developmental milestones that facilitate independence, it is adaptive for the adolescent brain to exhibit approach behavior (here in the form of acceptance rates) to choices that they find particularly valuable. The neural support for this approach behavior leads to increased drive, motivation, and energy to help adolescents become the fervid activists, leaders, and explorers that propel our species forward. It is no coincidence that young people are often at the forefront of new ideas, impassioned defenders of ideals, and the ones having the best time. From an ecological perspective, this increased proclivity toward exploration and willingness to take risks, regardless of the potentially harmful consequences, as individuals reach sexual maturation, facilitates important developmental milestones. Seeking out potential mates, self-reliance, and new adventures is at the very core of transitioning from a state of dependence on caregivers to one of relative independence (32).
Finally, an alternative possibility is that age-related differences in sensitivity to value may have been observed because there are developmental differences in subjective value for small sums of money. Although the objective EV of any particular gamble is fixed, economic theories suggest that subjective value is a concave (rather than linear) function, which is sensitive to differences in individual states of wealth (33). By this reasoning, for a gamble of +$20/−$5 (with EV = $7.50) an adolescent with less disposable income would place a larger subjective value on the chance to win $7.50 than an adult with a larger income would, making the adolescent’s VS more responsive to small changes in EV. However, we did not find a relationship between activation in the VS and disposable income in our sample, nor did we find disposable income to significantly alter the impact of EV on gamble acceptance; it should be noted that our measure of available spending money was rather imprecise, and a replication study is warranted. Subsequent studies could also explore this question by varying the magnitude of EVs more dramatically within a task or by attempting to equate subjective, rather than objective, values across age groups.
Ontogenetic Differences in Neural Representation of EV.
Similar to previous studies, these findings provide evidence for an exaggerated neural response to rewards in adolescents versus adults in the VS (2–4, 30, 34). The current study extends these previous findings by offering a possible explanation for adolescent sensitivity to reward and may help disentangle some of the divergent results in the adolescent literature (35, 36). The sensitivity to EV observed in this study may underlie adolescent sensitivity to experienced reward observed in other studies because adolescents may experience those rewards as having greater subjective value than adults do. fMRI reward studies that find less activation in VS in adolescents versus adults in anticipation of reward (35, 36), or no age-related differences in response to reward receipt compared with children (37) or adults (27, 36), may have used computer tasks that are not developmentally appropriate. For instance, the monetary incentive delay (MID) task (37) used by Bjork et al. (35, 36) and the card-guessing game (38) used by Forbes et al. (39, 40) were designed for adults without modification for use with younger populations. As noted by the authors, the MID task requires “unusual vigilance and anticipatory motor preparation-especially for high-incentive targets. Indeed, we cannot rule out that reduced attentional capacity contributed to blunted anticipatory NAcc activation in adolescents” (35). Additionally, the MID task requires the participant to hold multiple conditions and rules in working memory to perform optimally, which may lead to less interest on the task (41). In the card-guessing game study by Forbes et al. (39, 40), task performance had no effect on participant payment, which may have diminished motivation. These issues may have contributed to the blunted/or null activation in their adolescent samples compared with adults. Findings from this study may also help to explain adolescent sensitivity to prediction error (6). Because prediction error is measured as a deviation from EV, an increased sensitivity to value would produce a greater positive prediction error signal in response to an unexpected reward. Thus, heightened adolescent sensitivity to EV may explain the nonlinear developmental trajectory in reward circuitry as previously reported.
Limitations and Conclusions.
One limitation of the current study is the relatively small sample size. The sample size in the secondary, performance-matched analysis in particular may have been underpowered; this could explain why the power of the striatum ROI is low and the inconsistency in the laterality finding. Another limitation is the lack of a preadolescent participant group (i.e., ages 8–12). Some developmental research has identified patterns that are quadratic rather than linear, with peaks in behavioral response or neural activation during middle adolescence and declining for both younger and older individuals (e.g., ref. 5). Others observe behavioral and neural patterns that increase or decrease continuously with age (e.g., ref. 4). Without including preadolescents it is not possible to say with certainty whether the observed difference is a uniquely adolescent sensitivity to EV or part of an ongoing developmental trajectory.
In summary, this study deepens our understanding of adolescent reward responsiveness by identifying neural differences in sensitivity to EV across development. Further, these data suggest that adolescents are more attentive to the value of available options than adults. Collectively, these behavioral and neural data provide evidence for ontogenetic differences in how computation of value is used to bias reward-related behavior during adolescence.
Materials and Methods
Participants.
Nineteen healthy right-handed adult participants (ages 25–30, mean age 27.9 y, SD = 1.9 y; 11 female) and 22 healthy right-handed adolescent participants (ages 13–17, mean age 15.6 y, SD = 1.4 y; 11 female) were recruited through poster and internet advertisements approved through the University of California, Los Angeles (UCLA), Institutional Review Board and through a database of prior research participants. A separate analysis from these participants has been reported previously (42). Participants visited the laboratory for an intake session and for the neuroimaging session. At the intake session, all participants provided informed consent, and participants under the age of 18 provided assent while their parents or guardians completed the informed consent procedure. All participants reported no prior diagnosis of psychiatric or neurologic illness or developmental delays, had no metal in their bodies, and were not taking psychoactive medication.
At the intake session, each participant was asked to provide the primary source and amount of spending money per month because valuation of monetary rewards might be influenced by available spending money/income. There was a significant effect of age on spending money each month [t (37) = −4.248, P = 0.000; Madolescent = $52.50 (SD = 47.84), Madult = $467.11 (SD = 433.98)]. Money was primarily derived from allowance (29% adolescents; 0% adults), a job (33% adolescents; 79% adults), or unspecified/none (33% adolescents; 21% adults). Finally, participants were acclimated to the MRI environment with a mock scanner. Participants were endowed $20 for completing the intake session and were informed that they would use the $20 as “playing” money during the fMRI task on the subsequent laboratory session. They were also informed that there was an opportunity to win up to $20 more in addition to their playing money (for a total of $40) but that there was a possibility that they would lose the $20 during the gambling fMRI task. Allowing them to feel ownership of the $20 earned during the intake session helped preclude the “house money effect” (increased risk-taking behavior that is observed when the money at stake is not the participant’s own) (43). In actuality, all participants were assigned a payment of between $5 and $10 corresponding to a trial that they accepted, to ensure that no participants were required to return money to the experimenters.
Materials.
Approximately 1 wk after the intake session, participants returned to the laboratory for the fMRI session. During the fMRI scan, participants completed a variation of the gambling task originally reported by Tom et al. (12). To make the task appropriate for youth, we made the following modifications to the original task: First, we eliminated the components that required participants to hold information in working memory by adding a scale showing the response option at the bottom of each trial. Second, we eliminated potential attentional biases by using white text on a black screen rather than green and red text for positive and negative monetary amounts, respectively. Third, we modified the range of potential gain and loss amounts to be equal (e.g., gain amounts ranged from +$5 to +$20, and loss amounts ranged from −$5 to −$20); this differed from the original study, which had range amounts from +$10 to $40 and −$5 to −$20. We made this modification so that participants would not be distracted by unequal variance in gain and loss amounts. Finally, we extensively trained participants before the scan to ensure that they understood all aspects of the task.
In this task, participants were presented with a series of gambles with a 50% probability of gaining the amount shown on one side of a “spinner” and a 50% probability of losing the amount shown on the other side (Fig. 1). The gain and loss amounts were independently manipulated, with gain amounts selected from the range of whole-dollar values between +$5 and +$20 and loss amounts selected from the range of whole-dollar values between −$5 and −$20, for a total of 144 trials. Randomly interspersed within these trials were 24 gain-only trials and 24 loss-only trials, with values drawn from the same range, for a total of 192 trials across four runs. These gain-only and loss-only trials allowed for a broader range of EVs within the task than mixed gambles alone would provide. The EVs of the mixed gambles ranged from −$7.50 to +$7.50, whereas the EVs of the gain-only gambles ranged from +$6 to +$19 and the EVs of the loss-only gambles ranged from −$6 to −$19. The side of the spinner in which the gain and loss appeared and the order of the stimuli were counterbalanced across participants. For each trial, participants decided whether or not they would be willing to play that gamble for real money. Participants were informed that one of the trials that they chose to accept would be selected at the end of the scan and played for real money, with that amount of money added to or subtracted from their overall payment for the study. This procedure was designed to encourage a choice on each trial that was consistent with the participant’s actual feelings about that gamble.
HLM was used to determine whether there was a significant effect of change of EV on acceptance rates and whether this relationship was different by age group using the equations below:
For the initial HLM analysis, three participants were excluded as outliers based on the deviation of their data from the fitted model; 20 adolescent and 17 adult participants were included in the HLM results.
MRI Scanning Procedure.
Scanning was performed on a 3-Tesla Siemens Trio MRI machine in the Ahmanson-Lovelace Brain Mapping Center at UCLA. For the functional runs, 140 T2*-weighted echoplanar images (EPIs) were collected [33 slices; slice thickness, 4 mm; repetition time (TR), 2,000 ms; echo time (TE), 30 ms; flip angle, 90°; matrix, 64 × 64; and field of view, 200]. The first eight volumes of each functional run were automatically discarded. Two structural MRI images were collected as well: a T2-weighted matched-bandwidth high-resolution scan (following the same slice prescription as the EPIs) and a T1-weighted magnetization-prepared rapid- acquisition gradient echo image (MPRAGE; 160 sagittal slices; slice thickness, 1 mm; TR, 2,000 ms; TE, 2,100 ms; matrix, 192 × 192; and field of view, 256).
Data Preprocessing and Analysis.
Data preprocessing and analysis were conducted using Functional MRI of the Brain Software Library (FSL) version 4.1 (www.fmrib.ox.ac.uk/fsl). Images were motion-corrected using MCFLIRT (motion correction using FMRIB’s linear image registration tool; FMRIB, functional magnetic resonance imaging of the brain) and denoised using multivariate exploratory linear optimized decomposition into independent components analysis. Data were smoothed using a 5-mm full-width-half-maximum Gaussian kernel and filtered with a nonlinear high-pass filter (66-s cutoff). A three-step registration process was used to align individual participant data into standard Montreal Neurological Institute (MNI) space. EPI images were first registered to the matched-bandwidth image, then to the MPRAGE image, and finally to MNI space. There were no significant differences between adolescents and adults in translational motion [Madolescent = 0.21 mm (SD = 0.19 mm), Madult = 0.13 mm (SD = 0.10 mm), t (38) = 1.660, P = 0.11] or rotational motion [Madolescent = 0.004 mm (SD = 0.004 mm), Madult = 0.002 mm (SD = 0.001 mm), t (38) = 1.932, P = 0.06]. One adolescent participant was excluded on the basis of exceeding 3 mm of motion during the MRI scan; analyses were completed using the remaining 21 adolescents (mean age 15.5 y, SD = 1.4 y; 11 female) and all 19 adults.
Data analysis was conducted using FMRI expert analysis tool, first at an individual subject level and then using a mixed-effects model at the group analysis level. Z-statistic images were thresholded at a cluster level of z > 2.3 and a corrected significance threshold of P ≤ 0.05. Statistical analyses were performed on each participant’s data using a general linear model to observe neural activation associated with increasing and decreasing EV. Each participant’s data were modeled using a three-column parametric regressor that contained the onset time of each gamble, a standardized RT of 1 s, and the de-meaned EV of each gamble. Six motion parameters were also included as covariates in the model for each run for each of the participants. The regressor of interest was convolved with a canonical hemodynamic response function. A fixed-effects model was used to combine all four task runs for each participant. At the group level, analysis was carried out using FMRIB’s Local Analysis of Mixed Effects stage 1 with automatic outlier detection. A positive parametric main effect was modeled to identify neural regions where activation increased with increasing EV, and a negative parametric main effect was modeled to identify regions where activation decreased with increasing EV. Because adolescent and adult participants did not differ significantly in the EV of the trials that they chose to accept or reject during the mixed gambles task (42), we collapsed across age group for the initial analysis of neural response to EV. To control for possible effects of income/available spending money, we regressed this variable on brain activation. There was a significant negative correlation between income/money and activation in postcentral gyrus (−10, −36, 58, z = 3.86) and no significant positive association. We did not explore this finding further because there were no a priori hypotheses about the relationships between postcentral gyrus and income.
Based upon the findings of the whole-brain group-level analysis and a priori hypotheses, we also conducted age-related contrasts using the same parametrically modeled data in selected ROIs to investigate whether the observed effects were driven more strongly by adolescents or adults. ROIs were created using 6-mm spheres surrounding the peak voxels from the positive (showing increasing activation with increasing EV) whole-brain group-level analysis for MPFC (X = 6, Y = 28, Z = 34) and DLPFC (X = 40, Y = 34, Z = 28). Given our a priori hypotheses about the role of the VS in representing value differentially across development, ROIs were investigated for right VS and left VS using prethreshold masking of the whole-brain age-related contrast, with masks for right and left accumbens defined by the Harvard–Oxford probabilistic atlas of human cortical and subcortical brain areas (44). In addition, ROIs were created from the negative (showing decreasing activation with increasing EV) whole-brain group-level analysis using the same procedure for right amygdala (X = 18, Y = −6, Z = −20), left amygdala (X = −24, Y = −6, Z = −22), right insula (X = 36, Y = −18, Z = 4), and left insula (X = −40, Y = −12, Z = 0). The mean percent signal change was extracted from each ROI, and the values were compared for adolescents and adults using two-tailed t tests. For visualization, statistical maps of all analyses were projected onto an average brain. All fMRI data shown were cluster-corrected for multiple comparisons using Gaussian random field theory at Z = 2.3, P < 0.05 in FSL.
Supplementary Material
Acknowledgments
We thank participating families and helpful comments from members of the A.G. Laboratory and Craig R. Fox. This work was supported in part by startup funds (to A.G.) and by a UCLA Translational Neuroscience of Drug Addiction Predoctoral Fellowship (to E.B.-L.).
Footnotes
The authors declare no conflict of interest.
This article is a PNAS Direct Submission. V.F.R. is a guest editor invited by the Editorial Board.
This article contains supporting information online at www.pnas.org/lookup/suppl/doi:10.1073/pnas.1319762111/-/DCSupplemental.
References
- 1.Galván A. The teenage brain: Sensitivity to rewards. Curr Dir Psychol Sci. 2013;22(2):88–93. doi: 10.1177/0963721413476512. [DOI] [PMC free article] [PubMed] [Google Scholar]
- 2.Geier CF, Terwilliger R, Teslovich T, Velanova K, Luna B. Immaturities in reward processing and its influence on inhibitory control in adolescence. Cereb Cortex. 2010;20(7):1613–1629. doi: 10.1093/cercor/bhp225. [DOI] [PMC free article] [PubMed] [Google Scholar]
- 3.Ernst M, et al. Amygdala and nucleus accumbens in responses to receipt and omission of gains in adults and adolescents. Neuroimage. 2005;25(4):1279–1291. doi: 10.1016/j.neuroimage.2004.12.038. [DOI] [PubMed] [Google Scholar]
- 4.Galván A, et al. Earlier development of the accumbens relative to orbitofrontal cortex might underlie risk-taking behavior in adolescents. J Neurosci. 2006;26(25):6885–6892. doi: 10.1523/JNEUROSCI.1062-06.2006. [DOI] [PMC free article] [PubMed] [Google Scholar]
- 5.Van Leijenhorst L, et al. What motivates the adolescent? Brain regions mediating reward sensitivity across adolescence. Cereb Cortex. 2010;20(1):61–69. doi: 10.1093/cercor/bhp078. [DOI] [PubMed] [Google Scholar]
- 6.Cohen JR, et al. A unique adolescent response to reward prediction errors. Nat Neurosci. 2010;13(6):669–671. doi: 10.1038/nn.2558. [DOI] [PMC free article] [PubMed] [Google Scholar]
- 7.Knutson B, Delgado M, Phillips P. Representation of subjective value in the striatum. In: Glimcher PW, Camerer C, Fehr E, Poldrack R, editors. Decision Making and the Brain. London: Elsevier; 2008. pp. 389–406. [Google Scholar]
- 8.Bartra O, McGuire JT, Kable JW. The valuation system: A coordinate-based meta-analysis of BOLD fMRI experiments examining neural correlates of subjective value. Neuroimage. 2013;76:412–427. doi: 10.1016/j.neuroimage.2013.02.063. [DOI] [PMC free article] [PubMed] [Google Scholar]
- 9.Rangel A, Camerer C, Montague PR. A framework for studying the neurobiology of value-based decision making. Nat Rev Neurosci. 2008;9(7):545–556. doi: 10.1038/nrn2357. [DOI] [PMC free article] [PubMed] [Google Scholar]
- 10.Levy I, Snell J, Nelson AJ, Rustichini A, Glimcher PW. Neural representation of subjective value under risk and ambiguity. J Neurophysiol. 2010;103(2):1036–1047. doi: 10.1152/jn.00853.2009. [DOI] [PubMed] [Google Scholar]
- 11.Peters J, Büchel C. Overlapping and distinct neural systems code for subjective value during intertemporal and risky decision making. J Neurosci. 2009;29(50):15727–15734. doi: 10.1523/JNEUROSCI.3489-09.2009. [DOI] [PMC free article] [PubMed] [Google Scholar]
- 12.Tom SM, Fox CR, Trepel C, Poldrack RA. The neural basis of loss aversion in decision-making under risk. Science. 2007;315(5811):515–518. doi: 10.1126/science.1134239. [DOI] [PubMed] [Google Scholar]
- 13.Hare TA, O’Doherty J, Camerer CF, Schultz W, Rangel A. Dissociating the role of the orbitofrontal cortex and the striatum in the computation of goal values and prediction errors. J Neurosci. 2008;28(22):5623–5630. doi: 10.1523/JNEUROSCI.1309-08.2008. [DOI] [PMC free article] [PubMed] [Google Scholar]
- 14.Kable JW, Glimcher PW. The neurobiology of decision: Consensus and controversy. Neuron. 2009;63(6):733–745. doi: 10.1016/j.neuron.2009.09.003. [DOI] [PMC free article] [PubMed] [Google Scholar]
- 15.Hare TA, Camerer CF, Knoepfle DT, Rangel A, Rangel A. Value computations in ventral medial prefrontal cortex during charitable decision making incorporate input from regions involved in social cognition. J Neurosci. 2010;30(2):583–590. doi: 10.1523/JNEUROSCI.4089-09.2010. [DOI] [PMC free article] [PubMed] [Google Scholar]
- 16.Knutson B, Rick S, Wimmer GE, Prelec D, Loewenstein G. Neural predictors of purchases. Neuron. 2007;53(1):147–156. doi: 10.1016/j.neuron.2006.11.010. [DOI] [PMC free article] [PubMed] [Google Scholar]
- 17.Hare TA, Camerer CF, Rangel A. Self-control in decision-making involves modulation of the vmPFC valuation system. Science. 2009;324(5927):646–648. doi: 10.1126/science.1168450. [DOI] [PubMed] [Google Scholar]
- 18.Litt A, Plassmann H, Shiv B, Rangel A. Dissociating valuation and saliency signals during decision-making. Cereb Cortex. 2011;21(1):95–102. doi: 10.1093/cercor/bhq065. [DOI] [PubMed] [Google Scholar]
- 19.Plassmann H, O’Doherty JP, Rangel A. Appetitive and aversive goal values are encoded in the medial orbitofrontal cortex at the time of decision making. J Neurosci. 2010;30(32):10799–10808. doi: 10.1523/JNEUROSCI.0788-10.2010. [DOI] [PMC free article] [PubMed] [Google Scholar]
- 20.Trepel C, Fox CR, Poldrack RA. Prospect theory on the brain? Toward a cognitive neuroscience of decision under risk. Brain Res Cogn Brain Res. 2005;23(1):34–50. doi: 10.1016/j.cogbrainres.2005.01.016. [DOI] [PubMed] [Google Scholar]
- 21.Yacubian J, et al. Dissociable systems for gain- and loss-related value predictions and errors of prediction in the human brain. J Neurosci. 2006;26(37):9530–9537. doi: 10.1523/JNEUROSCI.2915-06.2006. [DOI] [PMC free article] [PubMed] [Google Scholar]
- 22.Tobler PN, O’Doherty JP, Dolan RJ, Schultz W. Reward value coding distinct from risk attitude-related uncertainty coding in human reward systems. J Neurophysiol. 2007;97(2):1621–1632. doi: 10.1152/jn.00745.2006. [DOI] [PMC free article] [PubMed] [Google Scholar]
- 23.Rolls ET, McCabe C, Redoute J. Expected value, reward outcome, and temporal difference error representations in a probabilistic decision task. Cereb Cortex. 2008;18(3):652–663. doi: 10.1093/cercor/bhm097. [DOI] [PubMed] [Google Scholar]
- 24.Gluth S, Rieskamp J, Büchel C. Neural evidence for adaptive strategy selection in value-based decision-making. Cereb Cortex. 2013 doi: 10.1093/cercor/bht049. in press. [DOI] [PubMed] [Google Scholar]
- 25.Knutson B, Taylor J, Kaufman M, Peterson R, Glover G. Distributed neural representation of expected value. J Neurosci. 2005;25(19):4806–4812. doi: 10.1523/JNEUROSCI.0642-05.2005. [DOI] [PMC free article] [PubMed] [Google Scholar]
- 26.Kim H, Shimojo S, O’Doherty JP. Overlapping responses for the expectation of juice and money rewards in human ventromedial prefrontal cortex. Cereb Cortex. 2011;21(4):769–776. doi: 10.1093/cercor/bhq145. [DOI] [PubMed] [Google Scholar]
- 27.Padmanabhan A, Geier CF, Ordaz SJ, Teslovich T, Luna B. Developmental changes in brain function underlying the influence of reward processing on inhibitory control. Dev Cogn Neurosci. 2011;1(4):517–529. doi: 10.1016/j.dcn.2011.06.004. [DOI] [PMC free article] [PubMed] [Google Scholar]
- 28.Crone EA, Dahl RE. Understanding adolescence as a period of social-affective engagement and goal flexibility. Nat Rev Neurosci. 2012;13(9):636–650. doi: 10.1038/nrn3313. [DOI] [PubMed] [Google Scholar]
- 29.Tymula A, et al. Adolescents’ risk-taking behavior is driven by tolerance to ambiguity. Proc Natl Acad Sci USA. 2012;109(42):17135–17140. doi: 10.1073/pnas.1207144109. [DOI] [PMC free article] [PubMed] [Google Scholar]
- 30.Galván A, McGlennen KM. Enhanced striatal sensitivity to aversive reinforcement in adolescents versus adults. J Cogn Neurosci. 2013;25(2):284–296. doi: 10.1162/jocn_a_00326. [DOI] [PubMed] [Google Scholar]
- 31.Reyna VF, Farley F. Risk and rationality in adolescent decision-making: Implications for theory, practice, and public policy. Psychol Sci Public Interest. 2006;7:1–44. doi: 10.1111/j.1529-1006.2006.00026.x. [DOI] [PubMed] [Google Scholar]
- 32.Galván A. Neural systems underlying reward and approach behaviors in childhood and adolescence. Curr Top Behav Neurosci. 2013 doi: 10.1007/7854_2013_240. [DOI] [PubMed] [Google Scholar]
- 33.Kahneman D, Tversky A. Choices, values and frames. Am Psychol. 1984;39(4):341–350. [Google Scholar]
- 34.Van Leijenhorst L, et al. Adolescent risky decision-making: Neurocognitive development of reward and control regions. Neuroimage. 2010;51(1):345–355. doi: 10.1016/j.neuroimage.2010.02.038. [DOI] [PubMed] [Google Scholar]
- 35.Bjork JM, Smith AR, Chen G, Hommer DW. Adolescents, adults and rewards: Comparing motivational neurocircuitry recruitment using fMRI. PLoS ONE. 2010;5(7):e11440. doi: 10.1371/journal.pone.0011440. [DOI] [PMC free article] [PubMed] [Google Scholar]
- 36.Bjork JM, et al. Incentive-elicited brain activation in adolescents: Similarities and differences from young adults. J Neurosci. 2004;24(8):1793–1802. doi: 10.1523/JNEUROSCI.4862-03.2004. [DOI] [PMC free article] [PubMed] [Google Scholar]
- 37.Knutson B, Adams CM, Fong GW, Hommer D. Anticipation of increasing monetary reward selectively recruits nucleus accumbens. J Neurosci. 2001;21(16):RC159. doi: 10.1523/JNEUROSCI.21-16-j0002.2001. [DOI] [PMC free article] [PubMed] [Google Scholar]
- 38.Delgado MR, Nystrom LE, Fissell C, Noll DC, Fiez JA. Tracking the hemodynamic responses to reward and punishment in the striatum. J Neurophysiol. 2000;84(6):3072–3077. doi: 10.1152/jn.2000.84.6.3072. [DOI] [PubMed] [Google Scholar]
- 39.Forbes EE, et al. Healthy adolescents’ neural response to reward: Associations with puberty, positive affect, and depressive symptoms. J Am Acad Child Adolesc Psychiatry. 2010;49(2):162–172, e1–e5. doi: 10.1097/00004583-201002000-00010. [DOI] [PMC free article] [PubMed] [Google Scholar]
- 40.Forbes EE, et al. Altered striatal activation predicting real-world positive affect in adolescent major depressive disorder. Am J Psychiatry. 2009;166(1):64–73. doi: 10.1176/appi.ajp.2008.07081336. [DOI] [PMC free article] [PubMed] [Google Scholar]
- 41.Galván A. Adolescent development of the reward system. Front Hum Neurosci. 2010;4:6. doi: 10.3389/neuro.09.006.2010. [DOI] [PMC free article] [PubMed] [Google Scholar]
- 42.Barkley-Levenson EE, Van Leijenhorst L, Galván A. Behavioral and neural correlates of loss aversion and risk avoidance in adolescents and adults. Dev Cogn Neurosci. 2013;3:72–83. doi: 10.1016/j.dcn.2012.09.007. [DOI] [PMC free article] [PubMed] [Google Scholar]
- 43.Thaler R, Johnson E. Gambling with house money and trying to break even: The effects of prior outcomes on risky choice. Manage Sci. 1990;36:3–10. [Google Scholar]
- 44.Desikan RS, et al. An automated labeling system for subdividing the human cerebral cortex on MRI scans into gyral based regions of interest. Neuroimage. 2006;31(3):968–980. doi: 10.1016/j.neuroimage.2006.01.021. [DOI] [PubMed] [Google Scholar]
Associated Data
This section collects any data citations, data availability statements, or supplementary materials included in this article.