Abstract
In 2009 Phaeobacter caeruleus was described as a novel species affiliated with the marine Roseobacter clade, which, in turn, belongs to the class Alphaproteobacteria. The genus Phaeobacter is well known for members that produce various secondary metabolites. Here we report of putative quorum sensing systems, based on the finding of six N-acyl-homoserine lactone synthetases, and show that the blue color of P. caeruleus is probably due to the production of the secondary metabolite indigoidine. Therefore, P. caeruleus might have inhibitory effects on other bacteria. In this study the genome of the type strain DSM 24564T was sequenced, annotated and characterized. The 5,344,419 bp long genome with its seven plasmids contains 5,227 protein-coding genes (3,904 with a predicted function) and 108 RNA genes.
Keywords: biofilm, motile, indigoidine, quorum sensing, siderophores, Rhodobacteraceae, Alphaproteobacteria
Introduction
Phaeobacter caeruleus 13T (= DSM 24564 = LMG 24369 = CCUG 55859) was isolated at the ISMAR-CNR Marine Station, Genoa, Italy, during an analysis of the microbial diversity of a marine electroactive biofilm from a tank of about 100 L seawater [1]. The biofilm was grown on a cathodically polarized stainless-steel cathode [2]. In addition to P. caeruleus the genus consists of four other species, P. arcticus, P. daeponensis, P. gallaeciensis and P. inhibens and belongs to the Roseobacter clade, one of the most intensively studied groups of marine bacteria in recent years [3]. The clade belongs to the family Rhodobacteraceae within the class Alphaproteobacteria. P. caeruleus is named after the colony color of the isolates (cae.ru’le.us; L. masc. adj. caeruleus = dark-blue colored) [1]. Since the first publication, no further research on P. caeruleus was published. Therefore, we present for the first time a description and analysis of the high-quality draft genome sequence and annotation, including insights on genes coding for putative secondary metabolites like the blue pigment indigoidine or the quorum sensing mediating N-acyl-homoserine lactones. Furthermore, we summarize features of the organism, including novel aspects of its phenotype.
Classification and features
16S rRNA gene analysis
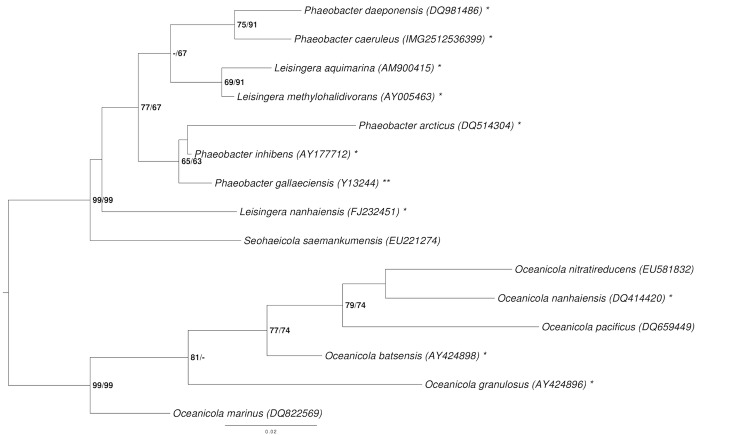
Figure 1 shows the phylogenetic neighborhood of P. caeruleus in a tree based on 16S rRNA gene sequences. The sequences of the four 16S rRNA gene copies in the genome do not differ from each other, and do not differ from the previously published 16S rRNA gene sequence (AM943630), which contains two ambiguous base calls.
Figure 1.
Phylogenetic tree highlighting the position of P. caeruleus relative to the type strains of the other species within the genus Phaeobacter and the neighboring genera Leisingera and Oceanicola [4-17]. The tree was inferred from 1,387 aligned characters [18,19] of the 16S rRNA gene sequence under the maximum likelihood (ML) criterion [20]. Oceanicola spp. were included in the dataset for use as outgroup taxa. The branches are scaled in terms of the expected number of substitutions per site. Numbers adjacent to the branches are support values from 1,000 ML bootstrap replicates [21] (left) and from 1,000 maximum-parsimony bootstrap replicates [22] (right) if larger than 60%. Lineages with type strain genome sequencing projects registered in GOLD [23] are labeled with one asterisk, those also listed as 'Complete and Published' with two asterisks [24]. New genome sequences are reported in this issue [9].
A representative genomic 16S rRNA gene sequence of P. caeruleus 13T was compared using NCBI BLAST [25,26] under default settings (e.g., considering only the high-scoring segment pairs (HSPs) from the best 250 hits) with the most recent release of the Greengenes database [27] and the relative frequencies of taxa and keywords (reduced to their stem [28]) were determined, weighted by BLAST scores [Table 1]. The most frequently occurring genera were Phaeobacter (38.5%), Ruegeria (18.6%), Roseobacter (15.0%), Silicibacter (11.9%) and Leisingera (5.5%) (74 hits in total). Regarding the single hit to sequences from members of the species, the average identity within HSPs was 100.0%, whereas the average coverage by HSPs was 96.9%. Regarding the nine hits to sequences from other members of the genus, the average identity within HSPs was 97.6%, whereas the average coverage by HSPs was 99.5%. Among all other species, the one yielding the highest score was Phaeobacter gallaeciensis (AY881240), which corresponded to an identity of 98.3% and an HSP coverage of 99.3%. (Note that the Greengenes database uses the INSDC (= EMBL/NCBI/DDBJ) annotation, which is not an authoritative source for nomenclature or classification.) The highest-scoring environmental sequence was EF573869 (Greengenes short name 'site S25 near Coco's Island marine clone S25 213'), which showed an identity of 98.8% and an HSP coverage of 99.9%. The most frequently occurring keywords within the labels of all environmental samples which yielded hits were 'coral' (6.8%), 'caribbean' (5.8%), 'faveolata' (5.5%), 'chang' (5.4%) and 'disease-induc, montastraea, plagu, white' (5.2%) (169 hits in total). Environmental samples which yielded hits of a higher score than the highest scoring species were not found, indicating that the species is rarely found in environmental samples.
Table 1. Classification and general features of P. caeruleus DSM 24564T according to the MIGS recommendations [29].
| MIGS ID | Property | Term | Evidence code |
|---|---|---|---|
| Domain Bacteria | TAS [30] | ||
| Phylum Proteobacteria | TAS [31] | ||
| Class Alphaproteobacteria | TAS [32,33] | ||
| Current classification | Order Rhodobacterales | TAS [33,34] | |
| Family Rhodobacteraceae | TAS [34,35] | ||
| Genus Phaeobacter | TAS [14,36] | ||
| Species Phaeobacter caeruleus | TAS [1] | ||
| MIGS-7 | Subspecific genetic lineage (strain) | 13T | TAS [1] |
| MIGS-12 | Reference for biomaterial | Vandecandelaere et al. | TAS [1] |
| Gram stain | Gram-negative | TAS [1] | |
| Cell shape | Rod-shaped | TAS [1] | |
| Motility | Motile | NAS | |
| Sporulation | Not reported | ||
| MIGS-6.1 | Temperature range | 4-45 °C | TAS [1] |
| MIGS-6.1 | Optimum temperature | 20°C | IDA |
| MIGS-6.3 | Salinity | NaCl 2-5% (optimal, 3-4%) | TAS [1] |
| MIGS-22 | Relationship to oxygen | Aerobe | TAS [1] |
| Carbon source | Amino acid (tyrosine), DNA | TAS [1] | |
| Energy metabolism | Not reported | ||
| MIGS-6 | Habitat | Marine | TAS [1] |
| MIGS-6.2 | pH | pH 6.0–9.0 (optimal, pH 6.5-8.0) | TAS [1] |
| MIGS-15 | Biotic relationship | Biofilm | TAS [1] |
| MIGS-14 | Known pathogenicity | Not reported | |
| MIGS-16 | Specific host | Not reported | |
| MIGS-18 | Health status of host | Not reported | |
| Biosafety level | 1 | TAS [37] | |
| MIGS-19 | Trophic level | Not reported | |
| MIGS-23 | Isolation | biofilm on stainless steel electrode | TAS [1] |
| MIGS-4 | Geographic location | Italy, Genoa, harbor | TAS [1] |
| MIGS-5 | Time of sample collection | before 2009 | NAS |
| MIGS-4.1 | Latitude | 44.37 | TAS [1] |
| MIGS-4.2 | Longitude | 8.94 | TAS [1] |
| MIGS-4.3 | Depth | Not reported | |
| MIGS-4.4 | Altitude | Not reported |
Evidence codes - IDA: Inferred from Direct Assay; TAS: Traceable Author Statement (i.e., a direct report exists in the literature); NAS: Non-traceable Author Statement (i.e., not directly observed for the living, isolated sample, but based on a generally accepted property for the species, or anecdotal evidence). Evidence codes are from the Gene Ontology project [38].
Morphology and physiology
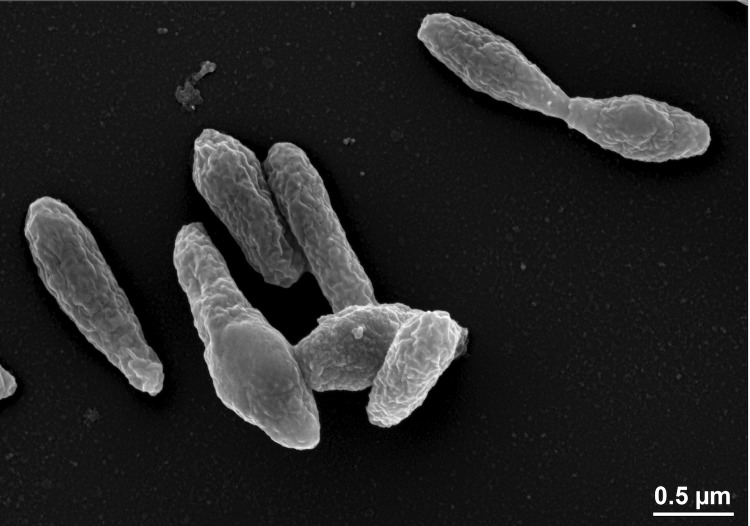
P. caeruleus 13T cells are Gram-negative rods with a cell size of 0.9-1.8 µm (Figure 2). Bundles of polar flagella and inclusion bodies were observed by transmission electron microscopy (not visible in Figure 2). On marine agar the cells grow in round colonies with a surface of dark and bright blue circles, which becomes darker with incubation time [1].
Figure 2.
Scanning electron micrograph of P. caeruleus DSM 24564T
The utilization of carbon compounds by P. caeruleus DSM 24564T grown at 20°C was also determined for this study using Generation-III microplates in an OmniLog phenotyping device (BIOLOG Inc., Hayward, CA, USA). The microplates were inoculated at 28°C with a cell suspension at a cell density of 95-96% turbidity and dye IF-A. Further additives included vitamines, micronutrient and sea-salt solutions. The exported measurement data were further analyzed with the opm package for R [39,69], using its functionality for statistically estimating parameters from the respiration curves such as the maximum height, and automatically translating these values into negative, ambiguous, and positive reactions. The strain was studied in two independent biological replicates, and reactions with a different behavior between the two repetitions were regarded as ambiguous. At 28°C, the strain reacted poorly, with positive reactions only for 1% NaCl, 4% NaCl, lithium chloride, propionic acid and sodium bromate. This might be due to the optimum reported growth temperature of 20°C, whereas the phenotypic measurements were examined at 28°C. The result is in accordance with our observation that after incubation for 24 h in marine broth 2216 medium (MB; BD Biosciences, Franklin Lakes, NJ) and shaken at 100 rpm, P. caeruleus DSM 24564T shows visible growth at 20°C but not at 28°C. Note, however, that [1] reported at least some growth for temperatures up to 45°C.
Chemotaxonomy
Major fatty acids of P. caeruleus 13T are C18:1ω7c, C16:0, an unknown fatty acid with an equivalent chain-length value of 11.7999, C10:0 3-OH, C16:0 2-OH, C12:0 3-OH, 11-methyl C18:1ω7c and C18:0. The remaining fatty acids were present only in minor fractions and less than 1% of the total [1].
Genome sequencing and annotation
Genome project history
This organism was selected for sequencing on the basis of the DOE Joint Genome Institute Community Sequencing Program 2010, CSP 441: “Whole genome type strain sequences of the genera Phaeobacter and Leisingera – a monophyletic group of physiologically highly diverse organisms”. The genome project is deposited in the Genomes On Line Database [40] and the complete genome sequence is deposited in GenBank. Sequencing, finishing and annotation were performed by the DOE Joint Genome Institute (JGI) using state of the art technology [41]. A summary of the project information is shown in Table 2.
Table 2. Genome sequencing project information.
| MIGS ID | Property | Term |
|---|---|---|
| MIGS-31 | Finishing quality | Non-contiguous finished |
| MIGS-28 | Libraries used | Two Illumina paired-end libraries (270 bp and 8 kb insert size) |
| MIGS-29 | Sequencing platforms | Illumina GAii, 454 GS FLX Titanium, PacBio |
| MIGS-31.2 | Sequencing coverage | 287 × Illumina |
| MIGS-30 | Assemblers | Allpaths version 38445, Velvet 1.1.05, phrap version SPS - 4.24 |
| MIGS-32 | Gene calling method | Prodigal 1.4, GenePRIMP |
| INSDC ID | Pending | |
| GenBank Date of Release | Pending | |
| GOLD ID | Gi10861 | |
| NCBI project ID | 77971 | |
| Database: IMG | 2512047087 | |
| MIGS-13 | Source material identifier | DSM 24564 |
| Project relevance | Tree of Life, carbon cycle, sulfur cycle, environmental |
Growth conditions and DNA isolation
A culture of P. caeruleus DSM 24564T was grown in DSMZ medium 514 [42] at 20°C. Genomic DNA was isolated using Jetflex Genomic DNA Purification Kit (GENOMED 600100) following the standard protocol provided by the manufacturer, but modified by the use of additional 10 µl proteinase K and 40 min incubation time. DNA is available through the DNA Bank Network [43].
Genome sequencing and assembly
The draft genome sequence generated using Illumina sequencing technology. For this genome, we constructed and sequenced an Illumina short-insert paired-end library with an average insert size of 270 bp which generated 5,484,184 reads and an Illumina long-insert paired-end library with an average insert size of 7,670 +/- 2,475 bp which generated 4,839,808 reads totaling 1,549 Mb of Illumina data (Feng Chen, unpublished). All general aspects of library construction and sequencing performed can be found at the JGI web site [44]. The initial draft assembly contained 54 contigs in 17 scaffolds. The initial draft data was assembled with Allpaths [45] and the consensus was computationally shredded into 10 kbp overlapping fake reads (shreds). The Illumina draft data was also assembled with Velvet [46], and the consensus sequences were computationally shredded into 1.5 kbp overlapping fake reads (shreds). The Illumina draft data was assembled again with Velvet using the shreds from the first Velvet assembly to guide the next assembly. The consensus from the second Velvet assembly was shredded into 1.5 kbp overlapping fake reads. The fake reads from the Allpaths assembly and both Velvet assemblies and a subset of the Illumina CLIP paired-end reads were assembled using parallel phrap (High Performance Software, LLC) [47]. Possible mis-assemblies were corrected with manual editing in Consed [47]. Gap closure was accomplished using repeat resolution software (Wei Gu, unpublished), and sequencing of bridging PCR fragments with PacBio (Cliff Han, unpublished) technologies. A total of 45 additional sequencing reactions were completed to close gaps and to raise the quality of the final sequence. The final assembly is based on 1,549 Mbp of Illumina draft data, which provides an average 287 × coverage of the genome.
Genome annotation
Genes were identified using Prodigal [48] as part of the JGI genome annotation pipeline [49], followed by a round of manual curation using the JGI GenePrimp pipeline [50]. The predicted CDSs were translated and used to search the National Center for Biotechnology Information (NCBI) nonredundant database, UniProt, TIGR-Fam, Pfam, PRIAM, KEGG, COG, and InterPro databases. Additional gene prediction analysis and functional annotation was performed within the Integrated Microbial Genomes – Expert Review (IMG-ER) platform.
Genome properties
The genome statistics are provided in Table 3 and Figure 3. The assembly of the genome sequence consists of the genome sequence consists of three large scaffolds for the chromosome (3,520,924 bp, 564,457 bp and 447,629 bp in length, respectively) and six plasmids with sizes of 21,535 bp to 270,810 bp and a total G+C content of 63.3%. Of the 5,335 genes predicted, 5,227 were protein-coding genes, and 108 RNAs; 81 pseudo genes were also identified. The majority of the protein-coding genes (73.2%) were assigned a putative function while the remaining ones were annotated as hypothetical proteins. The distribution of genes into COGs functional categories is presented in Table 4.
Table 3. Genome Statistics.
| Attribute | Value | % of Total |
|---|---|---|
| Genome size (bp) | 5,344,419 | 100.00 |
| DNA coding region (bp) | 4,713,144 | 88.19 |
| DNA G+C content (bp) | 3,380,828 | 63.27 |
| Number of replicons | 7 | |
| Extrachromosomal elements | 6 | |
| Total genes | 5,335 | 100.00 |
| RNA genes | 108 | 2.02 |
| rRNA operons | 4 | |
| tRNA genes | 92 | 1.72 |
| Protein-coding genes | 5,227 | 97.98 |
| Pseudo genes | 81 | 1.52 |
| Genes with function prediction | 3,904 | 73.18 |
| Genes in paralog clusters | 1,423 | 26.67 |
| Genes assigned to COGs | 3,844 | 72.05 |
| Genes assigned Pfam domains | 4,091 | 76.68 |
| Genes with signal peptides | 1,786 | 33.48 |
| Genes with transmembrane helices | 1,047 | 19.63 |
| CRISPR repeats | 1 |
Figure 3a.
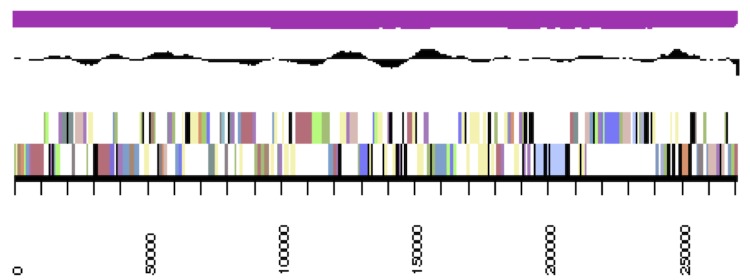
cCaer_A3521, DnaA. Graphical map of one of the scaffolds that constitute the chromosome. From bottom to top: Genes on forward strand (color by COG categories), genes on reverse strand (color by COG categories), RNA genes (tRNAs green, rRNAs red, other RNAs black), GC content, GC skew.
Table 4. Number of genes associated with the general COG functional categories.
| Code | Value | %age | Description |
|---|---|---|---|
| J | 179 | 4.22 | Translation, ribosomal structure and biogenesis |
| A | 0 | 0 | RNA processing and modification |
| K | 346 | 8.16 | Transcription |
| L | 233 | 5.5 | Replication, recombination and repair |
| B | 3 | 0.07 | Chromatin structure and dynamics |
| D | 38 | 0.9 | Cell cycle control, cell division, chromosome partitioning |
| Y | 0 | 0 | Nuclear structure |
| V | 44 | 1.04 | Defense mechanisms |
| T | 224 | 5.29 | Signal transduction mechanisms |
| M | 194 | 4.58 | Cell wall/membrane/envelope biogenesis |
| N | 100 | 2.36 | Cell motility |
| Z | 2 | 0.05 | Cytoskeleton |
| W | 0 | 0 | Extracellular structures |
| U | 91 | 2.15 | Intracellular trafficking, secretion, and vesicular transport |
| O | 153 | 3.61 | Posttranslational modification, protein turnover, chaperones |
| C | 254 | 5.99 | Energy production and conversion |
| G | 175 | 4.13 | Carbohydrate transport and metabolism |
| E | 467 | 11.02 | Amino acid transport and metabolism |
| F | 103 | 2.43 | Nucleotide transport and metabolism |
| H | 194 | 4.58 | Coenzyme transport and metabolism |
| I | 176 | 4.15 | Lipid transport and metabolism |
| P | 192 | 4.53 | Inorganic ion transport and metabolism |
| Q | 143 | 3.37 | Secondary metabolites biosynthesis, transport and catabolism |
| R | 497 | 11.73 | General function prediction only |
| S | 430 | 10.15 | Function unknown |
| - | 1,491 | 27.95 | Not in COGs |
Figure 3b.
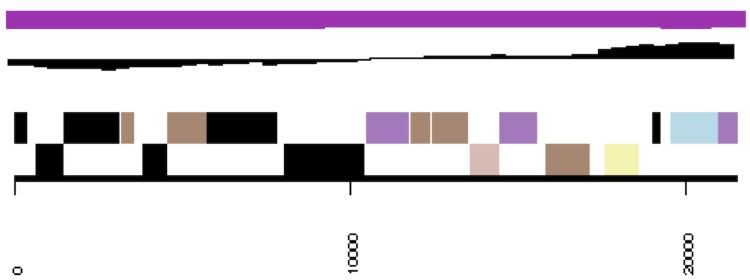
cCaer_B564, RepC-11. Graphical map of one of the scaffolds that constitute the chromosome. From bottom to top: Genes on forward strand (color by COG categories), genes on reverse strand (color by COG categories), RNA genes (tRNAs green, rRNAs red, other RNAs black), GC content, GC skew.
Figure 3c.
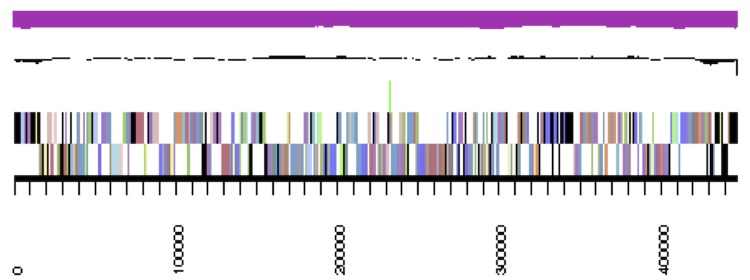
cCaer_C448. Graphical map of one of the scaffolds that constitute the chromosome. From bottom to top: Genes on forward strand (color by COG categories), genes on reverse strand (color by COG categories), RNA genes (tRNAs green, rRNAs red, other RNAs black), GC content, GC skew.
Figure 3d.
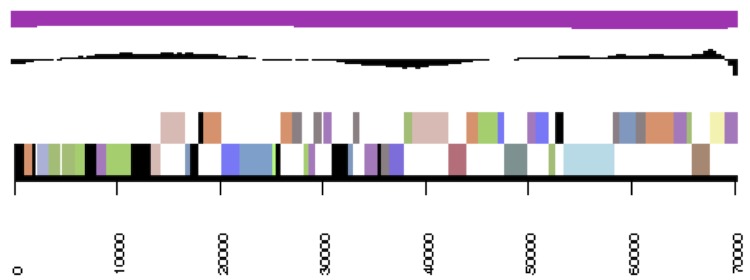
pCaer_A271, RepC-12. Graphical map of the plasmid. From bottom to top: Genes on forward strand (color by COG categories), genes on reverse strand (color by COG categories), RNA genes (tRNAs green, rRNAs red, other RNAs black), GC content, GC skew.
Figure 3e.
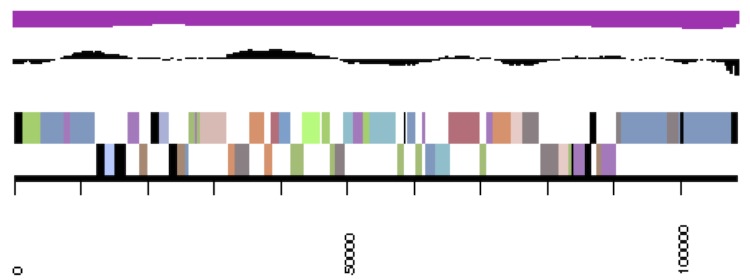
pCaer_B246, RepC-2. Graphical map of the plasmid. From bottom to top: Genes on forward strand (color by COG categories), genes on reverse strand (color by COG categories), RNA genes (tRNAs green, rRNAs red, other RNAs black), GC content, GC skew.
Figure 3f.
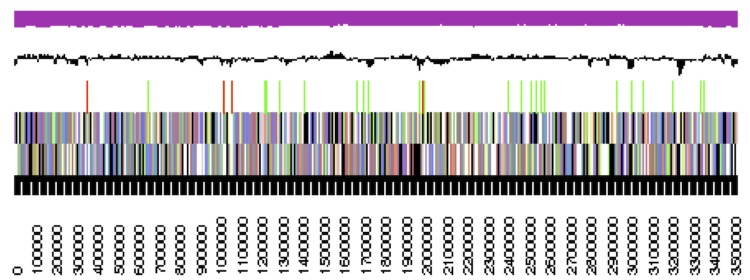
pCaer_C109, DnaA-like I. Graphical map of the plasmid. From bottom to top: Genes on forward strand (color by COG categories), genes on reverse strand (color by COG categories), RNA genes (tRNAs green, rRNAs red, other RNAs black), GC content, GC skew.
Figure 3g.
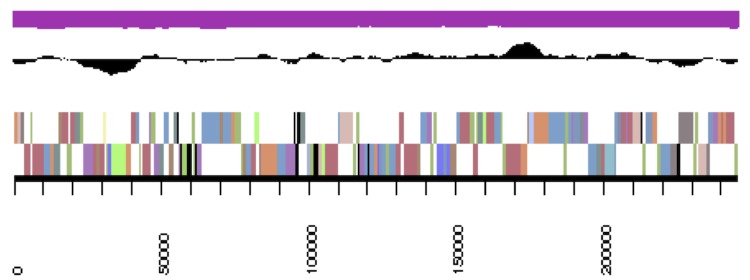
pCaer_D95, RepB-I. Graphical map of the plasmid. From bottom to top: Genes on forward strand (color by COG categories), genes on reverse strand (color by COG categories), RNA genes (tRNAs green, rRNAs red, other RNAs black), GC content, GC skew.
Figure 3h.
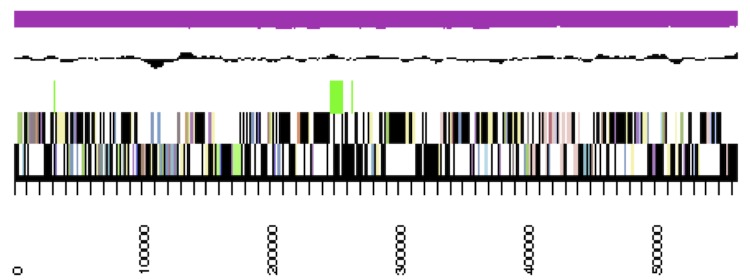
pCaer_E70, RepC-8. Graphical map of the plasmid. From bottom to top: Genes on forward strand (color by COG categories), genes on reverse strand (color by COG categories), RNA genes (tRNAs green, rRNAs red, other RNAs black), GC content, GC skew.
Figure 3i.
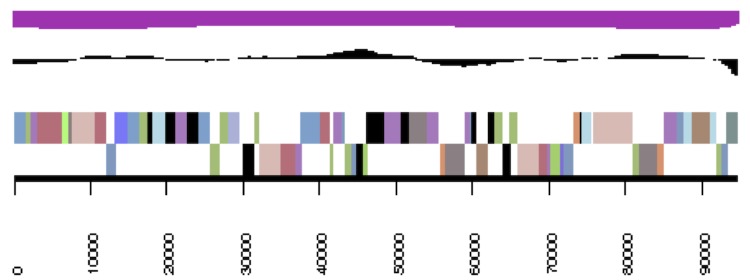
pCaer_F22, RepA-I. Graphical map of the plasmid. From bottom to top: Genes on forward strand (color by COG categories), genes on reverse strand (color by COG categories), RNA genes (tRNAs green, rRNAs red, other RNAs black), GC content, GC skew.
Insights into the genome
Genome sequencing of Phaeobacter caeruleus DSM 24564T resulted in nine scaffolds (contigs) with sizes between 22 kb and 3.5 MB (Table 5). The largest scaffold represents the chromosome as indicated by the presence of the typical replication initiation protein DnaA (Caer_2072) and the same affiliation can be assumed for scaffold 3 based on the absence of plasmid replication genes. The presence of more than 30 tRNA genes and CRISPRs (Clustered Regularly Interspaced Short Palindromic Repeats), which provide acquired resistance against viruses [52], on scaffold 2 is indicative for the chromosome. However, scaffold 2 does also contain a complete RepABC operon with genes for plasmid replication initiation (RepC-11; unpublished replication type) and partitioning (RepAB) as well as a perfect palindrome 5'-TTTACCG\CGGTAAA-3' that probably represents a functional cis-acting anchor for plasmid partitioning [53]. This peculiar distribution may either indicate the integration of a RepABC-11 type plasmid into the chromosome via recombination or an “outsourcing” of essential chromosomal genes to a plasmid that has recently been documented for the photosynthesis genes cluster of the Roseobacter litoralis [54].
Table 5. General genomic features of the chromosome and extrachromosomal replicons from Phaeobacter caeruleus strain DSM 24564T. *circularity not experimentally validated; #deduced from automatic annotation.
| Replicon | Scaffold | Replicase | Length (bp) | GC (%) | Topology | No. Genes# |
|---|---|---|---|---|---|---|
| Chromosome | 1 | DnaA | 3,520 924 | 64 | linear* | 3,453 |
| Chromosome | 2 | RepC-11 | 564,457 | 60 | linear* | 657 |
| Chromosome | 3 | - | 447,629 | 64 | linear* | 468 |
| pCaer_A271 | 4 | RepC-12 | 270,810 | 60 | linear* | 277 |
| pCaer_B246 | 5 | RepC-2 | 245,600 | 65 | linear* | 212 |
| pCaer_C109 | 6 | DnaA-like I | 108,530 | 65 | linear* | 89 |
| pCaer_D95 | 7 | RepB-I | 94,628 | 67 | linear* | 91 |
| pCaer_E70 | 8 | RepC-8 | 70,306 | 67 | linear* | 66 |
| pCaer_F22 | 9 | RepA-I | 21,535 | 66 | linear* | 22 |
The presence of plasmid replication modules on the remaining six fragments with sizes between 22 and 271 kb indicates that they all represent extrachromosomal elements, but their circularity has not been experimentally validated (Table 5). Three of the putative plasmids also contain RepABC-type operons representing the compatibility groups C-2, C-8 and C-12 [53]. The three remaining plasmids pCaer_C109, pCaer_D95 and pCaer_F22 represent DnaA-like I, RepB-I and RepA-I type plasmids, respectively [55,56]. The smallest plasmid pCaer_F22 contains the RepA-I type replicase, but a partitioning module is lacking. This distribution may correspond to a higher plasmid copy number within the cell thus assuring the replicon maintenance in the daughter cells after cell division.
The locus tags of all replicases, plasmid stability modules and the large virB4 and virD4 genes of type IV secretion systems are presented in Table 6. The plasmids pCaer_B246 and pCaer_C109 contain postsegregational killing systems (PSKs) consisting of a typical operon with two small genes encoding a stable toxin and an unstable antitoxin [57]. The largest plasmid pCaer_A271 contains a complete type IV secretion system including the virB operon for the formation of a transmembrane channel. The relaxase VirD2, which is required for the strand-specific DNA nicking at the origin of transfer (oriT), and the coupling protein VirD4 support the presence of functional conjugation system [58,59]. The DnaA-like I replicon pCaer_C109 contains a large type VI secretion system (T6SS) with a size of about 30 kb. The role of this export system that has been first described in the context of bacterial pathogenesis, but recent findings indicate a more general physiological role in defense against eukaryotic cells and other bacteria in the environment [60]. Homologous T6S systems are present on the DnaA-like I plasmids of Leisingera aquimarina DSM 24565T (pAqui_F126) and L. methylohalidivorans DSM 14336T (pMeth_A285) as well as the RepC-8 type plasmid of Phaeobacter daeponensis DSM23529T (pDaep_A276).
Table 6. Integrated Microbial Genome (IMG) locus tags of P. caeruleus DSM 24564T genes for the initiation of replication, toxin/antitoxin modules and two representatives of type IV secretion systems (T4SS) that are required for conjugation. The locus tags are accentuated in blue.
|
Replicon |
Replication Initiation |
Plasmid Stability |
Type IV Secretion |
|||
|---|---|---|---|---|---|---|
| Replicase | Locus Tag | Toxin | Antitoxin | VirB4 | VirD4 | |
| Chromosome | DnaA | Caer_2072 | - | - | - | - |
| Chromosome | RepC-11 | Caer _5060 | - | - | - | - |
| Chromosome | - | - | - | - | - | - |
| pCaer_A271 | RepC-12 | Caer _0252 | - | - | Caer _0206 | Caer _0215 |
| pCaer_B246 | RepC-8 | Caer _4471 | Caer _4419 | Caer _4420 | - | - |
| pCaer_C109 | DnaA-like I | Caer _0297 | Caer _0862 | Caer _0863 | - | - |
| pCaer_D95 | RepB-I | Caer _5279 | ||||
| pCaer_E70 | RepC-2 | Caer _0776 | ||||
| pCaer_F22 | RepA-I | Caer _0297 | ||||
Several strains affiliated with the Roseobacter clade show a high potential to produce secondary metabolites [51]. Pigmentation of cells is often related with secondary metabolite production [61]. We assume that the characteristic blue color of P. caeruleus is attributed to the production of the blue pigment indigoidine. In the closely related and blue-colored Phaeobacter sp. strain Y4I indigoidine is produced via a non-ribosomal peptide synthase (NRPS)-based biosynthetic pathway encoded by the gene cluster igiBCDFE [62]. In strain Y4I indigoidine production is correlated with pleiotrophic effects, such as motility, resistance to hydrogen peroxide, surface colonization and inhibition of Vibrio fischeri. A cluster analysis revealed that the P. caeruleus plasmid pCaer_B246 contains a homologous igiBCDFE gene cluster (Caer_4407 - Caer_4412). Thus it seems likely that P. caeruleus can also produce the antimicrobial secondary metabolite indigoidine via its NRPS cluster. Therefore, indigoidine could be the pigment responsible for the blue color and P. caeruleus could have inhibitory effects on other bacteria.
Mutants in either of the two LuxIR systems in Phaeobacter sp. strain Y4I are lacking the indigoidine production, therefore, quorum sensing seems to play a role in its biosynthesis [62]. A correlation between quorum sensing and pigmentation and antimicrobial effects is already known for members of the Roseobacter clade. The LuxIR-type quorum sensing system of P. inhibens DSM 17395 (originally deposited as P. gallaeciensis DSM 17395; Buddruhs et al., unpublished) regulates N-acyl homoserine lactones production which co-occurs with the strains dark pigmentation and antibiotic activity [63]. The P. caeruleus DSM 24564T chromosome cCaer_A3521 has a luxIR gene cluster (Caer_1365 - Caer_1371) which shows strong homology to the mentioned LuxIR-type cluster of P. inhibens DSM 17395 and strain Y4I, thus pigmentation and putative inhibitory effects could be regulated via quorum sensing. Besides these luxIR genes, five other luxIR clusters are encoded in the genome of strain DSM 24564T which could play an important role in cell-cell signaling.
Recently siderophore production was shown for P. inhibens DSM 17395 [64]. Distinct siderophore transport systems such as an ABC-type enterobactin transport system, two ABC-type cobalamin/Fe3+-siderophores transport systems, two ABC-type Fe3+-siderophore transport systems, two ABC-type Fe3+-hydroxamate transport systems, a TonB-dependent siderophore receptor and a siderophore-interacting protein are encoded in the genome of P. caeruleus (Caer_4537, Caer_1186, Caer_4536, Caer_1187, Caer_4538, Caer_1188, Caer_4539, Caer_4530, Caer_4535). But only one gene, encoding a phosphopantetheinyl transferase component of a siderophore synthetase, is associated with siderophore biosynthesis (Caer_3105). As it was isolated from a biofilm and a siderophore-transport associated genes were present, we presume that P. caeruleus DSM 24564T is utilizing siderophores, which are produced by other ambient bacteria [65].
The phylogenetic tree of the 16S rRNA gene analysis (Figure 1) with intermingled Phaeobacter and Leisingera species indicates that the classification of P. caeruleus DSM 24564T might need to be reconsidered. Hence, we conducted a preliminary phylogenomic analysis using GGDC [66-68] and the draft genomes of the type strains of the other Leisingera and Phaeobacter species. The results shown in Table 7 indicate that the DNA-DNA hybridization (DDH) similarities calculated in silico for P. caeruleus DSM 24564T compared to other Phaeobacter species are, in general, not higher than those to Leisingera species. Although, the highest value by far was obtained for P. daeponensis, it was immediately followed by L. aquimarina and L. methylohalidivorans, which is in accordance with Figure 1.
Table 7. DDH similarities between P. caeruleus DSM 24564T and the other Phaeobacter and Leisingera species (with genome-sequenced type strains) calculated in silico with the GGDC server version 2.0 [66]*.
| Reference species | formula 1 | formula 2 | formula 3 |
|---|---|---|---|
| L. aquimarina (2516653083) | 45.90±3.41 | 28.40±2.44 | 40.60±3.01 |
| L. methylohalidivorans (2512564009) | 45.80±3.41 | 27.00±2.42 | 39.90±3.0 |
| L. nanhaiensis (2512047090) | 14.50±3.11 | 19.40±2.29 | 14.60±2.65 |
| P. arcticus (2516653081)(2512047087) | 16.90±3.26 | 20.40±2.32 | 16.70±2.76 |
| P. daeponensis (2516493020) | 62.50±3.67 | 40.30±2.51 | 57.80±3.18 |
| P. gallaeciensis (AOQA01000000) | 17.90±3.31 | 21.40±2.34 | 17.70±2.80 |
| P. inhibens (2516653078) | 18.20±3.32 | 21.50±2.34 | 17.90±2.81 |
*The standard deviations indicate the inherent uncertainty in estimating DDH values from intergenomic distances based on models derived from empirical test data sets (which are always limited in size); see [66] for details. The distance formulas are explained in [67]. The numbers in parentheses are IMG object IDs (GenBank accession number in the case of P. gallaeciensis) identifying the underlying genome sequences.
Acknowledgements
The authors would like to gratefully acknowledge the assistance of Iliana Schröder for growing P. caeruleus cultures and Evelyne-Marie Brambilla for DNA extraction and quality control (both at the DSMZ). The work conducted by the U.S. Department of Energy Joint Genome Institute was supported by the Office of Science of the U.S. Department of Energy under contract No. DE-AC02-05CH11231; the work conducted by the members of the Roseobacter consortium was supported by the German Research Foundation (DFG) Transregio-SFB 51. We also thank the European Commission which supported phenotyping via the Microme project 222886 within the Framework 7 program.
References
- 1.Vandecandelaere I, Segaert E, Mollica A, Faimali M, Vandamme P. Phaeobacter caeruleus sp. nov., a blue-coloured, colony-forming bacterium isolated from a marine electroactive biofilm. Int J Syst Evol Microbiol 2009; 59:1209-1214 10.1099/ijs.0.002642-0 [DOI] [PubMed] [Google Scholar]
- 2.Vandecandelaere I, Nercessian O, Segaert E, Achouak W, Mollica A, Faimali M, De Vos P, Vandamme P. Alteromonas genovensis sp nov., isolated from a marine electroactive biofilm and emended description of Alteromonas macleodii Baumann et al. 1972 (Approved Lists 1980). Int J Syst Evol Microbiol 2008; 58:2589-2596 10.1099/ijs.0.65691-0 [DOI] [PubMed] [Google Scholar]
- 3.T, Giebel HA, Simon M. Diversity, ecology, and genomics of the Roseobacter clade: a short overview. Arch Microbiol 2008; 189:531-539 10.1007/s00203-008-0353-y [DOI] [PubMed] [Google Scholar]
- 4.Brinkhoff T, Bach G, Heidorn T, Liang LF, Schlingloff A, Simon M. Antibiotic production by a Roseobacter clade-affiliated species from the German Wadden Sea and its antagonistic effects on indigenous isolates. Appl Environ Microbiol 2004; 70:2560-2565 10.1128/AEM.70.4.2560-2565.2003 [DOI] [PMC free article] [PubMed] [Google Scholar]
- 5.Gu J, Guo B, Wang YN, Yu SL, Inamori R, Qu R, Ye YG, Wu XL. Oceanicola nanhaiensis sp. nov., isolated from sediments of the South China Sea. Int J Syst Evol Microbiol 2007; 57:157-160 10.1099/ijs.0.64532-0 [DOI] [PubMed] [Google Scholar]
- 6.Lin KY, Sheu SY, Chang PS, Cho JC, Chen WM. Oceanicola marinus sp. nov., a marine alphaproteobacterium isolated from seawater collected off Taiwan. Int J Syst Evol Microbiol 2007; 57:1625-1629 10.1099/ijs.0.65020-0 [DOI] [PubMed] [Google Scholar]
- 7.Ruiz-Ponte C, Cilia V, Lambert C, Nicolas JL. Roseobacter gallaeciensis sp. nov., a new marine bacterium isolated from rearings and collectors of the scallop Pecten maximus. Int J Syst Bacteriol 1998; 48:537-542 10.1099/00207713-48-2-537 [DOI] [PubMed] [Google Scholar]
- 8.Schaefer JK. Leisingera methylohalidivorans gen. nov., sp. nov., a marine methylotroph that grows on methyl bromide. Int J Syst Evol Microbiol 2002; 52:851-859 10.1099/ijs.0.01960-0 [DOI] [PubMed] [Google Scholar]
- 9.Riedel T, Teshima H, Petersen J, Fiebig A, Davenport K, Dalingault H, Erkkila T, Gu W, Munk C, Xu Y, et al. Genome sequence of the Leisingera aquimarina type strain (DSM 24565T), a member of the Roseobacter clade rich in extrachromosomal elements. Stand Genomic Sci 2013; 8:389-402 10.4056/sigs.3858183 [DOI] [PMC free article] [PubMed] [Google Scholar]
- 10.Thrash JC, Cho JC, Vergin KL, Giovannoni SJ. Genome sequences of Oceanicola granulosus HTCC2516T and Oceanicola batsensis HTCC2597T. J Bacteriol 2010; 192:3549-3550 10.1128/JB.00412-10 [DOI] [PMC free article] [PubMed] [Google Scholar]
- 11.Vandecandelaere I, Segaert E, Mollica A, Faimali M, Vandamme P. Leisingera aquimarina sp. nov., isolated from a marine electroactive biofilm, and emended descriptions of Leisingera methylohalidivorans Schaefer et al 2002, Phaeobacter daeponensis Yoon et al 2007 and Phaeobacter inhibens Martens et al. 2006. Int J Syst Evol Microbiol 2008; 58:2788-2793 10.1099/ijs.0.65844-0 [DOI] [PubMed] [Google Scholar]
- 12.Vandecandelaere I, Segaert E, Mollica A, Faimali M, Vandamme P. Phaeobacter caeruleus sp. nov., a blue-coloured, colony-forming bacterium isolated from a marine electroactive biofilm. Int J Syst Evol Microbiol 2009; 59:1209-1214 10.1099/ijs.0.002642-0 [DOI] [PubMed] [Google Scholar]
- 13.Yoon JH, Kang SJ, Lee SY, Oh KH, Oh TK. Seohaeicola saemankumensis gen. nov., sp. nov., isolated from a tidal flat. Int J Syst Evol Microbiol 2009; 59:2675-2679 10.1099/ijs.0.011312-0 [DOI] [PubMed] [Google Scholar]
- 14.Yoon JH, Kang SJ, Lee SY, Oh TK. Phaeobacter daeponensis sp. nov., isolated from a tidal flat of the Yellow Sea in Korea. Int J Syst Evol Microbiol 2007; 57:856-861 10.1099/ijs.0.64779-0 [DOI] [PubMed] [Google Scholar]
- 15.Yuan J, Lai Q, Wang B, Sun F, Liu X, Du Y, Li G, Gu L, Zheng T, Shao Z. Oceanicola pacificus sp. nov., isolated from a deep-sea pyrene-degrading consortium. Int J Syst Evol Microbiol 2009; 59:1158-1161 10.1099/ijs.0.003400-0 [DOI] [PubMed] [Google Scholar]
- 16.Zhang DC, Li HR, Xin YH, Liu HC, Chi ZM, Zhou PJ, Yu Y. Phaeobacter arcticus sp. nov., a psychrophilic bacterium isolated from the Arctic. Int J Syst Evol Microbiol 2008; 58:1384-1387 10.1099/ijs.0.65708-0 [DOI] [PubMed] [Google Scholar]
- 17.Zheng Q, Chen C, Wang YN, Jiao N. Oceanicola nitratireducens sp. nov., a marine alphaproteobacterium isolated from the South China Sea. Int J Syst Evol Microbiol 2010; 60:1655-1659 10.1099/ijs.0.016311-0 [DOI] [PubMed] [Google Scholar]
- 18.Lee C, Grasso C, Sharlow MF. Multiple sequence alignment using partial order graphs. Bioinformatics 2002; 18:452-464 10.1093/bioinformatics/18.3.452 [DOI] [PubMed] [Google Scholar]
- 19.Castresana J. Selection of conserved blocks from multiple alignments for their use in phylogenetic analysis. Mol Biol Evol 2000; 17:540-552 10.1093/oxfordjournals.molbev.a026334 [DOI] [PubMed] [Google Scholar]
- 20.Stamatakis A, Hoover P, Rougemont J. A rapid bootstrap algorithm for the RAxML web-servers. Syst Biol 2008; 57:758-771 10.1080/10635150802429642 [DOI] [PubMed] [Google Scholar]
- 21.Pattengale ND, Alipour M, Bininda-Emonds ORP, Moret BME, Stamatakis A. How Many Bootstrap Replicates Are Necessary? Lect Notes Comput Sci 2009; 5541:184-200 10.1007/978-3-642-02008-7_13 [DOI] [PubMed] [Google Scholar]
- 22.Swofford DL. PAUP*: Phylogenetic Analysis Using Parsimony (*and Other Methods), Version 4.0 b10. Sinauer Associates, Sunderland, 2002. [Google Scholar]
- 23.Pagani I, Liolios K, Jansson J, Chen IM, Smirnova T, Nosrat B, Markowitz VM, Kyrpides NC. The Genomes OnLine Database (GOLD) v.4: status of genomic and metagenomic projects and their associated metadata. Nucleic Acids Res 2012; 40:D571-D579 10.1093/nar/gkr1100 [DOI] [PMC free article] [PubMed] [Google Scholar]
- 24.Thrash JC, Cho JC, Vergin KL, Giovannoni SJ. Genome sequences of Oceanicola granulosus HTCC2516T and Oceanicola batsensis HTCC2597T. J Bacteriol 2010; 192:3549-3550 10.1128/JB.00412-10 [DOI] [PMC free article] [PubMed] [Google Scholar]
- 25.Altschul SF, Gish W, Miller W, Myers EW, Lipman DJ. Basic local alignment search tool. J Mol Biol 1990; 215:403-410 [DOI] [PubMed] [Google Scholar]
- 26.Korf I, Yandell M, Bedell J. BLAST, O'Reilly, Sebastopol, 2003. [Google Scholar]
- 27.DeSantis TZ, Hugenholtz P, Larsen N, Rojas M, Brodie EL, Keller K, Huber T, Dalevi D, Hu P, Andersen GL. Greengenes, a Chimera-Checked 16S rRNA Gene Database and Workbench Compatible with ARB. Appl Environ Microbiol 2006; 72:5069-5072 10.1128/AEM.03006-05 [DOI] [PMC free article] [PubMed] [Google Scholar]
- 28.Porter MF. An algorithm for suffix stripping. Program: electronic library and information systems 1980; 14:130-137.
- 29.Field D, Garrity G, Gray T, Morrison N, Selengut J, Sterk P, Tatusova T, Thomson N, Allen MJ, Angiuoli SV, et al. The minimum information about a genome sequence (MIGS) specification. Nat Biotechnol 2008; 26:541-547 10.1038/nbt1360 [DOI] [PMC free article] [PubMed] [Google Scholar]
- 30.Woese CR, Kandler O, Wheelis ML. Towards a natural system of organisms: proposal for the domains Archaea, Bacteria, and Eucarya. Proc Natl Acad Sci USA 1990; 87:4576-4579 10.1073/pnas.87.12.4576 [DOI] [PMC free article] [PubMed] [Google Scholar]
- 31.Garrity GM, Bell JA, Lilburn T. Phylum XIV. Proteobacteria phyl. nov. In: DJ Brenner, NR Krieg, JT Staley, GM Garrity (eds), Bergey's Manual of Systematic Bacteriology, second edition, vol. 2 (The Proteobacteria), part B (The Gammaproteobacteria), Springer, New York, 2005, p. 1. [Google Scholar]
- 32.Garrity GM, Bell JA, Lilburn T. Class I. Alphaproteobacteria class. nov. In: Garrity GM, Brenner DJ, Krieg NR, Staley JT (eds), Bergey's Manual of Systematic Bacteriology, Second Edition, Volume 2, Part C, Springer, New York, 2005, p. 1. [Google Scholar]
- 33.Validation List No 107. List of new names and new combinations previously effectively, but not validly, published. Int J Syst Evol Microbiol 2006; 56:1-6 10.1099/ijs.0.64188-0 [DOI] [PubMed] [Google Scholar]
- 34.Garrity GM, Bell JA, Lilburn T. Order III. Rhodobacterales ord. nov. In: Garrity GM, Brenner DJ, Krieg NR, Staley JT (eds), Bergey's Manual of Systematic Bacteriology, Second Edition, Volume 2, Part C, Springer, New York, 2005, p. 161. [Google Scholar]
- 35.Garrity GM, Bell JA, Lilburn T. Family I. Rhodobacteraceae fam. nov. In: Garrity GM, Brenner DJ, Krieg NR, Staley JT (eds), Bergey's Manual of Systematic Bacteriology, Second Edition, Volume 2, Part C, Springer, New York, 2005, p. 161. [Google Scholar]
- 36.Martens T, Heidorn T, Pukall R, Simon M, Tindall BJ, Brinkhoff T. Reclassification of Roseobacter gallaeciensis Ruiz-Ponte et al. 1998 as Phaeobacter gallaeciensis gen. nov., comb. nov., description of Phaeobacter inhibens sp. nov., reclassification of Ruegeria algicola (Lafay et al. 1995) Uchino et al. 1999 as Marinovum algicola gen. nov., comb. nov., and emended descriptions of the genera Roseobacter, Ruegeria and Leisingera. Int J Syst Evol Microbiol 2006; 56:1293-1304 10.1099/ijs.0.63724-0 [DOI] [PubMed] [Google Scholar]
- 37.BAuA Classification of Bacteria and Archaea in risk groups. TRBA 2010; 466:93 [Google Scholar]
- 38.Ashburner M, Ball CA, Blake JA, Botstein D, Butler H, Cherry JM, Davis AP, Dolinski K, Dwight SS, Eppig JT, et al. Gene ontology: tool for the unification of biology. The Gene Ontology Consortium. Nat Genet 2000; 25:25-29 10.1038/75556 [DOI] [PMC free article] [PubMed] [Google Scholar]
- 39.Vaas LAI, Sikorski J, Michael V, Göker M, Klenk HP. Visualization and curve-parameter estimation strategies for efficient exploration of phenotype microarray kinetics. PLoS ONE 2012; 7:e34846 10.1371/journal.pone.0034846 [DOI] [PMC free article] [PubMed] [Google Scholar]
- 40.Pagani I, Liolios K, Jansson J, Chen IM, Smirnova T, Nosrat B, Markowitz VM, Kyrpides NC. The Genomes OnLine Database (GOLD) v.4: status of genomic and metagenomic projects and their associated metadata. Nucleic Acids Res 2012; 40:D571-D579 10.1093/nar/gkr1100 [DOI] [PMC free article] [PubMed] [Google Scholar]
- 41.Mavromatis K, Land ML, Brettin TS, Quest DJ, Copeland A, Clum A, Goodwin L, Woyke T, Lapidus A, Klenk HP, et al. The fast changing landscape of sequencing technolofies and their impact on microbial genome assemblies and annotation. PLoS ONE 2013; 7:e48837 10.1371/journal.pone.0048837 [DOI] [PMC free article] [PubMed] [Google Scholar]
- 42.List of growth media used at the DSMZ: http://www.dmsz.de/catalogues/cataloque-microorganisms/culture-technology/list-of-media-for-microorganisms.html
- 43.Gemeinholzer B, Dröge G, Zetzsche H, Haszprunar G, Klenk HP, Güntsch A, Berendsohn WG, Wägele JW. The DNA Bank Network: the start from a German initiative. Biopreserv Biobank 2011; 9:51-55 10.1089/bio.2010.0029 [DOI] [PubMed] [Google Scholar]
- 44.The DOE Joint Genome Institute www.jgi.doe.gov
- 45.Butler J, MacCallum I, Kleber M, Shlyakhter IA, Belmonte MK, Lander ES, Nusbaum C, Jaffe DB. ALLPATHS: de novo assembly of whole-genome shotgun microreads. Genome Res 2008; 18:810-820 10.1101/gr.7337908 [DOI] [PMC free article] [PubMed] [Google Scholar]
- 46.Zerbino DR, Birney E. Velvet: algorithms for de novo short read assembly using de Bruijn graphs. Genome Res 2008; 18:821-829 10.1101/gr.074492.107 [DOI] [PMC free article] [PubMed] [Google Scholar]
- 47.Phrap and Phred for Windows. MacOS, Linux, and Unix. http://www.phrap.com
- 48.Hyatt D, Chen GL, LoCascio PF, Land ML, Larimer FW, Hauser LJ. Prodigal: prokaryotic gene recognition and translation initiation site identification. BMC Bioinformatics 2010; 11:119 10.1186/1471-2105-11-119 [DOI] [PMC free article] [PubMed] [Google Scholar]
- 49.Mavromatis K, Ivanova NN, Chen IM, Szeto E, Markowitz VM, Kyrpides NC. The DOE-JGI Standard operating procedure for the annotations of microbial genomes. Stand Genomic Sci 2009; 1:63-67 10.4056/sigs.632 [DOI] [PMC free article] [PubMed] [Google Scholar]
- 50.Pati A, Ivanova NN, Mikhailova N, Ovchinnikova G, Hooper SD, Lykidis A, Kyrpides NC. GenePRIMP: a gene prediction improvement pipeline for prokaryotic genomes. Nat Methods 2010; 7:455-457 10.1038/nmeth.1457 [DOI] [PubMed] [Google Scholar]
- 51.Martens T, Gram L, Grossart HP, Kessler D, Muller R, Simon M, Wenzel SC, Brinkhoff T. Bacteria of the Roseobacter clade show potential for secondary metabolite production. Microb Ecol 2007; 54:31-42 10.1007/s00248-006-9165-2 [DOI] [PubMed] [Google Scholar]
- 52.Barrangou R, Fremaux C, Deveau H, Richards M, Boyaval P, Moineau S, Romero DA, Horvath P. CRISPR provides acquired resistance against viruses in prokaryotes. Science 2007; 315:1709-1712 10.1126/science.1138140 [DOI] [PubMed] [Google Scholar]
- 53.Petersen J, Brinkmann H, Pradella S. Diversity and evolution of repABC type plasmids in Rhodobacterales. Environ Microbiol 2009; 11:2627-2638 10.1111/j.1462-2920.2009.01987.x [DOI] [PubMed] [Google Scholar]
- 54.Petersen J, Brinkmann H, Bunk B, Michael V, Päuker O, Pradella S. Think pink: photosynthesis, plasmids and the Roseobacter clade. Environ Microbiol 2012; 14:2661-2672 10.1111/j.1462-2920.2012.02806.x [DOI] [PubMed] [Google Scholar]
- 55.Petersen J, Brinkmann H, Berger M, Brinkhoff T, Päuker O, Pradella S. Origin and evolution of a novel DnaA-like plasmid replication type in Rhodobacterales. Mol Biol Evol 2011; 28:1229-1240 10.1093/molbev/msq310 [DOI] [PubMed] [Google Scholar]
- 56.Petersen J. Phylogeny and compatibility: plasmid classification in the genomics era. Arch Microbiol 2011; 193:313-321 [DOI] [PubMed] [Google Scholar]
- 57.Zielenkiewicz U, Ceglowski P. Mechanisms of plasmid stable maintenance with special focus on plasmid addiction systems. Acta Biochim Pol 2001; 48:1003-1023 [PubMed] [Google Scholar]
- 58.Cascales E, Christie PJ. The versatile bacterial type IV secretion systems. Nat Rev Microbiol 2003; 1:137-149 10.1038/nrmicro753 [DOI] [PMC free article] [PubMed] [Google Scholar]
- 59.Petersen J, Frank O, Göker M, Pradella S. Extrachromosomal, extraordinary and essential-the plasmids of the Roseobacter clade. Appl Microbiol Biotechnol 2013; 97:2805-2815 10.1007/s00253-013-4746-8 [DOI] [PubMed] [Google Scholar]
- 60.Schwarz S, Hood RD, Mougous JD. What is type VI secretion doing in all those bugs? Trends Microbiol 2010; 18:531-537 10.1016/j.tim.2010.09.001 [DOI] [PMC free article] [PubMed] [Google Scholar]
- 61.Soliev AB, Hosokawa K, Enomoto K. Bioactive Pigments from Marine Bacteria: Applications and Physiological Roles. J Altern Complem Med 2011. [DOI] [PMC free article] [PubMed] [Google Scholar]
- 62.Cude WN, Mooney J, Tavanaei AA, Hadden MK, Frank AM, Gulvik CA, May AL, Buchan A. Production of the Antimicrobial Secondary Metabolite Indigoidine Contributes to Competitive Surface Colonization by the Marine Roseobacter Phaeobacter sp Strain Y4I. Appl Environ Microbiol 2012; 78:4771-4780 10.1128/AEM.00297-12 [DOI] [PMC free article] [PubMed] [Google Scholar]
- 63.Berger M, Neumann A, Schulz S, Simon M, Brinkhoff T. Tropodithietic acid production in Phaeobacter gallaeciensis is regulated by N-Acyl homoserine lactone-mediated quorum sensing. J Bacteriol 2011; 193:6576-6585 10.1128/JB.05818-11 [DOI] [PMC free article] [PubMed] [Google Scholar]
- 64.Thole S, Kalhoefer D, Voget S, Berger M, Engelhardt T, Liesegang H, Wollherr A, Kjelleberg S, Daniel R, Simon M, et al. Phaeobacter gallaeciensis genomes from globally opposite locations reveal high similarity of adaptation to surface life. ISME J 2012; 6:2229-2244 10.1038/ismej.2012.62 [DOI] [PMC free article] [PubMed] [Google Scholar]
- 65.D'Onofrio A, Crawford JM, Stewart EJ, Witt K, Gavrish E, Epstein S, Clardy J, Lewis K. Siderophores from Neighboring Organisms Promote the Growth of Uncultured Bacteria. Chem Biol 2010; 17:254-264 10.1016/j.chembiol.2010.02.010 [DOI] [PMC free article] [PubMed] [Google Scholar]
- 66.Meier-Kolthoff JP, Auch AF, Klenk HP, Göker M. Genome sequence-based species delimitation with confidence intervals and improved distance functions. BMC Bioinformatics 2013; 14:60 10.1186/1471-2105-14-60 [DOI] [PMC free article] [PubMed] [Google Scholar]
- 67.Auch AF, Klenk HP, Göker M. Standard operating procedure for calculating genome-to-genome distances based on high-scoring segment pairs. Stand Genomic Sci 2010; 2:142-148 10.4056/sigs.541628 [DOI] [PMC free article] [PubMed] [Google Scholar]
- 68.Auch AF, Von Jan M, Klenk HP, Göker M. Digital DNA-DNA hybridization for microbial species delineation by means of genome-to-genome sequence comparison. Stand Genomic Sci 2010; 2:117-134 10.4056/sigs.531120 [DOI] [PMC free article] [PubMed] [Google Scholar]
- 69.Vaas LAI, Sikorski J, Hofer B, Fiebig A, Buddruhs N, Klenk HP, Göker M. opm: An R package for analyzing OmniLog Phenotype Microarray data. Bioinformatics 2013; 29:1823-1824 10.1093/bioinformatics/btt291 [DOI] [PubMed] [Google Scholar]


