

Abstract
Glial cell line-derived neurotrophic factor (GDNF) binds to the GDNF family co-receptor α1 (GFRα1) and activates RET receptor tyrosine kinase. GFRα1 has a putative domain structure of three homologous cysteine-rich domains, where domains 2 and 3 make up a central domain responsible for GDNF binding. We report here the 1.8 Å crystal structure of GFRα1 domain 3 showing a new protein fold. It is an all-α five-helix bundle with five disulfide bridges. The structure was used to model the homologous domain 2, the other half of the GDNF-binding fragment, and to construct the first structural model of the GDNF–GFRα1 interaction. Using site-directed mutagenesis, we identified closely spaced residues, Phe213, Arg224, Arg225 and Ile229, comprising a putative GDNF-binding surface. Mutating each one of them had slightly different effects on GDNF binding and RET phosphorylation. In addition, the R217E mutant bound GDNF equally well in the presence and absence of RET. Arg217 may thus be involved in the allosteric properties of GFRα1 or in binding RET.
Keywords: crystal structure, GDNF, GFRα1, RET, site-directed mutagenesis
Introduction
Glial cell line-derived neurotrophic factor GDNF was first described as a trophic factor for midbrain dopamine neurons (Lin et al, 1993). Later, GDNF and other GDNF family ligands (GFLs: Neurturin, NRTN; Artemin, ARTN; Persephin, PSPN) were shown to be crucial for the development and maintenance of many more neuron populations (Baloh et al, 2000; Airaksinen and Saarma, 2002). All GFLs signal through receptor tyrosine kinase RET and require a ligand specific co-receptor α (GFRα1 binds GDNF, whereas GFRα2 binds NRTN, GFRα3 binds ARTN and GFRα4 binds PSPN (Jing et al, 1996; Treanor et al, 1996; Buj-Bello et al, 1997; Baloh et al, 1998; Enokido et al, 1998). Rat GFRα1 gene codes for a cysteine-rich protein with 468 amino acids including secretory and glycosylphosphatidylinositol (GPI)-anchoring signals. The conserved internally homologous cysteine pattern led to the proposal that GFRα1 contained three homologous domains (Suvanto, 1997; Airaksinen et al, 1999; Lindahl et al, 2000). In this model, the N-terminal domain 1 is linked by a hinge region to a core of domains 2 and 3, which is followed by a C-terminal extension. Recently, a different model with a large central domain was proposed (Scott and Ibáñez, 2001). This model neglects the conserved cysteine patterning in favor of a single large central domain (equivalent to domains 2 and 3 above).
It is widely accepted that RET is activated by homodimeric GFL-induced complex formation with GFRα1 and that the stoichiometry of the signaling complex is GFL2–GFRα2–RET2, but the mechanism of complex formation remains unclear. In one model (Jing et al, 1996), a dimeric GDNF first binds to either monomeric or dimeric GFRα1 and the GDNF2–GFRα12 complex then interacts with RET and induces its homodimerization. However, Eketjäll et al (1999) found two classes of GDNF mutants. L114A, D116A and Y120A did not crosslink to GFRα1 but still required GFRα1 to stimulate RET, while mutants D52A and E61A/E62A neither crosslinked to GFRα1 nor stimulated RET phosphorylation. Finally, Cik et al (2000) found a high-affinity (low pM) GDNF-binding site on GFRα1 only in the presence of RET. Both these studies suggest that RET binding to GFRα1 increases the affinity of GFRα1 for GDNF.
GDNF is a cysteine-knot protein and belongs to the transforming growth factor-β (TGF-β) superfamily (Eigenbrot and Gerber, 1997). Structural studies (Kirsch et al, 2000; Hart et al, 2002; Thompson et al, 2003) have shown that, in the TGF-β superfamily, the mechanism of the receptor activation is based on ligand-induced receptor dimerization. In GDNF as well, one GFRα1-binding site per monomer has been identified (Eketjäll et al, 1999). The known TGF-β superfamily receptor ectodomain structures (Greenwald et al, 1999; Kirsch et al, 2000; Hart et al, 2002) have mainly β-sheet single-domain folds, while secondary structure predictions suggest that GFRαs are mainly α-helical (Suvanto, 1997, Airaksinen et al, 1999; Scott and Ibáñez, 2001). Therefore, despite similarities in ligand structures, GFLs are likely to interact differently with their cognate GFRα co-receptors.
By preparing both chimeric GFRα receptors and their N- and C-terminal deletion mutants, Scott and Ibáñez (2001) mapped GDNF binding to the central region of GFRα1, residues 145–348. They also report that this area is responsible for ligand-independent interactions with RET, although more C-terminal residues (145–365) are needed to support GDNF-induced RET phosphorylation. We present here the crystal structure of rat GFRα1 domain 3 (residues 239–346) and a model of the homologous domain 2 (residues 150–238) (Airaksinen et al, 1999). These data together have allowed us to construct the first model of the GFRα1 fragment that binds GDNF. On the basis of the model, we investigated potential GDNF-binding surfaces using site-directed mutagenesis of selected surface-exposed amino-acid residues in rat GFRα1. Finally, we analyze available structure–function data for GDNF binding to GFRα1 and subsequent RET activation.
Results
GFRα1 domain 3 structure determination and overall fold
We purified and crystallized the rat GFRα1 domain 3 (residues 239–346) fused to N-terminal FLAG and 6His tags. The structure was solved at 1.8 Å resolution using multiwavelength anomalous diffraction (MAD) data collected from a selenomethionine-substituted protein (Table I). No structural homologs were identified using the program DALI (Holm and Sander, 1993), suggesting that the protein fold is novel.
Table 1.
X-ray data collection and refinement statistics
| λpeak | λremote | λinflection point | |
|---|---|---|---|
| Data collection | |||
| Wavelength (Å) | 0.9787 | 0.9635 | 0.9792 |
| Resolution range (Å)a | 20–1.8 (1.86–1.80) | 20–1.8 (1.86–1.80) | 20–1.8 (1.86–1.80) |
| Number of reflections | |||
| Total | 146 091 | 130 949 | 96 541 |
| Unique | 12 957 | 12 986 | 12 936 |
| Completeness (%)a | 100.0 (99.8) | 100.0 (99.8) | 100.0 (99.8) |
| I/σa | 43.7 (9.9) | 41.2 (9.4) | 34.6 (6.6) |
| Rsym (%)a | 5.3 (30.5) | 5.1 (25.5) | 5.4 (35.1) |
| Number of Se sites | 1 | 1 | 1 |
| Overall figure of merit for MAD phasing at 2.0 Å resolution | |||
| Acentric | 0.43 | ||
| Centric | 0.51 | ||
| Refinement | |||
| Resolution range (Å) | 20–1.8 | ||
| Reflections | 12 755 | ||
| Rwork (%) | 19.3 | ||
| Rfree (%)b | 20.8 | ||
| Average B-factor (Å2) | |||
| Protein | 19.6 | ||
| Solvent | 19.7 | ||
| R.m.s. deviation from ideal values | |||
| Bond lengths (Å) | 0.004 | ||
| Angles (deg) |
|
1.0 |
|
| aValues in parentheses correspond to the highest resolution shell. | |||
| bThe Rfree was calculated with 5% of the data omitted from structure refinement. | |||
Domain 3 forms a bundle of five α-helices with five disulfide bridges (Figure 1A and B). Helices α2, α1 and α4 form a triangular spiral (Figure 1B) and provide hydrophobic residues, including five phenylalanines, to the core of the bundle. The three most buried phenylalanines (Phe263, Phe328 and Phe332) are highly conserved among mouse GFRα sequences (Lindahl et al, 2000). (Unlike for mouse, not all of the rat GFRαs have been sequenced, but for those that have been, the sequence identity between rat and mouse is 98%. Consequently, we used the mouse sequence alignment (Lindahl et al, 2000) to compare the four co-receptors.) Helix α2 is followed by loop 1 (Figure 1B) making a turn to α3, which is antiparallel to and packs against helix α2. Helix α5 is an extension to helix α4. A long loop (loop 2) between helices α3 and α4, defining the other side of the triangle, was only partially visible in electron density, and residues 301–308 are excluded. The adjacent cysteines Cys313 and Cys315 are involved in two different disulfides and so divide this loop into a longer one before the cysteines and a shorter one (loop 3) after.
Figure 1.
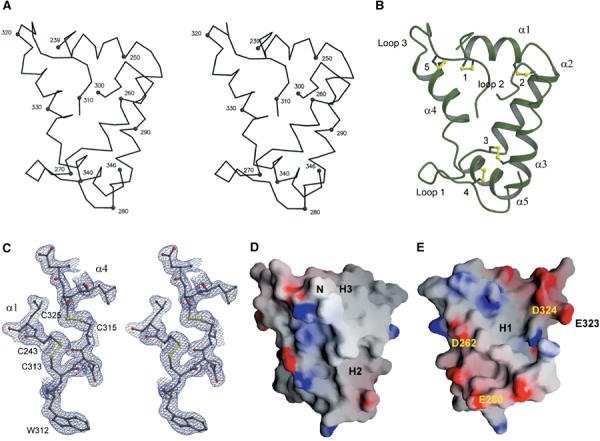
Structure of rat GFRα1 domain 3 and representative electron density map after MAD phasing and solvent flipping. (A) Stereo view of Cα backbone with N- and C-terminal and every 10th residue highlighted and labeled. (B) A ribbon diagram, α-helices shown as coils, of the crystal structure of domain 3. The same view as in (A). Regular secondary structure includes, from N- to C-terminus, helices α1 (residues 243–251), α2 (residues 254–266), α3 (residues 279–291), α4 (residues 319–333) and α5 (residues 336–345). Disulfide bridges (dsb-1–dsb-5) are labeled from 1 to 5. (C) Stereo view of the original electron density map after MAD phasing and solvent flipping calculated using 20–2.0 Å data and contoured at 1.2σ. The neighborhood of two adjacent disulfide bridges (dsb-1, 243–313; and dsb-5, 315–325) of the final model is shown as a ball-and-stick representation. The disulfide bridges are highlighted with yellow lines. (D, E) Calculated electrostatic potential for domain 3 mapped onto its molecular surface. Positive charge is colored in blue and negative in red. N-terminus (N), hydrophobic patches (H1–H3; see text) representative of the two areas of negative electrostatic charge are labeled. In (D), the view is essentially as in (A), and in (E), the molecule has been rotated 180° around the vertical axis. The figures were prepared using MOLSCRIPT (Kraulis, 1991), GRASP (Nicholls et al, 1991), BOBSCRIPT (Esnouf, 1997) and RASTER3D (Merritt and Bacon, 1997).
Disulfide bridges (dsb) dsb-1 (243–313), dsb-2 (250–256), dsb-3 (267–285), dsb-4 (277–337) and dsb-5 (315–325) were found in the corners of the triangle defined by helices α1, α2 and α4 (Figure 1B). In one corner, the adjacent cysteines Cys313 (dsb-1) and Cys315 (dsb-5) mediate a tie between helices α1 and α4, and the C-terminal end of loop 2 (Figure 1B) (see above). The second corner, an α-hairpin turn of helices α1 and α2, is locked by dsb-2. Dsb-3 and -4 form another pair of disulfide bridges in the last corner. Dsb-3 locks the antiparallel helices α2 and α3 together, and dsb-4 bridges the loop 1 and the C-terminal helix α5. The disulfides are all buried and contribute to the domain 3 hydrophobic core. The electron density maps for the cysteines were unambiguous (Figure 1C), and no indications of radiation damage were observed. Altogether, the five disulfide bridges make an extensive network. Domain 3 is clearly an independent folding unit, not part of a larger structure as previously suggested (Scott and Ibáñez, 2001).
A survey of the molecular and electrostatic surface of the domain 3 structure identified three relatively hydrophobic patches (H1–H3; Figure 1D and E), which might be involved in interprotein or interdomain interactions. H1 is formed from the partly buried patch of five phenylalanines (see above). H2, consisting of conserved residues Leu286, Tyr289, Pro299, Leu338 and Ile342 (Lindahl et al, 2000), lies between the ordered part of loop 2 and helix α5 (Figure 1D). The disordered residues in loop 2 may cover H2. The third hydrophobic area, H3 (Figure 1D), is next to the domain 3 N-terminus. This 20 Å × 18 Å plateau runs the length of helix α1, is lined by the bottom of loop 2, and includes the residues Leu246 (Pro in GFRα4), Ile255, Ile293, Val296 (Asp in GFRα2) and Trp312 with conserved hydrophobic nature (Lindahl et al, 2000). H3 is most likely the surface that interacts with domain 2 (see below).
GFRα1 has an overall positive charge, but domain 3 is unusual because its calculated pI is 4.5. This is reflected by two areas of negative electrostatic charge. The first area (top right, Figure 1E) is a band starting from Asp248 (helix α1) and continuing down one face of helix α4 (Asp321, Glu323 and Asp324). The second area (bottom left, Figure 1E) consists of residues Asp262, Glu270, Glu280 and Asp284 in loop 1 and helices α2 and α3. In the first area, the acidic nature of the neighboring Glu323 and Asp324 as well as the turn sequence (SGN) preceding helix α4 are conserved among the mouse GFRα1–4 sequences (Lindahl et al, 2000). In the second area, only the acidic nature of residue 280 is fully conserved, while Asp262 is conserved in GFRα1, GFRα2 and GFRα3.
Modeling of GFRα1 domain 2
The structure of domain 3 clearly demonstrates that GFRα1 is composed of three homologous domains, despite some earlier suggestions (Scott and Ibáñez, 2001; Wang et al, 2004). First, domain 3 forms a compact well-folded structure, with five intradomain disulfide bridges (Figure 1B). Second, the presence of five disulfide bridges per domain (four in domain 1) is consistent with the conserved cysteine pattern in GFRα1 as well as in the other GFRαs (Suvanto, 1997; Airaksinen et al, 1999; Lindahl et al, 2000). Third, the predicted domain 2 helices (Airaksinen et al, 1999) have the same positions with respect to the disulfide bridges as the observed helices in domain 3 (Figure 2).
Figure 2.
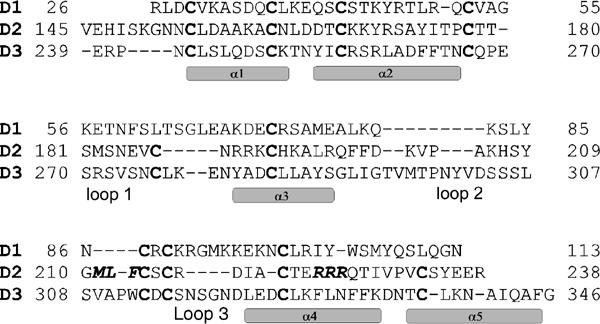
Sequence alignment of GFRα1 domains 1, 2 and 3. The cysteines governing the alignment are highlighted in bold. The two amino-acid triplets in domain 2, MLF and RRR, reported to be important for GDNF binding (Scott and Ibáñez, 2001) are labeled in bold and Italic. The observed domain 3 secondary structure elements and the three loops are shown. The sequence alignment was generated with CLUSTALW (Higgins et al, 1994).
The domain 2 model, residues 150–238, corresponds to domain 3 residues 239–342 and has a hydrophobic core and exposed charged side chains. The modeled helices are referred as helices α1′–α5′. The domain 2 disulfides are modeled as dsb-A (154–214), dsb-B (161–167), dsb-C (178–192), dsb-D (187–233) and dsb-E (216–221). Domain 2 has a more compact structure than domain 3 as all the three loops are shorter (Figure 2). The long loop 2 is shorter by six residues and large changes also occur in the other two loops. Loop 1 is shorter by four residues, one before and three after Cys187 (corresponds to Cys277 in domain 3 dsb-4; Figure 1B), abolishing a turn preceding helix α3′. The loop 3 seen in domain 3 is not present in domain 2 due to the absence of five residues.
Triple alanine mutations at 224RRR and 211MLF in domain 2 affect GDNF binding (Scott and Ibáñez, 2001). In the sequence alignment of domains 2 and 3 (Figure 2), Arg224 corresponds to Phe328, which is one of the phenylalanines defining the domain 3 hydrophobic core. To avoid the unlikely burial of Arg224, helix α4′ is interrupted with a bend that brings the Arg224 side chain to the domain surface. However, as the cysteine spacing from Cys221 to Cys233 is conserved (Figure 2), the residues following the arginines were modeled according to the corresponding domain 3 atomic coordinates. In the model, all the three arginines are exposed, Arg226 pointing essentially in the opposite direction to Arg224 and Arg225. Consistent with earlier mutation data (Scott and Ibáñez, 2001), the 211MLF triplet is close to Arg224. Met211, Leu212 and the nearby Cys214 in dsb-A are buried and seem to form part of the hydrophobic core rather than being involved in GDNF binding. Phe213 is on the surface, 10 Å from Arg224, and therefore might participate in GDNF binding.
Domain 2 is basic due to two large positively charged areas. Arg224 and Arg225 define the first area, along with Arg217, His207 and Lys150 (Figure 3A). The second positively charged area spans helix α3′ with a potential heparin-binding motif (BBBXBBXXB, residues 189–197). Heparin promotes GDNF binding to GFRα1 (Rickard et al, 2003). Lys168, Lys169, Lys202 and Arg238 are close by. Domain 2 contains only one distinct hydrophobic surface, at the C-terminus of the domain (Ile229, Val230, Val232, Tyr235 and Tyr209). This surface may form the domain 2 interface with domain 3; intriguingly, there appears to be no flexible linker between domain 2 and domain 3 (see below).
Figure 3.
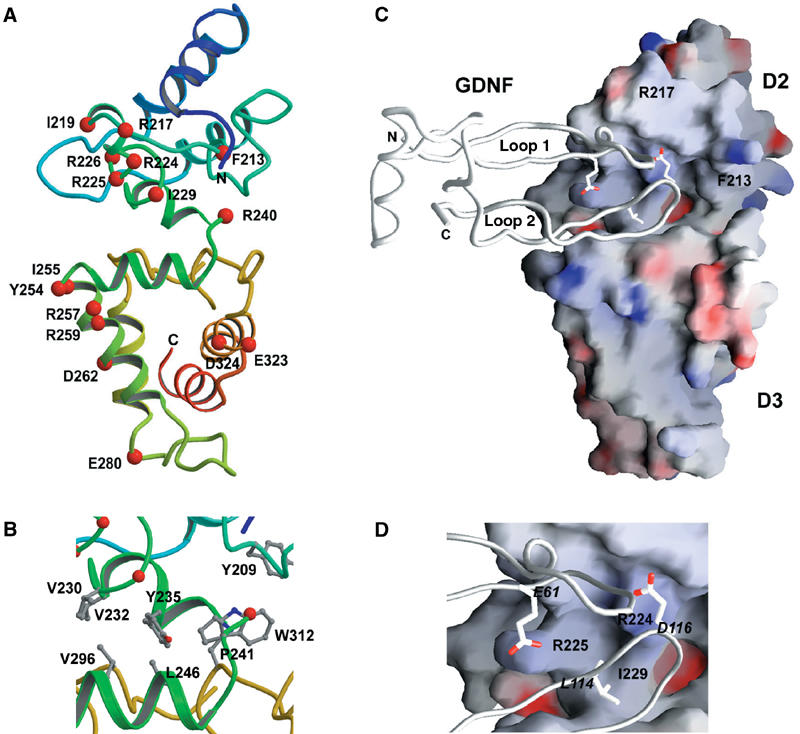
The proposed two-domain model of GFRα1 and the putative GDNF-binding interactions. (A) A ribbon diagram, α-helices shown as coils, of the putative two-domain model of GFRα1. The Cα-atoms of the mutated residues are highlighted in red and the mutated residues are labeled. (B) Close-up of the GFRα1 domain 2–domain 3 interface, colored as in (A), but with the key hydrophobic residues shown in a ball-and-stick representation and labeled. (C) Electrostatic potential surface representation of the proposed two-domain model of GFRα1 together with a GDNF monomer backbone represented as a tube. Positive surface is colored blue and negative red. (D) Close-up of (C). GDNF residues important for GFRα1 binding (Eketjäll et al, 1999) and making putative interactions with the GFRα1 residues revealed by our mutagenesis are labeled in Italic and shown as a ball-and-stick representation. GDNF Leu118, also binding GFRα Ile229, is omitted for clarity. The figures were prepared with MOLSCRIPT (Kraulis, 1991), RASTER3D (Merritt and Bacon, 1997) and GRASP (Nicholls et al, 1991).
A model of the GDNF-binding GFRα1 fragment
A GFRα domain fold has, due to numerous disulfide bridges and α-helices, a well-defined, rigid core between the first and last cysteine residues. The first cysteine residue in the crystal structure of domain 3 is Cys243 and the last cysteine residue in the domain 2 model is Cys233. Thus, the potential flexible region between the domains is at most from 234 to 242. However, the first residue in the domain 3 structure is 239 and the last five domain 2 C-terminal residues (234–238) are easily modeled using the domain 3 coordinates. Consequently, there appears to be essentially no linker between the domains, consistent with sequence analysis (Airaksinen et al, 1999). As hydrophobic patches were identified both near the domain 2 C-terminus and the domain 3 N-terminus, we constructed a two-domain GFRα1 model (Figure 3A) by hand-optimizing the interactions between these hydrophobic patches (Figure 3B). This constitutes a structural model of the GDNF-binding fragment of GFRα1 (Scott and Ibáñez, 2001).
In the two-domain model, domain 3 Trp312 intercalates between domain 2 Tyr209 and Tyr235 (Figure 3B). Among mouse GFRα sequences, Trp312 is conserved, except for Ser in GFRα3, and residue 235 is always hydrophobic (Tyr, Leu or Phe), while Tyr209 is conserved in GFRα1 and GFRα2. Next to Trp312 in domain 3 is a small hydrophobic cleft lined by conserved Leu246 (Pro in GFRα4) and Pro241. Optimization of the hydrophobic interactions at the domain interface places domain 2 Tyr235 into this cleft and suggests putative interactions with Leu246 and Pro241 (Figure 3B). Other potential interactions include contacts between domain 2 Val230 and Val232 and domain 3 Val296. Interestingly, the domain 2 side of this interface contains the Arg224 and Arg225 electropositive region that is important for GDNF binding (Scott and Ibáñez, 2001). Below the arginines is Ile229, which does not contribute to the domain–domain interactions but remains exposed. The GDNF-binding site seems to be near the domain 2 and 3 interface and so the hydrophobic areas at the domain interface may also have a role in ligand binding.
The GDNF–GFRα model and site-directed mutagenensis
Since GFRα1 is known to bind GDNF acidic and hydrophobic finger loops (Eketjäll et al, 1999), the GFRα1 surface involved in these interactions should possess both electropositive and hydrophobic characters. Furthermore, since GDNF binding is not local1zed to a single domain but to the central part of GFRα1 (Scott and Ibáñez, 2001) corresponding to domains 2 and 3, both domains presumably participate in GDNF binding. Thus, the likely area is at the domain interface, in the neighborhood of the 224RRR triplet.
To confirm the proposal and to test the models experimentally, we mutated several of the GFRα1 residues within the putative GDNF-binding surface and studied GDNF-binding and GDNF-induced RET activation. The mutants chosen were as follows: F213A, R217E, I219Q, R224A, R225A, R226A, I229D (domain 2), and R240A, E280A, Y254A/I255A, R257A/R259A, D262A/E280A, E323A/D324A (domain 3) (Figure 3A). As the arginines in 224RRR point in different directions, not all can be involved in GDNF binding and so single-site mutants should reveal the GDNF-binding direction. Phe213, Ile219 and Ile229 are conserved nearby hydrophobic residues, and Arg217 and Arg240 (domain 3) are nearby basic residues. Tyr254 is at the edge of the hydrophobic patch in domain 3 defining the domain interface and is not conserved among the mouse GFRα receptor sequences (Lindahl et al, 2000). The fully conserved Arg257 and Arg259 are located at the beginning of helix α4. Most of the selected residues were mutated into alanines to avoid structural distortion; however, for 229, we chose mutation into aspartic acid, as the effect of I229A might have been difficult to detect.
Biochemical characterization of the GFRα1 variants
The biochemical effects of the mutations were determined in four ways, with different strengths and weaknesses. First, we screened the effect of added GDNF on RET phosphorylation in MG87-RET cells, transfected with wild-type (wt) or mutant GFRα1. The cells were treated with 3.3 nM GDNF or without, and examined for GDNF-induced RET phosphorylation (Figure 4). Only I229D did not mediate phosphorylation of RET. A number of active mutants were further analyzed by varying the GDNF concentration from 33 pM to 3.3 nM, and all behaved essentially as wt (see Supplementary Figure 1, data shown only for wt, R224A and R225A). The RET phosphorylation assays are the most biologically relevant as they show competent signaling. However, in cell lines with low expression levels of RET, and high transient expression levels of the GFRα1 receptor, one can only identify mutants where GDNF binding is completely abolished. Mutants with weakened GDNF binding have also previously been shown to be active in RET phosphorylation assays (Scott and Ibáñez, 2001). From these assays, we could conclude that only Ile229 is involved in GDNF binding and in mediating RET phosphorylation.
Figure 4.
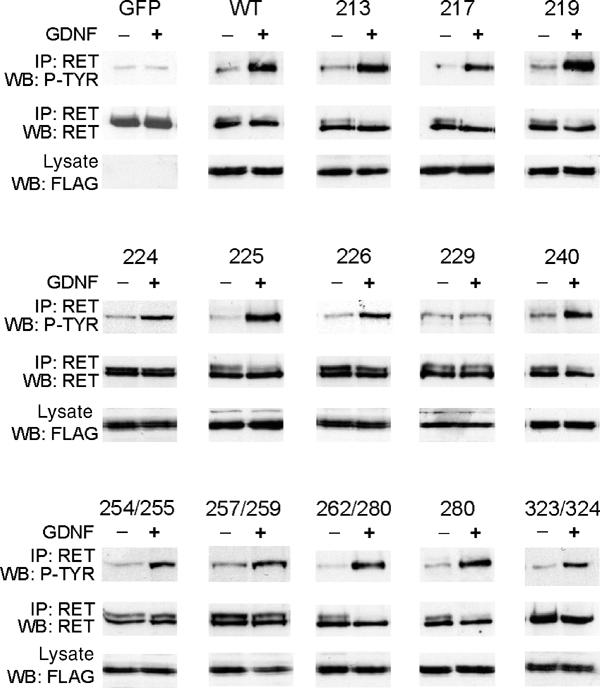
RET phosphorylation in transiently transfected MG87-RET cells. For each mutant, two parallel samples were used. One was unstimulated, and the other was stimulated with 100 ng/ml GDNF. To ensure that the expression of the mutant was the same in both samples, a fraction of each extract was used for direct probing with anti-FLAG antibodies. Thereafter, RET was immunoprecipitated (IP) from the cell extracts, and its phosphorylation was monitored on Western blots with antibodies to phosphotyrosine (P-TYR). The immunoprecipitated samples were reprobed with antibodies to RET to verify equal loading of proteins in both lanes. GFP-transfected cells were included as a negative control, while the wild-type (WT) GFRα1 receptor was included as a positive control.
Nevertheless, as previous studies (Scott and Ibáñez, 2001) had shown that 224RRR was involved in binding GDNF, we decided to study the binding of GDNF using crosslinking and binding assays. In the absence of RET, 1 nM 125I-GDNF could be crosslinked to wt GFRα1 and to the R217E and D262A/E280A variants (Figure 5F). It could not be crosslinked to I229D, consistent with the RET phosphorylation assay (Figure 4), nor could it be crosslinked to F213A, R224A and R225A. The crosslinking assays were however performed at 1 nM concentrations of radioligand, and so we could detect abolished binding only to severely affected mutants. We therefore quantified binding of GDNF to GFRα1 using both a cell-based assay and a scintillation proximity assay (SPA) to determine IC50 values (Figure 5; Table II; Supplementary Figure 2). The results of the latter biophysical technique agree well with the former (Table II), showing that the cell-based binding data are reliable and accurate.
Figure 5.
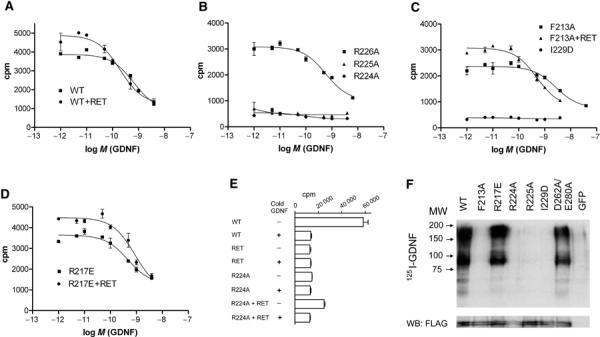
Effect of GFRα1 mutants on 125I-GDNF binding. (A) Displacement of 50 pM 125I-GDNF bound to wild-type (WT) GFRα1-coated SPA beads by unlabeled GDNF as described in Methods. Data are shown with and without the addition of RETED. Each data point represents the mean of three or four independent determinations±s.e. The binding isotherms fitted using nonlinear regression for one-site homologous competition are plotted. (B) Same as (A) for R224A, R225A and R226A mutants without the addition of RETED. No data fitting was attempted for the R224A and R225A mutants as there is no binding. (C) Same as (A) for F213A mutant with and without the addition of RETED. (D) Same as (A) for R217E mutant with and without the addition of RETED. (E) Bar graph of binding and displacement of 1 nM 125I-GDNF bound to COS7 cells by 100 nM cold GDNF. Results are shown for cells expressing wild-type (WT) GFRα1, RET, R224A mutant without RET and R224A mutant with RET. (F) Chemical crosslinking of 1 nM 125I-GDNF to total lysates of wild-type (WT), mutant GFRα1 receptor and GFP-transfected COS7 cells. The lysates were resolved on a 10% SDS–PAGE and transferred to nitrocellulose membrane and autoradiograph of the membrane is shown. In addition, the lower panel shows anti-FLAG Western blotting (WB) of the same membrane to quantify GFRα1 expression levels.
Table 2.
Competition of 125I-GDNF binding to GFRα1 receptor variants
| Receptor | IC50 (nM) GDNF |
|||
|---|---|---|---|---|
| Cell-based assay |
Scintillation proximity assay |
|||
| −RET | +RET | −RETED | +RETED | |
| WT | 0.92 | 0.32 | 0.89±0.15 | 0.20±0.02 |
| F213A | 11.0 | 2.2 | 3.53±0.43 | 1.02±0.29 |
| R217E | 0.79 | 0.57 | 0.65±0.10 | 0.52±0.10 |
| R226A | 0.77 | NDa | 1.02±0.27 | NDb |
| R257A/R259A | 0.49 | NDa | 0.86±0.24 | NDb |
| D262A/E280A | 2.4 | 0.25 | ||
| E323A/D324A | 1.8 | 0.32 | ||
| Y254A/I255A | 0.82 | NDa | ||
| I219Q | 0.81 | NDa | ||
| E280A | 1.2 | NDa | ||
| R224A | No binding | No binding | No binding | NDb |
| R225A | No binding | No binding | No binding | NDb |
| I229D |
No binding |
No binding |
No binding |
NDb |
| The results for the cell-based assay are IC50 values from single experiments and for the SPA assay mean IC50 values±s.e. from three independent experiments. | ||||
| aIC50 values were not determined in the presence of RET because binding in the absence of RET was wt and these variants activated RET phosphorylation as wt. | ||||
| bIC50 values were not determined because results in the absence of RETED were similar to the results in the cell-based assay. | ||||
Our IC50 value for the competition of GDNF/125I-GDNF binding to wt GFRα1 in the absence of RET (Figure 5A), 0.92 nM for the cell-based assay and 0.89 nM by SPA (Table II), is comparable to the previously reported value, 1.9 nM (Cik et al, 2000). R224A, R225A (Figure 5B) and I229D (Figure 5C) did not bind GDNF. F213A bound GDNF (Figure 5C) four-fold (SPA) to 12-fold (cell-based assay) weaker than wt (Table II). This is consistent with the crosslinking results (Figure 5F), because the concentration of 125I-GDNF in that experiment was 1 nM, and the binding constants for all these four variants are 11 nM (F213A) or more in the absence of RET in the cell-based assay (Table II and below). All the other mutants show essentially wt behavior in the absence of RET (Table II).
As with wt, RET enhances GDNF binding to the F213A variant (Figure 5C) by a factor of 3–5 (Table II). Interestingly, the R217E variant does not bind GDNF more tightly in the presence of RET, although it shows wt behavior in GDNF-induced RET activation (Figure 4) and in neurite outgrowth activity in PC6 cells (data not shown). The mutant thus appears not to affect GDNF binding directly, consistent with the model (Figure 3C and D), but appears to affect the allosteric coupling between GDNF and RET.
Additional binding experiments were performed to determine a putative lower affinity limit for GDNF binding for the R224A mutant. The concentration of 125I-GDNF (GDNF*) was increased to 1, and 100 nM unlabeled GDNF was used for homologous competition. The R224A mutant alone did not bind GDNF, but coexpression of RET partially restores binding (Figure 5E). Assuming a conventional binding curve, that the concentration of wt and R224A protein is the same, that [GDNF*] is 1 nM, that 60 000 counts represent saturation of GFRα1 and so can be used as an estimate of the total concentration of wt, the Kd can be crudely estimated using the following ratio:
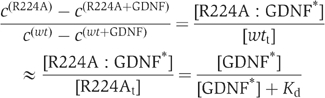
with c(R224) being the measured counts for R224A in the absence of cold GDNF, c(R224+GDNF) being the measured counts for R224A in the presence of cold GDNF and similarly for wt. [wtt] is the total concentration of wt, [R224At] that of R224A and [R224A:GDNF*] is the concentration of the R224A:GDNF* complex. This leads to Kd (R224A with RET) ≈3–5 nM, and Kd (R224A alone) >10–20 nM. This is consistent with results by others (Eketjäll et al, 1999; Scott and Ibáñez, 2001) showing that RET activation in cells overexpressing receptor can occur despite suboptimal GDNF–GFRα1 interactions.
Docking of GDNF to the GFRα1 model
The structure of GDNF has previously been published (Eigenbrot and Gerber, 1997), and we docked that to our two-domain model of GFRα1. The previously published mutagenesis data on GDNF (Eketjäll et al, 1999) showed that numerous GDNF residues, when mutated to alanine, affected binding to GFRα1. However, only two mutations in GDNF, E61A/E62A and D116A, completely abolished the binding to GFRα1. Similarly, our data show that GFRα1 mutations R224A and R225A abolish binding to GDNF. Our GFRα1–GDNF model is consistent with these data (Figure 3D), as Asp116 of GDNF interacts with the basic Arg224 of GFRα1, while Glu61, rather than the Glu62, of GDNF is close to the Arg225 of GFRα1 (Figure 3D). This explains why Glu61, but not Glu62, is conserved among GFLs (Eketjäll et al, 1999). This docking model furthermore brings the Leu114 and Leu118 of GDNF in contact with the Ile229 of GFRα1 (Figure 3D), while GDNF Leu118 is the closest hydrophobic residue to GFRα1 Phe213. Finally, GDNF Tyr120 also lies in the GDNF-binding pocket between domains 2 and 3. The mutagenesis data and our model are thus consistent.
Discussion
Ligand specificity in GFL-dependent RET signaling is controlled by the interactions between GFLs and the corresponding GFRαs. To study these interactions, we have solved the GFRα1 domain 3 crystal structure at 1.8 Å resolution. The structure reveals a novel all-α fold with five disulfide bridges, differing drastically from the other known TGF-β superfamily receptor structures. It serves as a model for other homologous domains (Airaksinen et al, 1999; Lindahl et al, 2000) in the GFRα family, including GFRα2, GFRα3 and GFRα4. Domain 3 atomic coordinates were used to model GFRα1 domain 2, the other half of the ligand-binding fragment, in order to provide new insight into how GDNF might bind to its co-receptor GFRα1.
Our mutagenesis data for the first time identify five specific domain 2 residues with effects on GDNF binding and RET phosphorylation. Four residues (Phe213, Arg224, Arg225 and Ile229) are in the GDNF interface, while one, Arg217, clearly is not. The effects of the first four mutations fall into two categories: (1) mediating GDNF-dependent RET phosphorylation (Figure 4, Supplementary Figure 1) despite weakened GDNF binding (F213A, R224A, R225A) or (2) indetectable GDNF binding and RET phosphorylation (I229D). The results reflect the differing sensitivity of binding versus phosphorylation assays; even a minute amount of binding leads to phosphorylation, making RET phosphorylation studies insensitive to mutation (Scott and Ibáñez, 2001). The data confirm the importance of the 224RRR triplet (Scott and Ibáñez, 2001), but show that, consistent with the domain 2 modeling, only Arg224 and Arg225 interact with GDNF; Arg226 points away from GDNF and is fully active when mutated into alanine. Similarly, only Phe213 from the 211MLF triplet (Scott and Ibáñez, 2001) can interact with GDNF in our model, and the F213A variant shows reduced GDNF binding (Table II). Ile229 is located directly below Arg224 and Arg225. It was the only tested mutant not to support GDNF-induced RET phosphorylation (Figure 4) showing, similarly to GDNF mutagenesis data (Eketjäll et al, 1999), the importance of hydrophobic residues in GFRα1.
The most interesting mutant is R217E, which binds GDNF as tightly as wt, but does not bind GDNF tighter in the presence of RET (Table II). What might its role be, given that it is 10–20 Å from the putative GDNF interface on GFRα1 (Figure 3C)? Although R217E does not support the higher affinity binding of GDNF in the presence of RET, it still activates RET in the presence of GDNF (Figure 4). It is thus tempting to speculate that Arg217 is part of the GFRα1–RET interface (Figure 3C), and that in the mutant, some aspect of the allosteric mechanism of GFRα1 appears not to be normal. (This is different from F213A, R224A and R225A, which display weakened GDNF binding, but which clearly bind GDNF tighter in the presence of RET.) The R217E data indicate that, although GFRα1–RET interactions are necessary for forming the higher affinity GFL-binding complex, they are not crucial for RET activation.
Scott and Ibáñez (2001) also found GFRα1 mutants, which did not crosslink to GDNF but nonetheless mediated GDNF-induced RET phosphorylation, and Eketjäll et al (1999) report GDNF mutants, which, despite impaired GFRα1 binding, activate RET normally. Clearly, GDNF–GFRα1 interactions can largely be compromised without losing GDNF-induced RET activation, which explains the cross-talk between the homologous GFLs and GFRαs (Airaksinen et al, 1999). Direct GDNF–RET interactions may be important for RET activation (Eketjäll et al, 1999; Scott and Ibáñez, 2001); GFRα1 may be a scaffold to hold the GDNF in place to interact with RET. One possible arrangement (Figure 6) places the GFRα1s on the outside of the dimeric complex, holding the GDNF by the ‘fingers' as in our model (Figure 3C). This crossover model is consistent with recent work (Anders et al, 2001; Kjær and Ibáñez, 2003) showing that the first cadherin-like domain of RET contains the largest GFRα1 interface, and our model places the two RET tyrosine kinases close to each other, as they need to be. Our structure and mutagenesis data are, however, not consistent with the recent paper by Wang et al (2004). For instance, the results on the R259A variant differ completely, and the GDNF-binding residues they propose (Arg259, 152NN and 316SNS) are both distant from our GDNF-binding site and from each other; they do not form a surface. They also believe that GFRα1 contains a large central domain, comprising our domains 2 and 3, which this work conclusively disproves.
Figure 6.
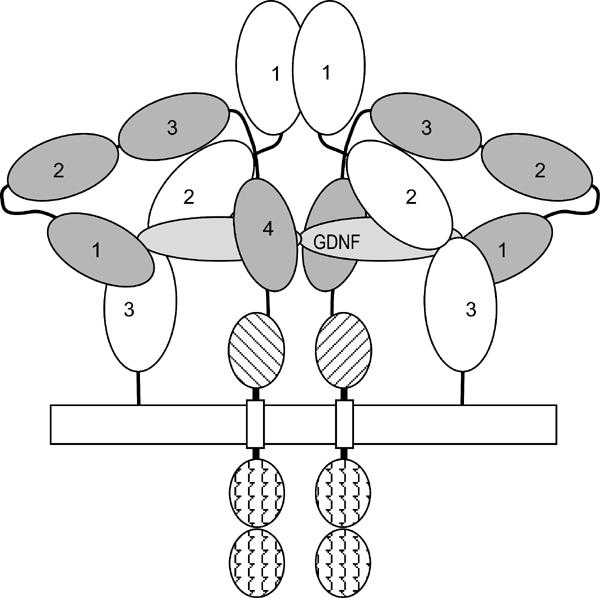
Schematic diagram of the interaction of GFRα1, RET and GDNF. A (GDNF–GFRα1–RET)2 symmetrical dimeric complex is shown. Dark gray: the four cadherin domains of RET, numbered 1–4; diagonal lines, the cysteine-rich domain; wavy lines, the tyrosine kinase domains. In light gray (labeled) is the GDNF dimer. In white are the three triangular α-spiral folds of GFRα1. The figure shows the interaction between GDNF, the GFRα1 domain 2–3 cleft (see above) and cadherin domain 1 of RET (Kjær and Ibáñez, 2003).
On the basis of our findings, the previously reported GDNF structure (Eigenbrot and Gerber, 1997) and the GDNF (Eketjäll et al, 1999) and GFRα (Scott and Ibáñez, 2001) mutagenesis data, we propose a molecular model for how GFRα1 binds GDNF (Figure 3C and D). In it, the GFRα1 Arg224 and Arg225 interact with the GDNF Asp116 and Glu61, while Ile229 interacts with GDNF Leu114 and Leu118. The latter may also interact with Phe213 after a small structural rearrangement. GFRα1 Arg224 and Arg225, as well as the hydrophobic nature of residue 229, are fully conserved (Airaksinen et al, 1999; Lindahl et al, 2000; Scott and Ibáñez, 2001), suggesting that these interactions occur in all GFRα–GFL complexes. Our work provides the structural basis for continued exploration of GFRα in the RET–GFRα–GFL system.
Materials and methods
Expression and purification of GFRα1 domain 3
A construct encoding residues 239–346 of mature rat (Rattus norvecigus) GFRα1 and N-terminal FLAG and 6His tags was subcloned into the pFASTBAC1 (Gibco-BRL)-based baculovirus transfer vector pK503.9 (Keinänen et al, 1998). Soluble secreted GFRα1 domain 3 was expressed by infection of Sf9 insect cells with baculovirus at high multiplicity. Cells were grown in serum-free SF900II (Invitrogen) medium supplemented with 50 μg/ml gentamycin (Sigma) at +27°C. At 3 days postinfection, GFRα1 domain 3 was purified from culture supernatants by Ni-chromatography (Ni2+-charged chelating sepharose, Amersham Biosciences). The supernatant was adjusted to pH 7.5 with PBS and Ni2+-resin was added. After 2 h incubation at +4°C, the resin was washed with PBS with 10 mM imidazole. Protein from an imidazole elution was further purified by a Resource Q anion exchange column (Amersham Biosciences). The column was eluted with a 0–1 M NaCl gradient in 20 mM Tris buffer, pH 8.5. For crystallization, the protein buffer was changed to 10 mM HEPES, pH 7.
For selenomethionine (SeMet) labeling, the expression protocol was modified according to Bellizzi et al (1999). At 24 h after infection, the insect cells were harvested, washed and transferred to SF900II medium lacking methionine (Invitrogen). Following a 4-h depletion period, the medium was supplemented with 50 μg/ml L-SeMet (Calbiochem). The culture supernatant was harvested after additional 48 h and the protein was purified as above.
Crystallography
Crystals of the GFRα1 domain 3 were grown at +4°C in sitting drops over a reservoir solution of 50 mM MES, pH 6.5, 0.2 M MgCl2 and 10% (v/v) 2-methyl-2,4-pentanediol (MPD). The drops were prepared by mixing 2 μl of the reservoir solution and 2 μl of the protein solution at 3 mg/ml. The crystals belong to spacegroup P61 (a, b=61.3 Å, c=65.2 Å) with one molecule per asymmetric unit and solvent content of 51%. For data collection at −180°C, crystals were frozen in liquid nitrogen with the well solution containing MPD at 20% (v/v).
MAD data on a selenomethionine derivative were collected to 1.8 Å using the BW7A beamline at EMBL Hamburg Outstation at three wavelengths (Table I). The remote wavelength data set was used for the final refinement. The data sets were processed with the programs DENZO and SCALEPACK (Otwinowski and Minor, 1997). CNS (Brünger et al, 1998) was used to find the single selenium site and to estimate experimental phases at 2.0 Å (Table I). The spacegroup was shown to be P61 by calculating electron density maps both in P61 and P65, and choosing the one that gave clear protein–solvent boundaries. The electron density map obtained upon solvent flipping with CNS was used for initial model building.
Using the automated model-building tools in O (Jones et al, 1991), the sequence was built for residues 239–300 and 309–346. This model was subjected to iterative rounds of building and refinement in CNS (Brünger et al, 1998). Initial refinement was carried out using bulk solvent correction, torsion angle-simulated annealing and B-factor refinement. Water molecules were added to peaks above 3.7σ in the (Fo−Fc) difference map if they had suitable hydrogen bonding geometry. The final model, with good stereochemistry (Table I), consists of 100 amino acids, one MPD molecule and 97 water molecules. The N-terminal FLAG and 6His tags, residues 301–308 as well as the side chain of the first residue (239) are not seen in the electron density. PROCHECK (Laskowski et al, 1993) was used to assign secondary structure elements and calculate the Ramachandran plot. Of all the non-Gly/non-Pro residues, 96.5% have main-chain torsion angles in the most favored regions, and there are no residues in the disallowed regions.
Modeling
The domain 3 atomic coordinates were used to model the homologous domain 2 (residues 150–238). The domain 3 and 2 sequences were aligned with CLUSTALW (Higgins et al, 1994) and side chains were changed, according to this alignment, in O (Jones et al, 1991). Loop lengths were adjusted to correspond to the sequence alignment by deleting domain 3 residues, although 3 residues had to be added in the domain 3 missing loop area. The loop data base in O was used to refine loop structures. The final model was refined in CNS by running an energy minimization step. No constraints were used to allow unfavorable atom contacts and bad geometry to be removed. As expected, the disulfide bridges held the overall fold intact. Acceptable model quality was verified by PROCHECK. The docking of the modeled domain 2 to the domain 3 structure as well as the preparation of the GDNF-binding model was carried out manually in O.
Mutagenesis, chemical crosslinking and RET phosphorylation
Mutant clones of rat GFRα1 with an N-terminal FLAG tag were constructed by overlapping PCR fragment mutagenesis. All clones were sequenced to ensure no undesired mutations were introduced during PCR. Full-length wt and mutant FLAG-tagged GFRα1 proteins were expressed in transiently transfected MG87-RET fibroblast cells (Eketjäll et al, 1999) and expression levels were analyzed by Western blotting using both anti-FLAG (M2, Sigma) and anti-GFRα1 (ψProSci Inc.) antibodies. All mutant proteins were produced at levels similar to wt (Figure 4). The secretion of the completely inactive mutant I229D was verified by biotinylation of cell-surface proteins (data not shown).
For chemical crosslinking, GDNF (PeproTech, Ltd, and a kind gift from Cephalon, Inc.) was enzymatically iodinated by lactoperoxidase (Lindahl et al, 2001). At 24 h after transfecting COS7 cells with mutant GFRα1 cDNA, cells were washed and incubated with 1 nM 125I-GDNF in binding buffer (Dulbecco's modified Eagle's medium, 0.2% BSA and 15 mM HEPES, pH 7.2) for 2 h on ice. Cells were then washed again three times with ice-cold PBS. N-hydroxysuccinimide (NHS, Sigma) and ethyl-3-(3-dimethylaminopropyl) carbodiimide hydrochloride (EDAC, Sigma) were added to final concentrations of 20 and 40 mM, respectively, and cells were incubated in PBS, pH 7.4, for 20 min at room temperature. The reaction was quenched with TBS, and cells were collected, washed and lysed in lysis buffer (TBS, pH 7.4, 2 mM EDTA, 1% Nonidet P-40, 1% Triton X-100, 1 mM PMSF and Complete protease inhibitor mixture from Roche Molecular Biochemicals). The lysates were subsequently resolved on a 10% SDS–PAGE and transferred to nitrocellulose membrane for autoradiographic exposures. The same membrane was probed with anti-FLAG antibodies (for GFRα1 detection) to ensure that similar amounts of proteins were loaded onto each gel.
The RET phosphorylation assay was carried out by transiently expressing wt or mutant GFRα1 in MG87-RET cells (Eketjäll et al, 1999). At 24 h after transfection, cells were starved for 4 h and stimulated with 100 ng/ml (3.3 nM) GDNF (PeproTech, Ltd) for initial screening. Later, dose-dependent RET phosphorylations were carried out with 0.033–3.3 nM GDNF. At 10 min after stimulation at +37°C, cells were lysed on ice and the lysates were immunoprecipitated with RET antibodies (C-20, Santa Cruz Biotechnology). The precipitated immunocomplexes were resolved on SDS–PAGE, transferred to nitrocellulose membranes and probed with phosphotyrosine antibodies (4G10, Upstate Biotechnology). To ensure that equal amounts of RET were precipitated in each sample, the filters were stripped and re-stained with antibodies to RET. The GFRα1 expression levels were analyzed by Western blotting directly from the crude lysate before the immunoprecipitation of RET. The RET phosphorylation assay was repeated at least twice for each mutant.
GDNF-binding assays
For the cell-based homologous competition binding assay, iodinated GDNF (see above, 50 pM) was applied in binding buffer (DMEM, pH 7.4, 0.5% milk and 0.2% BSA) to COS7 cells transfected with GFRα1 cDNA 24 h before assay. Cells were incubated for 2 h on ice in the presence of unlabeled ligand from 0 to 5000 pM (0 to 50 nM for F213A mutant) and then washed with binding buffer without milk and BSA for four times. Upon lysis with 1 M NaOH, cells were placed in scintillation vials and counted on a 1214 RackBeta (Wallac/LKB) scintillation counter. Three to four runs were performed in parallel and the background level was assessed using RET-transfected cells. For competition assays in the presence of RET, the cells were co-transfected with RET and GFRα1 cDNA at a 1:1 ratio, unlike Cik et al (2000).
For SPA, soluble rat GFRα1 variant (GenBank™: AJ002072) and human RET extracellular domain (GenBank™: X12949; RETED) constructs were prepared. The cDNA regions of wt GFRα1 and GFRα1 mutants F213A, R217E, R224A, R225A, R226A, I229D and R257A/R259A coding for amino acids 20–425 were amplified by PCR using primers incorporating 5′-NotI and 3′-HindIII restriction sites in addition to an N-terminal 6His tag and a stop codon at the 3′-end. RETED construct was prepared by amplifying the cDNA region for amino acids 28–636 by PCR using primers incorporating a C-terminal 6His tag and a stop codon at the 3′-end. The resulting products were cloned into the baculovirus vector pK503.9 (Keinänen et al, 1998), which further added a FLAG tag at the N-terminus. The clones were confirmed by sequence analysis. The wt and mutant GFRα1 were expressed in insect cells (see supplementary Figure 3) and extracted from the medium with Ni2+-resin as domain 3 above. RETED was expressed similarly (see Supplementary Figure 3) and used unpurified. The amounts of GFRα1 and RETED were estimated by Western blotting against known concentrations of purified domain 3 (data not shown). Binding studies were performed in 96-well plates (HB Isoplate, Wallac) in 200 μl volumes. SPA PVT beads precoated with anti-mouse antibodies (Amersham Biosciences) were first mixed with 10 ng of anti-FLAG (M1, Sigma) antibodies and an equal amount of GFRα1 in TBS, pH 7.4, supplemented with 1 mM CaCl2 and 1.0 mg/ml BSA. If desired, an excess of RET was added into 10 μl of RETED medium. The beads were then incubated with 50 pM 125I-GDNF (see above) in the presence of cold GDNF (Amgen) up to 4 nM (40 nM for F213A). Background levels were defined in the presence of RETED but omitting the GFRα1 variant from the assay. After 3 h incubation at room temperature, plates were counted in a MicroBeta Trilux scintillation counter (Wallac). Each SPA assay was repeated three times with three or four parallel runs.
The binding data were analyzed by nonlinear regression analysis using Prism 3.02 (GraphPad Prism Software, San Diego, CA) to determine the IC50 values. As the concentrations of the 125I-GDNF used in the assays were much less than the IC50 values obtained, the IC50 values are approximations of the binding affinities, Kd's. The competition data were fitted according to one-site binding models with the background kept constant.
Coordinates
Coordinates have been deposited in the Protein Data Bank (accession code 1Q8D) for release upon publication.
Supplementary Material
Supplementary Figure 1
Supplementary Figure 2
Supplementary Figure 3
Acknowledgments
We are indebted to Mari Heikkinen and Satu Åkerberg for excellent technical assistance, and to Heidi Virtanen for help with phosphorylation assays. We thank CF Ibáñez for MG87-RET cells. This work was supported by the Academy of Finland, the Sigrid Jusélius Foundation, TEKES EU grant QLG-CT-2002-0100 and Biocentrum Helsinki. We acknowledge the EMBL Hamburg Outstation (Germany) for beam time and for support under the European Community's program (Access to Research Infrastructure Action of the Improving Human Potential Programme to the EMBL Hamburg Outstation, contract number HPRI-CT-1999-00017). Also, we thank the EMBL staff, particularly W Rypniewsky, for assistance with X-ray data collection. MS and AG are Biocentrum Helsinki fellows and AM is a Research Fellow of the Wellcome Trust.
References
- Anders J, Kjær S, Ibáñez CF (2001) Molecular modeling of the extracellular domain of the RET receptor tyrosine kinase reveals multiple cadherin-like domains and a calcium-binding site. J Biol Chem 275: 35808–35817 [DOI] [PubMed] [Google Scholar]
- Airaksinen M, Saarma M (2002) The GDNF family: signaling, biological functions and therapeutic value. Nat Rev Neurosci 3: 383–394 [DOI] [PubMed] [Google Scholar]
- Airaksinen MS, Titievsky A, Saarma M (1999) GDNF family neurotrophic factor signaling: four masters, one servant? Mol Cell Neurosci 13: 313–325 [DOI] [PubMed] [Google Scholar]
- Baloh RH, Enomoto H, Johnson EM, Milbrandt J (2000) The GDNF family ligands and receptors—implications for neuronal development. Curr Neurobiol 10: 103–110 [DOI] [PubMed] [Google Scholar]
- Baloh RH, Tansey MG, Lampe PA, Fahner TJ, Enomoto H, Simburger KS, Leitner ML, Araki T, Johnson EM, Milbrandt J (1998) Artemin, a novel member of the GDNF ligand family, supports peripheral and central neurons and signal through the GFRα3–RET receptor complex. Neuron 21: 1291–1302 [DOI] [PubMed] [Google Scholar]
- Bellizzi JJ, Widom J, Kemp CW, Clardy J (1999) Producing selenomethionine-labeled proteins with a baculovirus expression vector system. Structure 7: 263–267 [DOI] [PubMed] [Google Scholar]
- Brünger AT, Adams PD, Clore M, DeLano WL, Gros P, Grosse-Kunstleve RW, Jiang J-S, Kuszewski J, Nilges M, Pannu NS, Read RJ, Rice LM, Simonson T, Warren GL (1998) Crystallography & NMR system: a new software suite for macromolecule structure determination. Acta Crystallogr D 54: 905–921 [DOI] [PubMed] [Google Scholar]
- Buj-Bello A, Adu J, Pinon L, Horton A, Thompson J, Rosenthal A, Chinchetru M, Buchman VL, Davies AM (1997) Neurturin responsiveness requires a GPI-linked receptor and the ret receptor tyrosine kinase. Nature 387: 721–724 [DOI] [PubMed] [Google Scholar]
- Cik M, Masure S, Lesage ASJ, Van der Linden I, Van Compel P, Pangalos MN, Gordon RD, Leysen JE (2000) Binding of GDNF and neurturin to human GDNF family receptor α 1 and 2. J Biol Chem 275: 27505–27512 [DOI] [PubMed] [Google Scholar]
- Eigenbrot C, Gerber N (1997) X-ray structure of glial cell-derived neurotrophic factor at 1.9 Å resolution and implications for receptor binding. Nat Struct Biol 4: 435–438 [DOI] [PubMed] [Google Scholar]
- Eketjäll S, Fainzilber M, Murray-Rust J, Ibáñez CF (1999) Distinct structural elements in GDNF mediate binding to GFRα1 and activation of the GFRα1–c-Ret receptor complex. EMBO J 18: 5901–5910 [DOI] [PMC free article] [PubMed] [Google Scholar]
- Enokido Y, de Sauvage F, Hongo JA, Ninkina N, Rosenthal A, Buchman VL, Davies AM (1998) GFRα4 and the tyrosine kinase Ret form a functional receptor complex for persephin. Curr Biol 8: 1019–1022 [DOI] [PubMed] [Google Scholar]
- Esnouf RM (1997) An extensively modified version of MolScript that includes greatly enhanced coloring capabilities. J Mol Graph Mod 15: 132–134 [DOI] [PubMed] [Google Scholar]
- Greenwald J, Fischer W, Vale WW, Choe S (1999) Three finger toxin fold for the extracellular ligand-binding domain of type II activin receptor serine kinase. Nat Struct Biol 6: 18–22 [DOI] [PubMed] [Google Scholar]
- Hart PJ, Deep S, Taylor AB, Shu Z, Hinck C, Hink AP (2002) Crystal structure of the human TβR2 ectodomain–TGF-β3 complex. Nat Struct Biol 9: 203–208 [DOI] [PubMed] [Google Scholar]
- Higgins D, Thompson J, Gibson T, Thompson JD, Higgins DG, Gibson TJ (1994) CLUSTALW: improving the sensitivity of progressive multiple sequence alignment through sequence weighting, position-specific gap penalties and weight matrix choice. Nucleic Acids Res 22: 4673–4680 [DOI] [PMC free article] [PubMed] [Google Scholar]
- Holm L, Sander C (1993) Protein structure comparison by alignment of distance matrices. J Mol Biol 223: 123–138 [DOI] [PubMed] [Google Scholar]
- Jing S, Wen D, Yu Y, Holst PL, Luo Y, Fang M, Tamir R, Antonio L, Hu Z, Cupples R, Louis JC, Hu S, Altrock BW, Fox GM (1996) GDNF-induced activation of the ret protein tyrosine kinase is mediated by GDNFR-α, a novel receptor for GDNF. Cell 85: 1113–1124 [DOI] [PubMed] [Google Scholar]
- Jones TA, Zou JY, Cowan SW, Kjeldgaard M (1991) Improved methods for building protein models in electron density maps and the location of errors in these models. Acta Crystallogr A 47: 110–119 [DOI] [PubMed] [Google Scholar]
- Keinänen K, Jouppila A, Kuusinen A (1998) Characterization of the kainate-binding domain of the glutamate receptor GluR-6 subunit. Biochem J 330: 1461–1467 [DOI] [PMC free article] [PubMed] [Google Scholar]
- Kirsch T, Sebald W, Dreyer MK (2000) Crystal structure of the BMP-2-BRIA ectodomain complex. Nat Struct Biol 7: 492–496 [DOI] [PubMed] [Google Scholar]
- Kjær S, Ibáñez CF (2003) Identification of a surface for binding to the GDNF–GFR alpha 1 complex in the first cadherin-like domain of RET. J Biol Chem 278: 47898–47904 [DOI] [PubMed] [Google Scholar]
- Kraulis PJ (1991) MolScript: a program to produce both detailed and schematic plots of protein structures. J Appl Crystallogr 24: 946–950 [Google Scholar]
- Laskowski RA, MacArthur MW, Moss DS, Thornton JM (1993) PROCHECK: a program to check the stereochemical quality of protein structures. J Appl Crystallogr 26: 283–291 [Google Scholar]
- Lin LF, Doherty DH, Lile JD, Bektesh S, Collins F (1993) GDNF: a glial cell line-derived neurotrophic factor for midbrain dopaminergic neurons. Science 260: 1130–1132 [DOI] [PubMed] [Google Scholar]
- Lindahl M, Poteryaev D, Liying Y, Arumäe U, Timmusk T, Bongarzone I, Aiello A, Pierotti MA, Airaksinen MS, Saarma M (2001) Human GFRα4 is the receptor for persephin, and is selectively expressed in normal and malignant thyroid medullary cells. J Biol Chem 276: 281–296 [DOI] [PubMed] [Google Scholar]
- Lindahl M, Timmusk T, Rossi J, Saarma M, Airaksinen MS (2000) Expression and alternative splicing of mouse Gfrα4 suggests roles in endocrine cell development. Mol Cell Neurosci 15: 522–533 [DOI] [PubMed] [Google Scholar]
- Merritt EA, Bacon DJ (1997) Raster3D: photorealistic molecular graphics. Methods Enzymol 277: 505–524 [DOI] [PubMed] [Google Scholar]
- Nicholls A, Sharp KA, Honig B (1991) Protein folding and association: insights from the interfacial and thermodynamic properties of hydrocarbons. Proteins Struct Funct Genet 11: 281–296 [DOI] [PubMed] [Google Scholar]
- Otwinowski Z, Minor W (1997) Processing X-ray diffraction data collected in oscillation mode. Methods Enzymol 276: 307–326 [DOI] [PubMed] [Google Scholar]
- Rickard SM, Mummery RS, Mulloy B, Rider CC (2003) The binding of human glial cell-line derived neurotrophic factor to heparin and heparan sulfate: importance of 2-O-sulfate groups and effect on its interaction with its receptor, GFRα1. Glycobiology 13: 419–426 [DOI] [PubMed] [Google Scholar]
- Scott R, Ibáñez CF (2001) Determinants of ligand binding specificity in the glial cell line-derived neurotrophic factor family receptor αs. J Biol Chem 276: 1450–1458 [DOI] [PubMed] [Google Scholar]
- Suvanto P (1997) Developmental roles of GDNF and characterization of its receptors, Academic doctoral dissertation, University of Helsinki, Finland [Google Scholar]
- Thompson TB, Woodruff TK, Jardetzky TS (2003) Structures of an ActRIIB:activin A complex reveal a novel binding mode for TGF-β ligand:receptor interactions. EMBO J 22: 1555–1566 [DOI] [PMC free article] [PubMed] [Google Scholar]
- Treanor JJ, Goodman L, de Sauvage F, Stone DM, Poulsen KT, Beck CD, Gray C, Armanini MP, Pollock RA, Hefti F, Phillips HS, Goddard A, Moore MW, Buj-Bello A, Davies AM, Asai N, Takahashi M, Vandlen R, Henderson CE, Rosenthal A (1996) Characterization of a multicomponent receptor for GDNF. Nature 382: 80–83 [DOI] [PubMed] [Google Scholar]
- Wang LM, Zhang Q, Zhang Q, Zhu W, He C, Lu CL, Ding DF, Chen ZY (2004) Identification of the key amino acids of glial cell line-derived neurotrophic factor family receptor alpha1 involved in its biological function. J Biol Chem 279: 109–116 [DOI] [PubMed] [Google Scholar]
Associated Data
This section collects any data citations, data availability statements, or supplementary materials included in this article.
Supplementary Materials
Supplementary Figure 1
Supplementary Figure 2
Supplementary Figure 3