

Abstract
Because of the increasing bacterial resistance of uropathogens against standard antibiotics, such as trimethoprim (TMP), older antimicrobial drugs, such as nitroxoline (NTX), should be reevaluated. This randomized crossover study investigated the urinary concentrations of parent drugs and their metabolites and their antibacterial activities (urinary inhibitory titers [UITs] and urinary bactericidal titers [UBTs]) against uropathogens at three different urinary pH values within 24 h in six healthy volunteers after a single oral dose of NTX at 250 mg versus TMP at 200 mg. In three additional volunteers, urinary bactericidal kinetics (UBK) were studied after oral administration of NTX at 250 mg three times a day. The mean urinary concentrations of NTX and NTX sulfate in 24 h were 0.012 to 0.507 mg/liter and 0.28 to 27.83 mg/liter, respectively. The mean urinary concentrations of TMP were 18.79 to 41.59 mg/liter. The antibacterial activity of NTX was higher in acidic urine than in alkaline urine, and that of TMP was higher in alkaline urine than in acidic urine. The UITs and UBTs of NTX were generally lower than those of TMP except for a TMP-resistant Escherichia coli strain, for which NTX showed higher UITs/UBTs than did TMP. UBK showed mainly bacteriostatic activity of NTX in urine. NTX exhibits mainly bacteriostatic activity and TMP also shows bactericidal activity in urine against susceptible strains. NTX is a more active antibacterial in acidic urine, and TMP is more active in alkaline urine. The cumulative effects of multiple doses or inhibition of bacterial adherence could not be evaluated. (This study has been registered at EudraCT under registration no. 2009-015631-32.)
INTRODUCTION
Urinary tract infection (UTI) is one of the most common reasons for medical consultation and for prescription of antibiotics in the community. Uncomplicated UTIs in women are caused predominantly by Escherichia coli but also by Proteus mirabilis and occasionally Klebsiella spp., other Enterobacteriaceae spp., and Staphylococcus saprophyticus (<5% each) (1–3). For a long time, the gold standard of treatment for acute uncomplicated cystitis was trimethoprim (TMP) in combination with sulfamethoxazole (SMX) or TMP alone (4), at a dosage of 200 mg twice a day, as has been evaluated in various clinical trials (5–8). Recent studies with patients with uncomplicated cystitis, however, showed a general increase in TMP and fluoroquinolone resistance (3, 9). Current guidelines for the treatment of uncomplicated UTI no longer recommend TMP or TMP-SMX as first-line agents if the regional resistance rate against TMP is higher than 20% (10–12). In the past, fluoroquinolones have also been recommended as first-line treatment for uncomplicated cystitis (4). Appreciation of possible collateral damage by fluoroquinolones and also a notable increase of fluoroquinolone resistance worldwide have led fluoroquinolones to no longer be considered first-line antibiotics for the treatment of uncomplicated UTI in most international guidelines (3, 9, 11, 13). Alternatives, including older antimicrobial drugs, for the treatment of UTI therefore need to be reevaluated.
Nitroxoline (NTX), a 5-nitro-8-hydroxy-quinoline, is used for treatment of acute and recurrent/chronic UTIs (14–17). Its antimicrobial efficacy is based on its ability to chelate divalent cations (18). Although it has been in clinical use for many years, no increase in resistance has been observed for Escherichia coli, the most frequent uropathogen (19). Subinhibitory nitroxoline concentrations inhibit the bacterial adhesion of E. coli to human bladder epithelial cells through reduction of the number of adhesins (20) and reduce biofilm mass synthesis and viable cell counts of Pseudomonas aeruginosa (21). The aim of this ex vivo study was to compare concentrations and antibacterial activity in the urine of healthy volunteers at different pH values, which may be encountered in UTIs, after a single oral administration of 250 mg NTX versus 200 mg TMP.
(This study was presented in part at the 51st Interscience Conference on Antimicrobial Agents and Chemotherapy, Chicago, IL, 17 to 20 September 2011 [22].)
MATERIALS AND METHODS
Study design and subjects.
The study was approved by the appropriate ethics committees (Ethikkommission Justus Liebig University [Giessen, Germany] for evaluation of urinary inhibitory titers [UITs] and urinary bactericidal titers [UBTs] and Ethikkommission München [Munich, Germany] for evaluation of urinary bactericidal kinetics [UBK]) and registered. Regulatory approval was received from the German Drug Agency (approval no. 4035748).
Evaluations of urinary inhibitory titers (UITs) and urinary bactericidal titers (UBT) were performed with six volunteers and evaluation of urinary bactericidal kinetics (UBK) with three volunteers, who were shown to be healthy by medical history, physical examination, hematological analysis, serum chemistry, and urinalysis results. The absence of antibacterial activity in urine was shown by the lack of inhibition of Bacillus subtilis.
Drug administration.
All volunteers gave their written informed consent for participation in the study. In December 2009, each of six volunteers received one oral dose of 250 mg NTX (batch 2233500; Rosen Pharma GmbH, St. Ingbert, Germany) or 200 mg TMP (batch R030901.1; Infectopharm Arzneimittel und Consilium GmbH, Heppenheim, Germany), in a crossover design, to investigate UITs and UBTs. For evaluation of UBK, each of three volunteers received 250 mg NTX three times a day (t.i.d.) for 3 days. A standardized diet was provided, and alcoholic beverages and acidic drinks (e.g., grapefruit or orange juice) were not allowed during the study. The volunteers were asked to drink sufficient amounts of water to ensure adequate urine production throughout the collection periods. A physical examination and laboratory tests were performed before and after the study. Adverse events were recorded throughout the study period.
Sample collection.
For UIT/UBT evaluation, all urine voided overnight was collected prior to drug administration (to confirm that the urine was free of antibiotics) and for the following time periods after oral administration of the antimicrobials (NTX versus TMP): 0 to 4, 4 to 8, 8 to 12, and 12 to 24 h. For UBK evaluation, urine samples (50 ml) were collected on the morning before and at two time periods after the oral administration of NTX (250 mg t.i.d.), i.e., (i) on the third day, 0 to 2 h after the second dose, and (ii) on the fourth day, 4 to 6 h after the first dose. The volumes and pH of all urine samples were recorded, and all samples were immediately stored at −80°C.
Test organisms.
A reference strain, i.e., E. coli ATCC 25922, and five clinical uropathogens, i.e., E. coli BN, E. coli 1135121, Klebsiella pneumoniae 595, K. pneumoniae 1082, P. mirabilis 1057, and S. saprophyticus Ho94, all from patients with symptomatic lower UTI, were selected for testing.
Determination of MICs.
NTX MICs for the strains tested were determined by broth microdilution assays according to the CLSI guidelines (23) and TMP MICs by Etest according to the manufacturer's instructions, using Mueller-Hinton agar (Oxoid, Basingstoke, United Kingdom). MIC was defined as the lowest concentration inhibiting visible growth after incubation at 37°C for 18 h in ambient air (23). The MICs of TMP (23) and NTX (24) for Enterobacteriaceae regarded as susceptible are ≤2 and ≤8 mg/liter and as resistant are ≥4 and ≥16 mg/liter, respectively.
Determination of UIT, UBT, and UBK.
For sterility, all urine samples were filtered before analysis (January to April 2010). The following filters were used, depending on the amount of urine to be filtered: Steriflip vacuum filter, 0.2 μm (up to 50 ml urine) (Millipore no. 11CGP00525, catalog no. X348.1; Carl Roth, Karlsruhe, Germany), or Rotilabo syringe sterile filter, 0.22 μm, polyvinylidene difluoride (catalog no. P666.1; Carl Roth, Karlsruhe, Germany). For the determination of UIT and UBT, 2-fold serial dilutions of the urine samples collected in each time interval were prepared with antibiotic-free urine collected from the healthy subjects prior to drug administration (dilution range, 1:1 [undiluted] and 1:2 to 1:256). A microdilution test was used to determine the UITs and UBTs. Each well of the microplates contained 100 μl of the prepared urine dilution. Bacterial strains were then added to the wells of the microplates using a multipoint inoculator (10 μl). The final inocula, which were confirmed by actual counting, ranged from 4.5 ×10⁶ to 8 ×10⁶ CFU/ml. The plates were then incubated at 37°C for 18 ± 0.5 h in ambient air. The UIT was defined as the highest dilution of urine with antibiotic-free urine that still inhibited visible bacterial growth, representing bacteriostatic activity.
UBTs were determined in a second step after transfer of 10 μl of the subcultured urine onto Isosensitest agar supplemented with 5% sheep blood (Oxoid, Wesel, Germany). The plates were incubated at 37°C for 20 to 24 h before the number of colonies was counted. The UBT was defined as the highest dilution of urine with antibiotic-free urine that still exhibited bactericidal activity, described as >99.9% (>3 log10) reduction of the initial counts. Each experiment was performed in native urine and in urine with pH values adjusted to 5.5 and 8.0 with hydrochloric acid and sodium hydroxide, respectively.
For UBK, pooled predosing urine and individual urine samples collected from the three volunteers in the two time periods after dosing of NTX at 250 mg t.i.d. were inoculated with one of the three strains tested, to achieve a starting colony count of about 106 CFU/ml. The inoculated urine samples were incubated at 37°C in ambient air, and bacterial counts were determined after 2, 4, 6, 8, and 24 h. For bacterial counting, the antibiotic needed to be removed from the urine, as follows. Appropriately diluted urine was placed on a membrane filter (Minisart NML 26 mm, 0.2 μm, Sartorius no. 16534Q; Schubert Medizinprodukte, Wackersdorf, Germany), and the filter was washed three times with 20 ml sterile 0.9% NaCl. Then the filter was placed on Columbia agar (catalog no. 110455; Merck Chemicals, Darmstadt, Germany) supplemented with 5% blood and was incubated at 37°C for 18 to 20 h in ambient air, and the CFU were counted.
Urinary concentrations and metabolite analysis.
The analysis was performed in January 2013. Stock solutions (1 mg/ml in dimethyl sulfoxide [DMSO]) of nitroxoline were diluted in acetonitrile to a final concentration of 100 μg/ml (start solution). Individual stock solutions were used for preparation of calibration standards and quality control samples. Additional working solutions were prepared by dilution of the start solution in acetonitrile. Calibration standard solutions in the range of 0.8 to 400 ng/ml were prepared by spiking 200 μl of drug-free blank urine with 24 μl working solution. The calibration standards and the quality control samples (analytical solutions of 2.4, 60, and 240 ng/ml) were made in duplicate.
A volume of 400 μl acetonitrile containing the internal standard (100 ng/ml griseofulvin) was added to 200-μl urine samples, calibration solutions, and QC samples. Samples were shaken vigorously and centrifuged at 6,000 × g for 10 min at 20°C. The particle-free supernatants were diluted 1:1 with water. Aliquots were transferred to 200-μl sample vials and subsequently subjected to liquid chromatography-mass spectrometry (LC-MS).
Liquid chromatography.
The high-performance liquid chromatography (HPLC) pump flow rate was set to 600 μl/min, and the compounds were separated on an Accucore RP-MS (2.6 μm, 50 by 2.1 mm; Thermo Fisher Scientific) analytical column with a precolumn (Accucore RP-MS, 2.1 mm). Gradient elution with water–0.2% heptafluorobutyric acid (HFBA) as the aqueous phase (solution A) and acetonitrile–0.2% HFBA as the organic phase (solution B) was used, as follows: solution B at 5%, 0 to 0.1 min; 95%, 0.8 to 1.7 min; 5%, 1.8 to 3.0 min.
Mass spectrometry.
Mass spectrometry for both test item quantification and metabolite analysis was performed on a Q-Exactive mass spectrometer (Orbitrap technology with mass accuracy) equipped with an HESI-2 interface monitoring the accurate mass (±5 mDa) of the corresponding [M+H]+ ion at a resolution of 17,500. As the lock mass for internal mass calibration, the [M+H]+ ion of diisooctyl phthalate (m/z 391.28429), which is ubiquitously present in the solvent system, was used.
Statistical analyses.
UIT and UBT data were represented by the reciprocals of the factor of the highest dilution showing bacteriostatic or bactericidal activity. The value 0 was used when no urinary inhibitory (or bactericidal) activity could be demonstrated, and the value 1 was used when urinary inhibitory (or bactericidal) activity could be demonstrated only in undiluted urine. The area under the 24-h UIT-time curve (AUIT24) and the area under the 24-h UBT-time curve (AUBT24) were calculated as the sums of the products of each UIT or UBT in the sampling periods and the respective time periods (in hours) for each test organism and for each drug. AUIT24 and AUBT24 data were compared between NTX and TMP at the corresponding pH values with the Mann-Whitney U test and the median test (25). Due to the sample size of 6, the smallest calculable P value was 0.1. If P = 0.1was reached, then an indication of a difference between NTX and TMP regarding AUIT24 or AUBT24 values was assumed. Global comparisons of the different pH values with the Friedman test and subsequent pairwise comparisons were performed in an exploratory data analysis. For statistical calculations, SAS 9.2 (SAS Institute, Cary, NC) and IBM SPSS Statistics 19 were used. UBK data for NTX are presented descriptively.
RESULTS
Volunteers.
The volunteers were three Caucasian men and three Caucasian women for UIT and UBT investigations and one Caucasian man and two Caucasian women for UBK investigations. Volunteers participating in the UIT and UBT investigations had a mean age of 25 years (median, 24 years [range, 22 to 30 years]) and a mean body mass index of 22.2 kg/m2 (median, 22.6 kg/m2 [range, 17.5 to 27.1 kg/m2]). The three additional volunteers participating in the UBK investigations were 37, 40, and 43 years of age and had body mass index values of 23, 24, and 25 kg/m2, respectively.
Safety and laboratory test results.
NTX and TMP were well tolerated by all volunteers. No serious adverse events occurred during the study. There were no clinically relevant changes in the laboratory test results for blood and urine.
Urinary pH and volumes.
For the UIT/UBT study, the mean values, medians, and ranges of urinary pH values and volumes following NTX or TMP administration are given in Table 1. Mean urinary pH values were between 6.3 and 7.3 and were lowest in the collection periods 12 to 24 h after dosing (i.e., during the evening and night of the study). In most collection periods, the urinary pH was slightly acidic. In the collection period of 4 to 8 h, the pH was significantly lower in the NTX group than in the TMP group. The mean hourly urine volumes were highest at 220 ml/h for NTX and 269 ml/h for TMP in the collection periods of 0 to 4 h. For the UBK study, the pH values are given in Table 2.
TABLE 1.
Urinary pH values and volumes of urine from six volunteers after single oral administration of nitroxoline or trimethoprim in the UIT/UBT study
| Collection period | Urinary pH |
Volume (ml) |
||
|---|---|---|---|---|
| Mean ± SD | Median (range) | Mean ± SD | Median (range) | |
| Before dosing | 6.5 ± 0.8 | 6.2 (5.8–7.9) | 1,039 ± 281 | 1,029 (702–1,409) |
| After nitroxoline (250 mg) | ||||
| 0–4 h | 6.9 ± 0.6 | 6.9 (6.3–8.0) | 878 ± 375 | 983 (346–1,362) |
| 4–8 h | 6.4 ± 0.6a | 6.7 (5.6–7.0) | 639 ± 276 | 593 (252–1,002) |
| 8–12 h | 6.8 ± 0.4 | 6.8 (6.3–7.5) | 783 ± 368 | 804 (322–1,302) |
| 12–24 h | 6.3 ± 0.5 | 6.5 (5.5–6.7) | 1,072 ± 595 | 924 (579–2,210) |
| After trimethoprim (200 mg) | ||||
| 0–4 h | 7.3 ± 0.2 | 7.3 (6.9–7.6) | 1,076 ± 401 | 1,165 (327–1,452) |
| 4–8 h | 7.2 ± 0.4a | 7.3 (6.7–7.5) | 711 ± 387 | 630 (355–1,413) |
| 8–12 h | 6.8 ± 0.3 | 6.9 (6.3–7.2) | 924 ± 300 | 900 (466–1,259) |
| 12–24 h | 6.3 ± 0.5 | 6.2 (5.7–7.1) | 1,207 ± 688 | 1,108 (328–2,277) |
Statistically significant (P < 0.05).
TABLE 2.
Urinary pH values for three volunteers after oral administration of 250 mg nitroxoline t.i.d. in the UBK study
| Time | Urinary pH for subject: |
||
|---|---|---|---|
| A | B | C | |
| Before dosing (0 h) | 5.49 | 6.11 | 5.39 |
| 0–2 h after 8th dose | 6.73 | 7.58 | 5.20 |
| 4–6 h after 10th dose | 5.20 | 5.30 | 6.84 |
MICs.
The MICs of NTX and TMP are shown in Table 3. The MICs of NTX ranged between 2 and 8 mg/liter and were in the susceptible range. The MICs of TMP were 0.25 to 1 mg/liter for the susceptible strains and >32 mg/liter for the resistant E. coli strain 1135121.
TABLE 3.
MICs of nitroxoline and trimethoprim for the test strains
| Bacterial strain | MIC (mg/liter) of: |
|
|---|---|---|
| Nitroxoline | Trimethoprim | |
| E. coli ATCC 25922a | 2 | 0.25 |
| E. coli BNb | 4 | 0.25 |
| E. coli 1135121b | 2 | >32 |
| K. pneumoniae 595c | 4 | NA |
| K. pneumoniae 1082b | 4 | 1 |
| Proteus mirabilis 1057b | 8 | 1 |
| S. saprophyticus Ho94a | 8 | 1 |
Evaluation of urinary inhibitory titers (UITs), urinary bactericidal titers (UBTs), and urinary bactericidal kinetics (UBK).
Evaluation of UIT and UBT.
Evaluation of UBK only. NA, not applicable.
UIT, AUIT24, UBT, and AUBT24.
The UITs and UBTs, as well as the areas under the 24-h UIT-time and UBT-time curves (AUIT24 and AUBT24, respectively) of NTX and TMP for the test organisms in native urine and in urine adjusted to pH 5.5 and pH 8.0 are given in Tables 4 and 5. The median AUIT24 value of NTX at pH 5.5 for E. coli 1135121 was higher than that of TMP. The median AUIT24 values of TMP at pH 5.5 and pH 8.0 for E. coli ATCC 25922, K. pneumoniae, and S. saprophyticus were higher than those of NTX. At all three pH values, the median AUIT24 values of TMP for E. coli BN were higher than those of NTX (each with P = 0.1 with the Mann-Whitney U test and P = 0.1 with the median test). Global comparisons of the media at the three pH values after administration of NTX indicated differences for E. coli ATCC 25922, E. coli BN, E. coli 1135121, K. pneumoniae, and S. saprophyticus. The median AUIT24 values of NTX were each higher at pH 5.5 than at pH 8.0. For TMP, global testing indicated differences for E. coli BN, whereas median AUIT24 values were higher at pH 8.0 than at pH 5.5.
TABLE 4.
Reciprocal UITs and areas under the 24-h UIT-time curve for nitroxoline and trimethoprim in the 6 volunteers tested
| Drug, urine type, and strain | UIT (median [range]) for the indicated collection period (h) |
AUIT24 | |||
|---|---|---|---|---|---|
| 0–4 | 4–8 | 8–12 | 12–24 | ||
| Nitroxoline | |||||
| Native urine | |||||
| Escherichia coli ATCC 25922 | 1 (0–2) | 0.5 (0–2) | 0 (0–1) | 0 (0–1) | 8 (0–24) |
| E. coli BN | 1 (0–2) | 0 (0–1) | 0 (0–0) | 0 (0–0) | 4 (0–8)a |
| E. coli 1135121 | 0 (0–1) | 0 (0–1) | 0 (0–0) | 0 (0–0) | 2 (0–4) |
| Klebsiella pneumoniae 1082 | 0.5 (0–1) | 0 (0–1) | 0 (0–0) | 0 (0–0) | 4 (0–4) |
| Proteus mirabilis 1057 | 0 (0–1) | 0 (0–0) | 0 (0–0) | 0 (0–0) | 0 (0–4) |
| Staphylococcus saprophyticus Ho94 | 0 (0–2) | 0 (0–1) | 0 (0–0) | 0 (0–0) | 0 (0–8)b |
| Urine at pH 5.5 | |||||
| E. coli ATCC 25922 | 3 (1–8) | 1 (0–8) | 0.5 (0–1) | 0 (0–0) | 18 (4–68)a,b |
| E. coli BN | 2 (0–2) | 1 (0–2) | 0 (0–1) | 0 (0–0) | 12 (0–20)a,b |
| E. coli 1135121 | 1 (0–2) | 0 (0–2) | 0 (0–1) | 0 (0–0) | 8 (0–16)a,b |
| K. pneumoniae 1082 | 1 (1–2) | 0.5 (0–1) | 0 (0–1) | 0 (0–0) | 8 (4–12)a,b |
| P. mirabilis 1057 | 0 (0–1) | 0 (0–0) | 0 (0–0) | 0 (0–0) | 0 (0–4) |
| S. saprophyticus Ho94 | 2 (1–4) | 1 (0–4) | 0 (0–1) | 0 (0–0) | 12 (4–36)a,b |
| Urine at pH 8.0 | |||||
| E. coli ATCC 25922 | 0.5 (0–2) | 0 (0–1) | 0 (0–0) | 0 (0–0) | 2 (0–12)a,b |
| E. coli BN | 0 (0–1) | 0 (0–0) | 0 (0–0) | 0 (0–0) | 0 (0–4)a,b |
| E. coli 1135121 | 0 (0–1) | 0 (0–0) | 0 (0–0) | 0 (0–0) | 0 (0–4)b |
| K. pneumoniae 1082 | 0 (0–1) | 0 (0–0) | 0 (0–0) | 0 (0–0) | 0 (0–4)a,b |
| P. mirabilis 1057 | 0 (0–0) | 0 (0–0) | 0 (0–0) | 0 (0–0) | 0 (0–0) |
| S. saprophyticus Ho94 | 0 (0–1) | 0 (0–0) | 0 (0–0) | 0 (0–0) | 0 (0–4)a,b |
| Trimethoprim | |||||
| Native urine | |||||
| E. coli ATCC 25922 | 64 (32–256) | 160 (32–256) | 48 (16–256) | 128 (128–128) | 2,944 (2,176–3,840) |
| E. coli BN | 64 (32–256) | 256 (32–256) | 48 (16–256) | 80 (32–128) | 2,368 (768–4,608)a |
| E. coli 1135121 | 0 (0–0) | 0 (0–0) | 0 (0–0) | 0 (0–0) | 0 (0–0) |
| K. pneumoniae 1082 | 8 (4–16) | 8 (2–16) | 8 (2–16) | 8 (4–64) | 208 (80–544) |
| P. mirabilis 1057 | 2 (2–4) | 2 (1–4) | 2 (2–4) | 2 (2–4) | 56 (44–88) |
| S. saprophyticus Ho94 | 8 (4–64) | 8 (4–32) | 8 (4–16) | 8 (4–32) | 200 (112–832) |
| Urine at pH 5.5 | |||||
| E. coli ATCC 25922 | 32 (16–256) | 32 (16–256) | 24 (8–256) | 128 (32–128) | 1,856 (608–4,608)a |
| E. coli BN | 24 (8–256) | 48 (8–256) | 16 (8–64) | 96 (16–128) | 1,840 (512–3,072)a,b |
| E. coli 1135121 | 0 (0–0) | 0 (0–0) | 0 (0–0) | 0 (0–0) | 0 (0–0)a |
| K. pneumoniae 1082 | 4 (2–8) | 4 (1–8) | 2.5 (1–4) | 8 (2–16) | 124 (72–248)a |
| P. mirabilis 1057 | 4 (2–4) | 4 (2–4) | 2 (1–4) | 4 (4–4) | 88 (68–96) |
| S. saprophyticus Ho94 | 4 (1–16) | 4 (1–4) | 1 (1–4) | 4 (2–16) | 88 (52–288)a |
| Urine at pH 8.0 | |||||
| E. coli ATCC 25922 | 256 (128–256) | 256 (128–256) | 64 (64–256) | 128 (128–128) | 3,840 (2,816–4,608)a |
| E. coli BN | 160 (64–256) | 256 (16–256) | 160 (32–256) | 128 (32–128) | 3,840 (832–4,608)a,b |
| E. coli 1135121 | 0 (0–0) | 0 (0–0) | 0 (0–0) | 0 (0–0) | 0 (0–0) |
| K. pneumoniae 1082 | 16 (4–64) | 16 (2–32) | 8 (2–16) | 16 (4–128) | 384 (80–1,728)a |
| P. mirabilis 1057 | 4 (4–64) | 10 (4–16) | 4 (2–8) | 6 (4–16) | 144 (88–544) |
| S. saprophyticus Ho94 | 16 (8–64) | 24 (8–64) | 16 (8–16) | 32 (8–64) | 640 (224–992)a |
Indication of difference (P = 0.1 with the Mann-Whitney U test and P = 0.1 with the median test) for nitroxoline versus trimethoprim in urine at the same pH.
Indication of difference for native pH versus pH 8.0 versus pH 5.5 for nitroxoline or trimethoprim.
TABLE 5.
Reciprocal UBTs and areas under the 24-h UBT-time curve for nitroxoline and trimethoprim in the 6 volunteers tested
| Drug, urine type, and strain | UBT (median [range]) for the indicated collection period (h) |
AUBT24 | |||
|---|---|---|---|---|---|
| 0–4 | 4–8 | 8–12 | 12–24 | ||
| Nitroxoline | |||||
| Native urine | |||||
| Escherichia coli ATCC 25922 | 0 (0–2) | 0 (0–0) | 0 (0–1) | 0 (0–0) | 0 (0–12)a |
| E. coli BN | 0.5 (0–8) | 0 (0–0) | 0 (0–2) | 0 (0–2) | 2 (0–36)a |
| E. coli 1135121 | 0 (0–0) | 0 (0–4) | 0 (0–0) | 0 (0–0) | 0 (0–16) |
| Klebsiella pneumoniae 1082 | 0 (0–0) | 0 (0–0) | 0 (0–0) | 0 (0–0) | 0 (0–0)a |
| Proteus mirabilis 1057 | 0 (0–0) | 0 (0–0) | 0 (0–0) | 0 (0–0) | 0 (0–0)a |
| Staphylococcus saprophyticus Ho94 | 0 (0–0) | 0 (0–0) | 0 (0–0) | 0 (0–0) | 0 (0–0)a |
| Urine at pH 5.5 | |||||
| E. coli ATCC 25922 | 1 (1–2) | 0 (0–1) | 0 (0–0) | 0 (0–0) | 4 (4–12)a,b |
| E. coli BN | 1 (0–2) | 0 (0–2) | 0 (0–1) | 0 (0–0) | 4 (0–16)a |
| E. coli 1135121 | 0 (0–1) | 0 (0–1) | 0 (0–0) | 0 (0–0) | 0 (0–8) |
| K. pneumoniae 1082 | 0 (0–2) | 0 (0–0) | 0 (0–0) | 0 (0–0) | 0 (0–8)a |
| P. mirabilis 1057 | 0 (0–0) | 0 (0–0) | 0 (0–0) | 0 (0–0) | 0 (0–0)a |
| S. saprophyticus Ho94 | 0 (0–2) | 0 (0–0) | 0 (0–0) | 0 (0–0) | 0 (0–8)a |
| Urine at pH 8.0 | |||||
| E. coli ATCC 25922 | 0 (0–0) | 0 (0–0) | 0 (0–0) | 0 (0–0) | 0 (0–0)ac |
| E. coli BN | 0 (0–1) | 0 (0–0) | 0 (0–0) | 0 (0–0) | 0 (0–4)a |
| E. coli 1135121 | 0 (0–0) | 0 (0–0) | 0 (0–0) | 0 (0–0) | 0 (0–0) |
| K. pneumoniae 1082 | 0 (0–0) | 0 (0–0) | 0 (0–0) | 0 (0–0) | 0 (0–0)a |
| P. mirabilis 1057 | 0 (0–0) | 0 (0–0) | 0 (0–0) | 0 (0–0) | 0 (0–0)a |
| S. saprophyticus Ho94 | 0 (0–0) | 0 (0–0) | 0 (0–0) | 0 (0–0) | 0 (0–0)a |
| Trimethoprim | |||||
| Native urine | |||||
| E. coli ATCC 25922 | 96 (32–128) | 96 (32–128) | 32 (16–128) | 64 (64–64) | 1,664 (1,280–2,304)a |
| E. coli BN | 48 (32–128) | 128 (32–128) | 48 (16–64) | 64 (32–64) | 1,600 (704–2,048)a |
| E. coli 1135121 | 0 (0–0) | 0 (0–0) | 0 (0–0) | 0 (0–0) | 0 (0–0) |
| K. pneumoniae 1082 | 12 (4–64) | 12 (2–16) | 8 (2–16) | 8 (0–64) | 248 (80–928)a |
| P. mirabilis 1057 | 3 (0–16) | 3 (0–16) | 2 (0–16) | 2 (1–64) | 54 (12–912)a |
| S. saprophyticus Ho94 | 8 (2–32) | 8 (4–16) | 6 (2–16) | 8 (2–32) | 192 (72–640)a |
| Urine at pH 5.5 | |||||
| E. coli ATCC 25922 | 32 (16–128) | 48 (16–64) | 24 (8–128) | 64 (32–64) | 1,088 (736–2,048)a,b |
| E. coli BN | 24 (8–64) | 24 (8–64) | 16 (8–64) | 48 (16–64) | 880 (512–1,408)a,b |
| E. coli 1135121 | 0 (0–1) | 0 (0–0) | 0 (0–0) | 0 (0–0) | 0 (0–4) |
| K. pneumoniae 1082 | 4 (1–8) | 4 (1–8) | 2 (1–4) | 6 (2–16) | 112 (64–240)a |
| P. mirabilis 1057 | 2 (0–16) | 2.5 (0–8) | 2 (0–8) | 2 (1–32) | 48 (12–464)a,b |
| S. saprophyticus Ho94 | 2 (1–16) | 2 (1–4) | 2 (1–4) | 4 (2–16) | 74 (40–288)a,b |
| Urine at pH 8.0 | |||||
| E. coli ATCC 25922 | 128 (64–128) | 128 (64–128) | 64 (64–128) | 64 (64–64) | 2,048 (1,792–2,048)a,b |
| E. coli BN | 96 (32–256) | 128 (16–256) | 64 (32–256) | 64 (32–64) | 1,920 (704–3,840)a,b |
| E. coli 1135121 | 0 (0–0) | 0 (0–0) | 0 (0–0) | 0 (0–1) | 0 (0–12) |
| K. pneumoniae 1082 | 12 (4–64) | 24 (2–32) | 8 (2–16) | 8 (1–64) | 248 (56–1,024)a |
| P. mirabilis 1057 | 3 (0–32) | 5 (0–16) | 2 (0–16) | 3 (1–64) | 74 (12–928)a,b |
| S. saprophyticus Ho94 | 16 (8–32) | 24 (8–32) | 12 (8–16) | 32 (8–64) | 592 (224–960)a,b |
Indication of difference (P = 0.1 with the Mann-Whitney U test and P = 0.1 with the median test) for nitroxoline versus trimethoprim in urine at the same pH.
Indication of difference for native pH versus pH 8.0 versus pH 5.5 for nitroxoline or trimethoprim.
At all three urinary pH values, median AUBT24 values for TMP were higher than those for NTX for all tested strains except for the resistant E. coli strain 1135121 (each with P = 0.1 with the Mann-Whitney U test and P = 0.1 with the median test). Global comparisons of the media at the three pH values after administration of NTX indicated differences for E. coli ATCC 25922. The median AUBT24 values were higher at pH 5.5 than at pH 8.0. For TMP, global testing indicated differences for E. coli ATCC 25922, E. coli BN, P. mirabilis, and S. saprophyticus, whereas AUBT24 values were each higher at pH 8.0 than at pH 5.5.
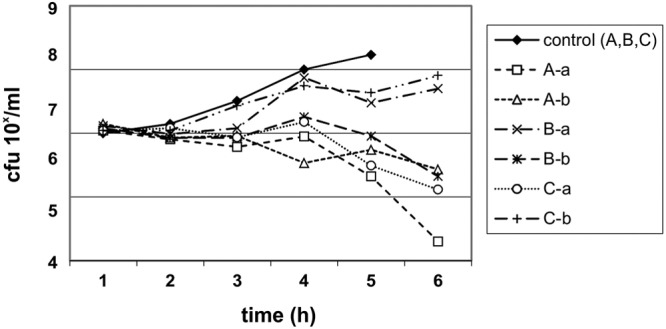
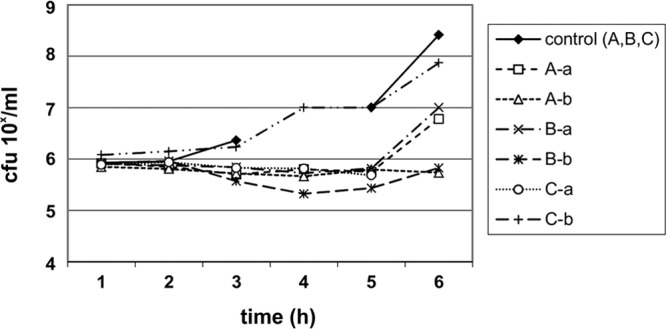
UBK.
The UBK for NTX are shown in Fig. 1 to Fig. 3. The UBK showed that NTX has mainly bacteriostatic urinary activity.
FIG 1.
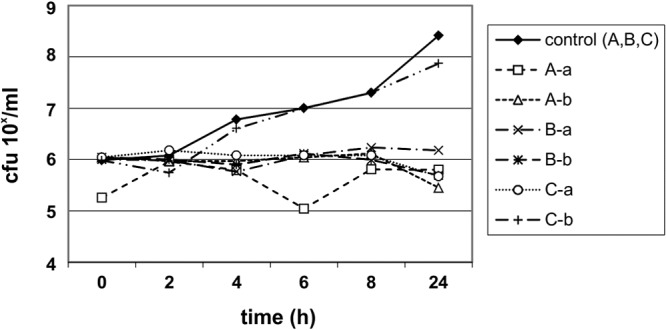
Urinary bactericidal kinetics for E. coli ATCC 25922 in volunteers A, B, and C, using urine samples collected 0 to 2 h after the eighth dose (a) and 4 to 6 h after the 10th dose (b) of nitroxoline at 250 mg t.i.d.
FIG 3.
Urinary bactericidal kinetics for S. saprophyticus Ho94 in volunteers A, B, and C, using urine samples collected 0 to 2 h after the eighth dose (a) and 4 to 6 h after the 10th dose (b) of nitroxoline at 250 mg t.i.d.
FIG 2.
Urinary bactericidal kinetics for K. pneumoniae 595 in volunteers A, B, and C, using urine samples collected 0 to 2 h after the eighth dose (a) and 4 to 6 h after the 10th dose (b) of nitroxoline at 250 mg t.i.d.
Urinary concentrations and excretion of nitroxoline and metabolite analysis.
The mean urinary concentrations of NTX and NTX sulfate in the collection periods of 0 to 4, 4 to 8, 8 to 12, and 12 to 24 h were 0.507 and 27.83, 0.200 and 8.42, 0.028 and 1.43, and 0.012 and 0.28 mg/liter, respectively (Table 6). The metabolism of NTX is shown in Fig. 4. In the urinary metabolite analysis, the mean relative signal area for the parent component NTX accounted for about 1.0% and those for the metabolites O (M1), O+CH2 (M2), C2H2O (acetyl) (M3), C3H5NOS (cysteine) (M4), SO3 (NTX sulfate) (M5), O+SO3 (M6), C6H8O6 (NTX glucuronide) (M7), and O+C6H8O6 (M8) accounted for 3.4%, 0.03%, 0.1%, 0.1%, 38.4%, 0.8%, 55.7%, and 0.5%, respectively (Table 7). These calculations are based on qualitative data and do not directly correlate with absolute (quantitative) metabolite concentrations. Only for the parent compound NTX and for NTX sulfate was enough reference material available for calibration. The mean total urinary excretion of NTX within 24 h was about 0.5 mg, corresponding to 0.2% of the oral dose administered (250 mg), and that of NTX sulfate (M5) was about 30 mg, corresponding to about 12% of the oral dose administered. Unfortunately, the total urinary excretion of the glucuronide metabolite could not be calculated, for the reasons mentioned earlier, but excretion can be expected to far exceed that of the parent drug and the sulfate metabolite.
TABLE 6.
Urinary concentrations and excretion levels of nitroxoline and nitroxoline sulfate in 6 volunteers
| Collection time (h) | Urinary nitroxolinea |
Urinary nitroxoline sulfate |
||||||||||
|---|---|---|---|---|---|---|---|---|---|---|---|---|
| Concentration |
Excretion levelb |
Concentration |
Excretion levelc |
|||||||||
| Mean ± SD (mg/liter) | CV (%) | Median (range) (mg/liter) | Mean ± SD (mg) | CV (%) | Median (range) (mg) | Mean ± SD (mg/liter) | CV (%) | Median (range) (mg/liter) | Mean ± SD (mg) | CV (%) | Median (range) (mg) | |
| 0–4 | 0.507 ± 0.369 | 72.8 | 0.409 (0.246–1.242) | 0.375 ± 0.149 | 39.7 | 0.362 (0.156–0.652) | 27.83 ± 7.38 | 26.5 | 24.10 (21.54–39.65) | 23.10 ± 7.97 | 34.5 | 24.35 (12.24–34.62) |
| 4–8 | 0.200 ± 0.257 | 128.7 | 0.097 (0.032–1.715) | 0.084 ± 0.052 | 61.9 | 0.075 (0.032–0.180) | 8.42 ± 4.62 | 54.8 | 7.18 (4.34–16.38) | 5.56 ± 4.37 | 78.6 | 3.80 (2.00–14.84) |
| 8–12 | 0.028 ± 0.021 | 73.0 | 0.020 (0.011–0.063) | 0.020 ± 0.015 | 75.0 | 0.014 (0.003–0.046) | 1.43 ± 0.51 | 35.3 | 1.49 (0.77–1.97) | 0.21 ± 0.12 | 57.1 | 0.20 (0.06–0.37) |
| 12–24 | 0.012 ± 0.010 | 81.1 | 0.009 (0.005–0.031) | 0.035 ± 0.038 | 108.6 | 0.014 (0.007–0.111) | 0.28 ± 0.01 | 46.8 | 0.23 (0.17–0.51) | 0.29 ± 0.16 | 55.1 | 0.27 (0.12–0.56) |
| 0–24 (total) | 0.514 ± 0.103 | 20.0 | 0.502 (0.368–0.714) | 29.17 ± 10.24 | 35.1 | 31.93 (15.09–40.66) | ||||||
CV, coefficient of variation.
Percentage of dose: mean ± SD, 0.206% ± 0.041%; median, 0.201%; range, 0.147% to 0.286%.
Percentage of dose: mean ± SD, 11.67% ± 4.10%; median, 12.77%; range, 6.04% to 16.26%.
FIG 4.
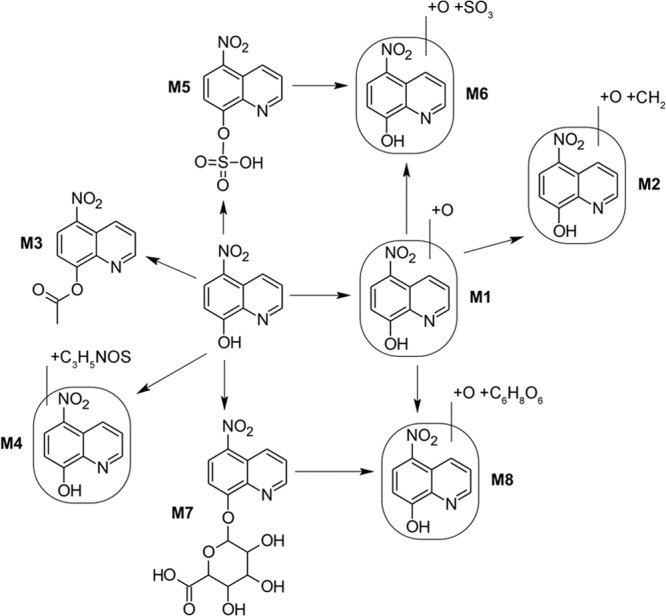
Metabolism of nitroxoline in urine.
TABLE 7.
Metabolite analysis of nitroxoline in the urine of 6 volunteers at 0 to 24 h
| Metabolitea | Metabolite reaction | Relative area (%) |
|---|---|---|
| Nitroxoline | NAb | 1.0 |
| M1 | +O | 3.4 |
| M2 | +O+CH2 | 0.03 |
| M3 | +C2H2O (acetyl) | 0.1 |
| M4 | +C3H5NOS (cysteine) | 0.1 |
| M5 | +SO3 | 38.4 |
| M6 | +O+SO3 | 0.8 |
| M7 | +C6H8O6 | 55.7 |
| M8 | +O+C6H8O6 | 0.5 |
M5, nitroxoline sulfate; M7, nitroxoline glucuronide.
NA, not applicable.
Urinary concentrations of trimethoprim and metabolite analysis.
The mean urinary concentrations of TMP in the collection periods of 0 to 4, 4 to 8, 8 to 12, and 12 to 24 h were 36.648, 38.641, 18.785, and 41.590 mg/liter, respectively (Table 8). The urinary metabolite analysis showed that the mean relative signal area for the parent component TMP accounted for 89.4% of the total drug in the urine and those for the metabolites O (M1), CH2 (M2), C6H8O6 (M3), C6H8O7 (M4), CH2+SO3 (M5), and CH2+C6H8O6 (M6) accounted for 7.4%, 1.2%, 0.8%, 0.2%, 0.3%, and 0.8%, respectively (Table 9). Thus, from the qualitative analysis, it can be concluded that the TMP metabolites play only minor roles in urinary excretion. The mean total urinary excretion of TMP within 24 h was about 122 mg, corresponding to about 61% of the oral dose administered (200 mg).
TABLE 8.
Urinary concentrations and excretion levels of trimethoprim in 6 volunteers
| Collection time (h) | Urinary concentrationa |
Urinary excretion levelb |
||||
|---|---|---|---|---|---|---|
| Mean ± SD (mg/liter) | CV (%) | Median (range) (mg/liter) | Mean ± SD (mg) | CV (%) | Median (range) (mg) | |
| 0–4 | 36.65 ± 21.9 | 59.9 | 27.43 (21.71–78.46) | 32.38 ± 6.31 | 19.5 | 30.05 (25.66–44.55) |
| 4–8 | 38.64 ± 16.90 | 43.7 | 37.71 (15.55–65.86) | 22.93 ± 3.93 | 17.1 | 21.54 (19.64–31.30) |
| 8–12 | 18.79 ± 3.50 | 18.6 | 18.68 (14.39–22.94) | 33.02 ± 9.34 | 28.3 | 30.81 (22.64–51.49) |
| 12–24 | 41.59 ± 35.10 | 84.4 | 28.04 (17.99–110.49) | 34.38 ± 3.88 | 11.3 | 34.55 (28.48–40.95) |
| 0–24 (total) | 122.70 ± 11.47 | 9.3 | 118.03 (108.74–140.47) | |||
CV, coefficient of variation.
Percentage of dose: mean ± SD, 61.35% ± 5.74%; median, 59.0%; range, 54.37% to 70.24%.
TABLE 9.
Metabolite analysis of trimethoprim in the urine of 6 volunteers at 0 to 24 h
| Metabolite | Metabolite reaction | Relative area (%) |
|---|---|---|
| Trimethoprim | NAa | 89.4 |
| M1 | +O | 7.4 |
| M2 | −CH2 | 1.2 |
| M3 | +C6H8O6 | 0.8 |
| M4 | +C6H8O7 | 0.2 |
| M5 | −CH2+SO3 | 0.3 |
| M6 | −CH2+C6H8O6 | 0.8 |
NA, not applicable.
DISCUSSION
In order to integrate pharmacokinetic and pharmacodynamic parameters, the urinary inhibitory titers (UITs), urinary bactericidal titers (UBTs), and urinary bactericidal kinetics (UBK) for common uropathogens were determined after oral administration of recommended therapeutic doses of 250 mg NTX and 200 mg TMP (26–28). NTX is excreted in the urine in unconjugated as well as conjugated (e.g., glucuronide and sulfate) forms (29, 30). After oral administration of 250 mg to volunteers, about 99% of the excreted NTX is eliminated in urine as metabolites and only 1.0% as the parent component (Table 7), which is in line with other investigations (29, 30). In this study, the mean urinary concentrations of parent NTX during the first collection period (0 to 4 h) averaged about 0.5 mg/liter (Table 6), with the mean urinary excretion within 24 h of 0.5 mg corresponding to about 0.2% of the oral dose administered, which is about 8-fold lower than the value (1.6%) found by Mrhar et al. (30), with total urinary recovery of about 50% (including the conjugated forms of nitroxoline). The different findings may be due to different analytical methods or the longer elapsed time between sample collection and concentration analysis. In contrast, the UIT and UBT determinations were performed immediately after sample collection. Since early investigations showed that antimicrobial activity can be demonstrated in the urine after administration of 200 mg NTX (26, 29), it is hypothesized that some of the metabolites also exhibit antimicrobial activity. According to the relative peak area signals, the two main metabolites, i.e., NTX sulfate and glucuronide, contribute most to the urinary excretion of NTX. Unfortunately, the metabolites were not available for determination of the corresponding MICs for our tested stains. Therefore, the specific contributions of NTX and its two main metabolites to urinary antimicrobial activity could not be elucidated in this study. Further dose finding studies, however, led to the current recommendation of 250 mg NTX t.i.d. for treatment of uncomplicated cystitis (30).
The pharmacokinetics after oral administration of 200 mg TMP showed that around 90% of the excreted trimethoprim is eliminated as parent drug (Table 9). The mean urinary concentrations of parent trimethoprim during the first collection period (0 to 4 h) averaged about 40 mg/liter (Table 8).
The MICs of NTX ranged from 2 to 8 mg/liter for the TMP-susceptible and -resistant strains tested. The AUIT24 values in acidic urine for the two susceptible E. coli strains were about 100 to 150 times greater (median values) for TMP than for NTX. This proportion can be only partly explained by the lower urinary excretion of unconjugated NTX and the higher MICs of NTX versus TMP. The contributions of the NTX metabolites remain unclear, because specific MICs for the strains tested were not available.
UBTs have been shown to serve as valuable pharmacokinetic/pharmacodynamic parameters predicting urinary antibacterial efficacy in the assessment of fluoroquinolones (28, 31–33). In a study with patients with complicated UTIs, the UBT and AUBT24 values for levofloxacin were highly correlated with clinical and/or microbiological success or failure (34). A calculated target attainment rate for levofloxacin predicting therapeutic success in patients with complicated UTIs approximated a median UBT of 100 over 24 h or an AUBT24 value of 2,240 (34). Whether bactericidal activity is also necessary for the treatment of uncomplicated cystitis is not known. Considering the clinical efficacy of mainly bacteriostatic antibacterials such as nitrofurantoin in uncomplicated cystitis (5, 27, 35), urinary bacteriostatic activity was also measured in this study, represented by the UIT or AUIT24.
Since the composition of urine is highly variable over time, as exemplified by the physiological pH variations ranging from pH 5.5 to 8.0, UITs and UBTs were also measured at adjusted pH values of pH 5.5 and 8.0. Comparing NTX versus TMP, AUIT24 values were higher for NTX than for TMP for the TMP-resistant strain at pH 5.5. Conversely, the AUIT24 values of all TMP-susceptible strains tested were higher for TMP than for NTX, including at pH 5.5 and pH 8.0. In media at all three pH values, the AUBT24 values for TMP were higher than those for NTX for all tested strains except for the resistant E. coli strain 1135121.
For NTX, AUIT24 values were higher in urine at pH 5.5 than in urine at pH 8.0 (except for P. mirabilis). P. mirabilis not showing higher bacteriostatic activity could be due to its enzyme urease, which creates its own alkaline environment. A higher AUBT24 in acidic urine for NTX was demonstrated only for E. coli ATCC 25922. The finding of more-pronounced antibacterial activity in an acidic environment for NTX was also shown in other investigations (18). Therefore, there should be a call for pH measurement if NTX is to be employed, or an acidifying agent may be added to NTX treatment to improve antibacterial activity. For TMP, the AUIT24 of E. coli BN after TMP administration was higher at pH 8.0 than at pH 5.5. The AUBT24 values of TMP for E. coli ATCC 25922, E. coli BN, P. mirabilis, and S. saprophyticus were higher in alkaline urine than in acidic urine as well. Higher antimicrobial activity in an alkaline environment for TMP is consistent with prior investigations (36).
In order to assess the quality of the antibacterial activity of NTX, urinary bactericidal kinetics (UBK) were investigated at steady state after multiple oral doses of 250 mg NTX were administered to healthy volunteers. The UBK study showed that NTX exhibited mainly bacteriostatic urinary activity. Furthermore, subinhibitory concentrations of NTX have major inhibitory effects on adhesin expression and bacterial attachment (37–39), which may add an important antibacterial mechanism for NTX, although it was not tested in this study. The antiadhesive properties would perhaps enable NTX to be optimally used for prevention of recurrent UTIs.
NTX exhibited mainly bacteriostatic activity in urine. TMP showed both bacteriostatic and bactericidal activity in urine against susceptible strains. The antibacterial activity of NTX was more pronounced in acidic urine and that of TMP in alkaline urine. TMP showed higher antibacterial urinary activity than did NTX for susceptible strains. Cumulative effects of multiple dosing or other effects (e.g., inhibition of bacterial adherence) could not be evaluated in this study. UBK showed that NTX exhibits mainly bacteriostatic urinary activity, which seems to be sufficiently efficacious in the treatment of acute uncomplicated cystitis and especially for prophylaxis of recurrent UTIs, as shown in clinical studies (14–17).
ACKNOWLEDGMENTS
This study was supported by a grant from Rosen Pharma GmbH, Germany.
We thank R.-H. Bödeker and Christine Scheibelhut (Department of Statistics, Justus Liebig University, Giessen, Germany) for statistical calculations and Birgit Blenk, Daniela Kirchbauer, and Christin Bär for technical assistance in the UIT, UBT, UBK, and MIC studies. We also thank Klaus Biemel (Pharmacelsus GmbH, Saarbruecken, Germany) for determination of urinary concentrations of nitroxoline and trimethoprim and their respective metabolites.
Footnotes
Published ahead of print 11 November 2013
REFERENCES
- 1.Kahlmeter G. 2003. An international survey of the antimicrobial susceptibility of pathogens from uncomplicated urinary tract infections: the ECO.SENS Project. J. Antimicrob. Chemother. 51:69–76. 10.1093/jac/dkg028 [DOI] [PubMed] [Google Scholar]
- 2.Kahlmeter G, Poulsen HO. 2012. Antimicrobial susceptibility of Escherichia coli from community-acquired urinary tract infections in Europe: the ECO.SENS study revisited. Int. J. Antimicrob. Agents 39:45–51. 10.1016/j.ijantimicag.2011.09.013 [DOI] [PubMed] [Google Scholar]
- 3.Naber KG, Schito G, Botto H, Palou J, Mazzei T. 2008. Surveillance study in Europe and Brazil on clinical aspects and Antimicrobial Resistance Epidemiology in Females with Cystitis (ARESC): implications for empiric therapy. Eur. Urol. 54:1164–1175. 10.1016/j.eururo.2008.05.010 [DOI] [PubMed] [Google Scholar]
- 4.Warren JW, Abrutyn E, Hebel JR, Johnson JR, Schaeffer AJ, Stamm WE. 1999. Guidelines for antimicrobial treatment of uncomplicated acute bacterial cystitis and acute pyelonephritis in women. Clin. Infect. Dis. 29:745–758. 10.1086/520427 [DOI] [PubMed] [Google Scholar]
- 5.Goettsch WG, Janknegt R, Herings RM. 2004. Increased treatment failure after 3-days' courses of nitrofurantoin and trimethoprim for urinary tract infections in women: a population-based retrospective cohort study using the PHARMO database. Br. J. Clin. Pharmacol. 58:184–189. 10.1111/j.1365-2125.2004.02106.x [DOI] [PMC free article] [PubMed] [Google Scholar]
- 6.Gossius GVL. 1985. The treatment of acute dysuria-frequency syndrome in adult women: double-blind, randomized comparison of three-day vs ten-day trimethoprim therapy. Curr. Ther. Res. 37:34–42 [Google Scholar]
- 7.van Merode T, Nys S, Raets I, Stobberingh E. 2005. Acute uncomplicated lower urinary tract infections in general practice: clinical and microbiological cure rates after three- versus five-day treatment with trimethoprim. Eur. J. Gen. Pract. 11:55–58. 10.3109/13814780509178238 [DOI] [PubMed] [Google Scholar]
- 8.Minassian MA, Lewis DA, Chattopadhyay D, Bovill B, Duckworth GJ, Williams JD. 1998. A comparison between single-dose fosfomycin trometamol (Monuril) and a 5-day course of trimethoprim in the treatment of uncomplicated lower urinary tract infection in women. Int. J. Antimicrob. Agents 10:39–47. 10.1016/S0924-8579(98)00021-1 [DOI] [PubMed] [Google Scholar]
- 9.Kahlmeter G, Poulsen HO. 2012. Antimicrobial susceptibility of Escherichia coli from community-acquired urinary tract infections in Europe: the ECO.SENS study revisited. Int. J. Antimicrob. Agents 39:45–51. 10.1016/j.ijantimicag.2011.09.013 [DOI] [PubMed] [Google Scholar]
- 10.Grabe M, Bjerklund Johansen TE, Botto H, Cek M, Naber KG, Tenke P, Wagenlehner FME. 2011. Guidelines on urological infections, p 1–112 In European Association, of Urology. (ed), European Association of Urology guidelines. European Association of Urology, Arnhem, Netherlands [Google Scholar]
- 11.Gupta K, Hooton TM, Naber KG, Wullt B, Colgan R, Miller LG, Moran GJ, Nicolle LE, Raz R, Schaeffer AJ, Soper DE. 2011. International clinical practice guidelines for the treatment of acute uncomplicated cystitis and pyelonephritis in women: a 2010 update by the Infectious Diseases Society of America and the European Society for Microbiology and Infectious Diseases. Clin. Infect. Dis. 52:e103–e120. 10.1093/cid/ciq257 [DOI] [PubMed] [Google Scholar]
- 12.Wagenlehner FM, Hoyme U, Kaase M, Funfstuck R, Naber KG, Schmiemann G. 2011. Uncomplicated urinary tract infections. Dtsch. Arztebl. Int. 108:415–423. 10.3238/arztebl.2011.0415 [DOI] [PMC free article] [PubMed] [Google Scholar]
- 13.Wagenlehner FM, Schmiemann G, Hoyme U, Funfstuck R, Hummers-Pradier E, Kaase M, Knieh E, Selbach I, Sester U, Vahlensieck W, Watermann D, Naber KG. 2011. S3-guideline for uncomplicated urinary tract infections: treatment guidelines compliance. Med. Monatsschr. Pharm. 34:164–168 (In German.) [PubMed] [Google Scholar]
- 14.Frobert J-L, Coupry A. 1987. Treatment of uncomplicated urinary tract infections in women with Nibiol Forte. Gaz. Méd. Fr. 94:71–94 (In French.) [Google Scholar]
- 15.Sachse D. 1984. Therapy for chronically recurrent urinary tract infection. Therapiewoche 34:236–238 (In German.) [Google Scholar]
- 16.Schlesinger E, Patsch R, Kraft M. 1975. First experience with 5-nitro-oxy-chinolin in the treatment of chronic urinary tract infection. Zschr. Urol. 68:429–434 (In German.) [PubMed] [Google Scholar]
- 17.Schuelke J. 1986. Are gyrase inhibitors invariably superior? Nitroxoline versus norfloxacin: a comparison of treatment. Therapiewoche 36:4294–4297 (In German.) [Google Scholar]
- 18.Pelletier C, Prognon P, Bourlioux P. 1995. Roles of divalent cations and pH in mechanism of action of nitroxoline against Escherichia coli strains. Antimicrob. Agents Chemother. 39:707–713. 10.1128/AAC.39.3.707 [DOI] [PMC free article] [PubMed] [Google Scholar]
- 19.Körber-Irrgang B, Kresken M. 2013. Abstr. 65th Annu. Meet. German Soc. Hyg. Microbiol., Rostock, Germany, poster FTP09 [Google Scholar]
- 20.Wolf KM. 2013. Antagonism and adhesion of the probiotic E. coli strain Nissle 1917. Master's thesis Julius Maximilian University of Wuerzburg, Wuerzburg, Germany: (In German.) [Google Scholar]
- 21.Sobke A, Klinger M, Hermann B, Sachse S, Nietzsche S, Makarewicz O, Keller PM, Pfister W, Straube E. 2012. The urinary antibiotic 5-nitro-8-hydroxyquinoline (nitroxoline) reduces the formation and induces the dispersal of Pseudomonas aeruginosa biofilms by chelation of iron and zinc. Antimicrob. Agents Chemother. 56:6021–6025. 10.1128/AAC.01484-12 [DOI] [PMC free article] [PubMed] [Google Scholar]
- 22.Wagenlehner FME, Muench F, Pilatz A, Blenk B, Blenk H, Weidner W, Naber KG. 2011. Urinary antibacterial activity of nitroxolin 250 mg versus trimethoprim 200 mg against uropathogens after single oral administration, poster A2-038. Abstr. 51st Intersci. Conf. Antimicrob. Agents Chemother., Chicago, IL, 17 to 20 September 2011 [Google Scholar]
- 23.Clinical and Laboratory Standards Institute 2006. Methods for dilution in antimicrobial susceptibility tests for bacteria that grow aerobically; approved guideline-7th ed. Approved standard M7-A7. Clinical and Laboratory Standards Institute, Wayne, PA [Google Scholar]
- 24.Rosen Pharma GmbH 2012. Fachinformation Nitroxolin forte 2012. Rosen Pharma GmbH, Blieskastel, Germany [Google Scholar]
- 25.Wellek S, Blettner M. 2012. On the proper use of the crossover design in clinical trials: part 18 of a series on evaluation of scientific publications. Dtsch. Arztebl. Int. 109:276–281. 10.3238/arztebl.2012.0276 [DOI] [PMC free article] [PubMed] [Google Scholar]
- 26.Karba R, Mrhar A, Kozjek F, Bremsak F. 1979. Appropriate nitroxoline dosage regimen design. Int. J. Clin. Pharmacol. Biopharm. 17:482–485 [PubMed] [Google Scholar]
- 27.Spencer RC, Moseley DJ, Greensmith MJ. 1994. Nitrofurantoin modified release versus trimethoprim or co-trimoxazole in the treatment of uncomplicated urinary tract infection in general practice. J. Antimicrob. Chemother. 33(Suppl A):121–129 [DOI] [PubMed] [Google Scholar]
- 28.Wagenlehner FM, Kinzig-Schippers M, Tischmeyer U, Wagenlehner C, Sorgel F, Naber KG. 2006. Urinary bactericidal activity of extended-release ciprofloxacin (1,000 milligrams) versus levofloxacin (500 milligrams) in healthy volunteers receiving a single oral dose. Antimicrob. Agents Chemother. 50:3947–3949. 10.1128/AAC.00477-06 [DOI] [PMC free article] [PubMed] [Google Scholar]
- 29.Bergogne-Berezin E, Berthelot G, Muller-Serieys C. 1987. Present status of nitroxoline. Pathol. Biol. (Paris) 35:873–878 (In French.) [PubMed] [Google Scholar]
- 30.Mrhar A, Kopitar Z, Kozjek F, Presl V, Karba R. 1979. Clinical pharmacokinetics of nitroxoline. Int. J. Clin. Pharmacol. Biopharm. 17:476–481 [PubMed] [Google Scholar]
- 31.Wagenlehner FM, Kinzig-Schippers M, Sorgel F, Weidner W, Naber KG. 2006. Concentrations in plasma, urinary excretion and bactericidal activity of levofloxacin (500 mg) versus ciprofloxacin (500 mg) in healthy volunteers receiving a single oral dose. Int. J. Antimicrob. Agents 28:551–559. 10.1016/j.ijantimicag.2006.07.026 [DOI] [PubMed] [Google Scholar]
- 32.Wagenlehner FM, Kinzig-Schippers M, Tischmeyer U, Wagenlehner C, Sorgel F, Dalhoff A, Naber KG. 2006. Pharmacokinetics of ciprofloxacin XR (1000 mg) versus levofloxacin (500 mg) in plasma and urine of male and female healthy volunteers receiving a single oral dose. Int. J. Antimicrob. Agents 27:7–14. 10.1016/j.ijantimicag.2005.09.014 [DOI] [PubMed] [Google Scholar]
- 33.Wagenlehner FM, Wydra S, Onda H, Kinzig-Schippers M, Sorgel F, Naber KG. 2003. Concentrations in plasma, urinary excretion, and bactericidal activity of linezolid (600 milligrams) versus those of ciprofloxacin (500 milligrams) in healthy volunteers receiving a single oral dose. Antimicrob. Agents Chemother. 47:3789–3794. 10.1128/AAC.47.12.3789-3794.2003 [DOI] [PMC free article] [PubMed] [Google Scholar]
- 34.Wagenlehner FM, Wagenlehner C, Redman R, Weidner W, Naber KG. 2009. Urinary bactericidal activity of doripenem versus that of levofloxacin in patients with complicated urinary tract infections or pyelonephritis. Antimicrob. Agents Chemother. 53:1567–1573. 10.1128/AAC.01133-08 [DOI] [PMC free article] [PubMed] [Google Scholar]
- 35.Gupta K, Hooton TM, Roberts PL, Stamm WE. 2007. Short-course nitrofurantoin for the treatment of acute uncomplicated cystitis in women. Arch. Intern. Med. 167:2207–2212. 10.1001/archinte.167.20.2207 [DOI] [PubMed] [Google Scholar]
- 36.Aagaard J, Gasser T, Rhodes P, Madsen PO. 1991. MICs of ciprofloxacin and trimethoprim for Escherichia coli: influence of pH, inoculum size and various body fluids. Infection 19(Suppl 3):S167–S169 [DOI] [PubMed] [Google Scholar]
- 37.Bourlioux P, Botto H, Karam D, Amgar A, Camey M. 1989. Inhibition of bacterial adherence by nitroxoline on cellular adhesion and on urinary catheter surfaces. Pathol. Biol. (Paris) 37:451–454 (In French.) [PubMed] [Google Scholar]
- 38.Karam D, Amgar A, Bourlioux P. 1988. Inhibition of bacterial adhesion of uropathogenic Escherichia coli strains by the urine of patients treated with nitroxoline. Pathol. Biol. (Paris) 36:452–455 (In French.) [PubMed] [Google Scholar]
- 39.Oliviero L, Perdiz M, Bourlioux P. 1990. Direct effect of nitroxoline in the inhibition of bacterial adherence to urinary catheters. Pathol. Biol. (Paris) 38:455–458 (In French.) [PubMed] [Google Scholar]