

Abstract
Since epidemiological cutoff values (ECVs) using CLSI MICs from multiple laboratories are not available for Candida spp. and the echinocandins, we established ECVs for anidulafungin and micafungin on the basis of wild-type (WT) MIC distributions (for organisms in a species-drug combination with no detectable acquired resistance mechanisms) for 8,210 Candida albicans, 3,102 C. glabrata, 3,976 C. parapsilosis, 2,042 C. tropicalis, 617 C. krusei, 258 C. lusitaniae, 234 C. guilliermondii, and 131 C. dubliniensis isolates. CLSI broth microdilution MIC data gathered from 15 different laboratories in Canada, Europe, Mexico, Peru, and the United States were aggregated to statistically define ECVs. ECVs encompassing 97.5% of the statistically modeled population for anidulafungin and micafungin were, respectively, 0.12 and 0.03 μg/ml for C. albicans, 0.12 and 0.03 μg/ml for C. glabrata, 8 and 4 μg/ml for C. parapsilosis, 0.12 and 0.06 μg/ml for C. tropicalis, 0.25 and 0.25 μg/ml for C. krusei, 1 and 0.5 μg/ml for C. lusitaniae, 8 and 2 μg/ml for C. guilliermondii, and 0.12 and 0.12 μg/ml for C. dubliniensis. Previously reported single and multicenter ECVs defined in the present study were quite similar or within 1 2-fold dilution of each other. For a collection of 230 WT isolates (no fks mutations) and 51 isolates with fks mutations, the species-specific ECVs for anidulafungin and micafungin correctly classified 47 (92.2%) and 51 (100%) of the fks mutants, respectively, as non-WT strains. These ECVs may aid in detecting non-WT isolates with reduced susceptibility to anidulafungin and micafungin due to fks mutations.
INTRODUCTION
The echinocandins anidulafungin and micafungin are widely recognized as first-line antifungal agents for the treatment of candidemia and other forms of invasive candidiasis (infections of normally sterile sites, tissues, and organs) (1–3). The Clinical and Laboratory Standards Institute (CLSI) Subcommittee on Antifungal Susceptibility Tests has standardized the broth microdilution reference method for testing the echinocandins against Candida spp. (4) and has developed new species-specific clinical breakpoints (CBPs) for the more prevalent species (Candida albicans, C. glabrata, C. guilliermondii, C. krusei, C. parapsilosis, and C. tropicalis) (5–7); epidemiological cutoff values (ECVs) for common and less prevalent species (e.g., C. dubliniensis, C. guilliermondii, and C. lusitaniae) have also been defined (6–8). Whereas CBPs are used to identify those isolates that are likely to respond to treatment with a given antimicrobial agent administered at the approved closing regimen for that agent, the ECV can be used as the most sensitive indicator of the emergence of strains with reduced susceptibility to a given agent (6, 9–12). An ECV is an MIC threshold value that allows the discrimination of wild-type (WT) strains (those without mutational or acquired resistance mechanisms) from non-WT strains (those harboring mutational or acquired resistance mechanisms) (6, 7, 9, 10, 12).
The species-specific ECVs defined previously for all three echinocandins (anidulafungin, caspofungin, and micafungin) were determined using CLSI MIC results from a single laboratory (8, 13). Because MIC distributions generated by a single laboratory may not be completely representative of WT MICs for all agents and species of Candida (14), we further validated these ECVs for anidulafungin and micafungin by gathering MIC data from multiple laboratories (15 different centers) in Canada, Europe, Mexico, Peru, and the United States. MIC data were also collected for caspofungin; however, due to excessive heterogeneity in the respective MIC distributions, the caspofungin results are presented separately (14). Although the number of isolates needed to calculate a representative ECV is not established, there is a working consensus among experts that recommends at least 50 strains (and, preferably, 100) from at least 3 to 5 different laboratories (15, 16).
The main objectives of the present study included (i) definition of the WT MIC distributions of anidulafungin and micafungin for five of the most common and three less common Candida species causing invasive candidiasis by using aggregated CLSI MIC results from 15 different laboratories (131 to 8,210 MICs, according to species and antifungal agent), (ii) proposal of the ECV for each species-drug combination for the 24-h CLSI method, (iii) comparison of the ECVs obtained from this multicenter study with those previously proposed by a single laboratory and those recently determined in a multicenter study for the Sensititre YeastOne method (17), and (iv) demonstration of the ability of these ECVs to discriminate WT from non-WT strains of Candida using a collection of 230 WT isolates (no fks mutations) and 51 isolates with fks mutations.
MATERIALS AND METHODS
Isolates.
Each isolate was recovered from a unique clinical specimen at 15 different centers or reference laboratories: The University of Iowa, Iowa City, IA; JMI Laboratories, North Liberty, IA; VCU Medical Center, Richmond, VA; Instituto de Medicina Tropical Alexander von Humboldt-Universidad Peruana Cayetano Heredia, Lima, Peru; Hospital Universitario La Fe, Valencia, Spain; University of Texas Health Science Center, San Antonio, TX; University of Alberta, Edmonton, Alberta, Canada; Universidad Autónoma de Nuevo León, Monterey, Nuevo León, Mexico; Facultat de Medicina, IISPV, URV, Reus, Spain; The Innsbruck Medical University, Innsbruck, Austria; Centers for Disease Control and Prevention, Atlanta, GA; Hospital Universitario de Valme, Seville, Spain; Canisius Wilhelmina Hospital and Radboud University, Nijmegen Medical Center, Nijmegen, Netherlands; University of Texas Health Science Center, Houston, TX; Hospital General Universitario Gregorio Maraňón, Facultad de Medicina-Universidad Complutense, Madrid, Spain; and Laboratoire de Santé Publique du Québec, Institut National de Santé Publique du Québec, Quebec, Quebec, Canada. These laboratories were coded 1 to 20 (for several studies), but because some laboratories were excluded from the study or did not provide echinocandin data, we used data from the remaining 15 laboratories (Table 1). Isolates were identified and stored at each medical center using standardized nonmolecular methodologies; isolates were not characterized for mutations. The total numbers of aggregated available CLSI MICs from the 15 laboratories per species were as follows: 8,210 for C. albicans, 3,102 for C. glabrata, 3,976 for C. parapsilosis, 2,042 for C. tropicalis, 617 for C. krusei, 258 for C. lusitaniae, 234 for C. guilliermondii, and 131 for C. dubliniensis.
TABLE 1.
MIC distributions of anidulafungin and micafungin for eight species of Candida and each contributing laboratory determined using CLSI M27-A3 broth microdilution methods
| Antifungal agent | Species (total no. of isolates tested) | Laboratory | No. of isolates tested | MIC (μg/ml) |
|
|---|---|---|---|---|---|
| Range | Mode | ||||
| Anidulafungin | C. albicans (8,210) | 1 | 336 | 0.008–0.5 | 0.03 |
| 2 | 138 | 0.015–0.25 | 0.03 | ||
| 3 | 363 | 0.008–2 | 0.015 | ||
| 9 | 447 | 0.008–2 | 0.03 | ||
| 12 | 1,246 | 0.008–1 | 0.03 | ||
| 18 | 1,397 | 0.008–2 | 0.015 | ||
| 19 | 4,283 | 0.008–1 | 0.03 | ||
| C. glabrata (2,680) | 1 | 106 | 0.015–2 | 0.06 | |
| 2 | 121 | 0.015–2 | 0.03 | ||
| 3 | 98 | 0.015–4 | 0.03 | ||
| 6 | 40 | 0.015–0.12 | 0.06 | ||
| 18 | 1,079 | 0.008–4 | 0.03 | ||
| 19 | 1,236 | 0.015–4 | 0.06 | ||
| C. parapsilosis (3,976) | 1 | 28 | 0.12–4 | 1 | |
| 2 | 81 | 0.12–4 | 0.5 | ||
| 3 | 246 | 0.015–4 | 2 | ||
| 9 | 159 | 0.015–4 | 2 | ||
| 10 | 391 | 0.03–4 | 1 | ||
| 11 | 275 | 0.03–8 | 2 | ||
| 12 | 878 | 0.03–4 | 1 | ||
| 14 | 44 | 0.03–2 | 1 | ||
| 17 | 31 | 0.12–2 | 1 | ||
| 18 | 599 | 0.008–8 | 1 | ||
| 19 | 1,238 | 0.015–4 | 2 | ||
| 20 | 6 | 0.03–2 | 1 | ||
| C. tropicalis (2,042) | 1 | 36 | 0.015–1 | 0.06 | |
| 2 | 49 | 0.015–0.25 | 0.03 | ||
| 3 | 55 | 0.015–2 | 0.03 | ||
| 6 | 45 | 0.015–0.25 | 0.03 | ||
| 9 | 72 | 0.015–0.25 | 0.03 | ||
| 12 | 425 | 0.008–2 | 0.06 | ||
| 18 | 364 | 0.008–0.5 | 0.015 | ||
| 19 | 996 | 0.008–2 | 0.03 | ||
| C. krusei (322) | 1 | 20 | 0.03–1 | 0.06 | |
| 2 | 29 | 0.03–0.25 | 0.12 | ||
| 3 | 19 | 0.03–2 | 0.03 | ||
| 6 | 2 | 0.06–2 | 0.06 | ||
| 9 | 25 | 0.06–0.25 | 0.12 | ||
| 11 | 79 | 0.03–2 | 0.06 | ||
| 12 | 83 | 0.03–2 | 0.06 | ||
| 18 | 54 | 0.015–0.25 | 0.03 | ||
| 20 | 11 | 0.015–0.12 | 0.03 | ||
| C. lusitaniae (234) | 1 | 20 | 0.06–0.5 | 0.25 | |
| 2 | 12 | 0.06–1 | 0.25 | ||
| 9 | 35 | 0.06–1 | 0.25 | ||
| 12 | 9 | 0.06–1 | 0.25 | ||
| 18 | 59 | 0.008–1 | 0.5 | ||
| 19 | 99 | 0.06–1 | 0.5 | ||
| C. guilliermondii (222) | 1 | 9 | 0.25–4 | 2 | |
| 6 | 2 | 1 | 1 | ||
| 9 | 6 | 0.5–2 | 2 | ||
| 11 | 8 | 1–2 | 1 | ||
| 12 | 91 | 0.03–4 | 1 | ||
| 14 | 3 | 0.06–1 | 1 | ||
| 18 | 15 | 0.25–4 | 1 | ||
| 19 | 88 | 0.06–4 | 1 | ||
| C. dubliniensis (131) | 1 | 38 | 0.015–4 | 0.06 | |
| 5 | 11 | 0.015–0.25 | 0.06 | ||
| 9 | 14 | 0.015–0.12 | 0.03 | ||
| 11 | 5 | 0.015–0.03 | 0.03 | ||
| 18 | 63 | 0.015–1 | 0.06 | ||
| Micafungin | C. albicans (7,874) | 1 | 95 | 0.008–0.5 | 0.015 |
| 3 | 366 | 0.008–2 | 0.015 | ||
| 9 | 447 | 0.015–4 | 0.03 | ||
| 12 | 1,246 | 0.008–1 | 0.03 | ||
| 18 | 1,398 | 0.008–2 | 0.015 | ||
| 19 | 4,282 | 0.008–0.5 | 0.015 | ||
| 20 | 40 | 0.008–1 | 0.015 | ||
| C. glabrata (3,102) | 1 | 52 | 0.008–0.12 | 0.03 | |
| 2 | 284 | 0.015–4 | 0.03 | ||
| 3 | 97 | 0.008–1 | 0.015 | ||
| 9 | 164 | 0.015–0.12 | 0.03 | ||
| 12 | 176 | 0.008–2 | 0.015 | ||
| 18 | 1,079 | 0.008–32 | 0.015 | ||
| 19 | 1,236 | 0.008–2 | 0.015 | ||
| 20 | 14 | 0.015–4 | 0.015 | ||
| C. parapsilosis (3,484) | 1 | 32 | 0.06–4 | 1 | |
| 2 | 239 | 0.06–2 | 0.5 | ||
| 3 | 251 | 0.015–4 | 1 | ||
| 4 | 27 | 0.015–1 | 0.5 | ||
| 9 | 159 | 0.25–4 | 1 | ||
| 11 | 55 | 0.03–2 | 1 | ||
| 12 | 878 | 0.015–4 | 1 | ||
| 18 | 599 | 0.015–4 | 1 | ||
| 19 | 1,238 | 0.015–2 | 1 | ||
| 20 | 6 | 0.015–2 | 1 | ||
| C. tropicalis (1,605) | 1 | 39 | 0.008–0.12 | 0.015 | |
| 3 | 53 | 0.008–4 | 0.015 | ||
| 8 | 45 | 0.015–8 | 0.03 | ||
| 9 | 72 | 0.008–0.25 | 0.06 | ||
| 11 | 32 | 0.008–0.06 | 0.03 | ||
| 18 | 363 | 0.008–1 | 0.03 | ||
| 19 | 996 | 0.008–1 | 0.015 | ||
| 20 | 5 | 0.008–0.06 | 0.03 | ||
| C. krusei (617) | 1 | 41 | 0.03–1 | 0.12 | |
| 2 | 72 | 0.015–0.25 | 0.12 | ||
| 3 | 21 | 0.015–1 | 0.12 | ||
| 4 | 60 | 0.03–0.5 | 0.12 | ||
| 11 | 5 | 0.03–0.06 | 0.06 | ||
| 12 | 83 | 0.015–0.25 | 0.12 | ||
| 18 | 54 | 0.06–0.12 | 0.12 | ||
| 19 | 270 | 0.015–0.25 | 0.06 | ||
| 20 | 11 | 0.03–0.12 | 0.06 | ||
| C. lusitaniae (258) | 2 | 56 | 0.015–16 | 0.12 | |
| 9 | 35 | 0.03–0.5 | 0.25 | ||
| 12 | 9 | 0.015–0.5 | 0.12 | ||
| 18 | 59 | 0.015–2 | 0.25 | ||
| 19 | 99 | 0.008–1 | 0.12 | ||
| C. guilliermondii (234) | 1 | 13 | 0.03–0.5 | 0.25 | |
| 2 | 27 | 0.06–0.25 | 0.25 | ||
| 11 | 91 | 0.015–8 | 0.5 | ||
| 18 | 14 | 0.25–2 | 0.25 | ||
| 19 | 88 | 0.015–8 | 0.5 | ||
| 20 | 1 | 0.25 | 0.25 | ||
| C. dubliniensis (117) | 2 | 27 | 0.015–2 | 0.03 | |
| 3 | 1 | 0.015 | 0.015 | ||
| 9 | 10 | 0.03–0.06 | 0.03 | ||
| 17 | 63 | 0.008–1 | 0.06 | ||
| 18 | 16 | 0.015–8 | 0.06 | ||
Whereas these isolates generally represented the incident isolate for each episode of infection and were likely WT strains, the extent of prior exposure to antifungal therapy is not known. This must be recognized as a possible limitation of the study, as prior exposure may result in acquired antifungal resistance, skewing the results.
In addition to these isolates, we included the anidulafungin and micafungin MIC distributions from an earlier collection of 281 isolates (5 species; 230 WT and 51 non-WT) all tested for the presence (non-WT) and absence (WT) of mutations in fks1 and fks2 (C. glabrata only) (6, 10) in order to assess the ability of the various anidulafungin and micafungin ECVs to discriminate non-WT from WT strains of Candida at the molecular level.
Antifungal susceptibility testing.
Broth microdilution testing was performed in each laboratory in accordance with the guidelines in CLSI document M27-A3 (4), using RPMI 1640 medium with 0.2% glucose, an inoculum of 0.5 × 10³ to 2.5 × 10³ cells/ml, and incubation in air at 35°C. MIC values were determined visually after 24 h of incubation as the lowest concentration of drug that caused a significant diminution (≥50% inhibition) of growth relative to that of the growth control (4). In all instances, MIC trays were prepared using reagent-grade powders, as directed by CLSI.
Two quality control (QC) isolates, C. parapsilosis ATCC 22019 and C. krusei ATCC 6258, were used on each day of testing by the participant laboratories, as recommended by CLSI (4, 5). Only those results for which QC MICs were within the established reference range were used in the study.
Definitions.
The definitions of the WT population and ECV were those reported previously (6, 8, 9, 16). A WT population was the subpopulation of isolates/MICs for a species-drug combination with no acquired detectable resistance mechanisms (12, 17).
The ECV is the highest MIC value of the WT population. It is calculated by taking into account the MIC distribution, the modal MIC of each distribution, and the inherent variability of the test (usually within 1 doubling dilution) and should encompass ≥95% of isolates (7).
Data analysis.
The MIC distributions of each of the eight species tested in each participant laboratory were first screened for evidence of grossly skewed distributions that precluded statistical fitting, and the modal MICs for each laboratory were determined (14, 16); however, their pseudomodes were the same as those observed in the laboratories included in the analysis. Grossly skewed distributions and distributions which had a modal MIC at the lowest concentration tested were excluded. Next, the aggregate WT distributions for each antifungal agent and species of Candida were obtained by pooling qualifying MIC distributions from participant laboratories, and the ECV was then estimated by the statistical method of Turnidge et al. (18). For this study, a minimum of 3 laboratories and 100 data points was required to establish a reasonable estimated ECV for a given agent and species. In the statistical method, the modeled WT population is based on fitting a lognormal distribution at the lower end of the MIC range, calculating the mean and standard deviation of that normal distribution, and using those values to estimate the MIC (ECV) that captured at least 95%, 97.5%, and 99% of the modeled WT population, rounded up to the nearest 2-fold dilution. The modes for each agent and species and the inherent variability (within approximately 1 doubling dilution) of susceptibility testing were also considered, and a search for outlier laboratories in each distribution was performed (19).
RESULTS AND DISCUSSION
A total of 17 laboratories submitted MIC data for anidulafungin and micafungin; data for 2 laboratories were omitted due to the use of 2.0% glucose (rather than the 0.2% glucose prescribed by CLSI) in the test medium (4). In addition, MICs for some species and antifungal agent combinations from 1 and 5 laboratories, respectively, were not included in the final analysis due to truncated distributions (modal MIC at the lowest concentration tested). The remaining aggregated CLSI MIC distributions from the 15 laboratories for the various species versus anidulafungin and micafungin were 8,210 and 7,874, respectively, for C. albicans, 2,680 and 3,102, respectively, for C. glabrata, 3,976 and 3,484, respectively, for C. parapsilosis, 2,042 and 1,605, respectively, for C. tropicalis, 322 and 617, respectively, for C. krusei, 234 and 258, respectively, for C. lusitaniae, 222 and 234, respectively, for C. guilliermondii, and 131 and 117, respectively, for C. dubliniensis (Tables 1 to 3).
TABLE 3.
Anidulafungin and micafungin ECVs for eight species of Candida based on MICs from 5 to 12 laboratories determined by the CLSI M27-A3 broth microdilution method
| Antifungal agent tested | Species | No. of isolates | MIC (μg/ml) |
ECV (μg/ml)a |
|||
|---|---|---|---|---|---|---|---|
| Range | Modeb | ≥95% | ≥97.5% | ≥99% | |||
| Anidulafungin | C. albicans | 8,210 | 0.008–2 | 0.03 | 0.06 | 0.12 | 0.12 |
| C. glabrata | 2,680 | 0.008–4 | 0.06 | 0.12 | 0.12 | 0.25 | |
| C. parapsilosis | 3,976 | 0.008–8 | 2 | 4 | 8 | 8 | |
| C. tropicalis | 2,042 | 0.008–2 | 0.03 | 0.12 | 0.12 | 0.12 | |
| C. krusei | 322 | 0.008–2 | 0.06 | 0.12 | 0.25 | 0.25 | |
| C. lusitaniae | 234 | 0.008–1 | 0.25 | 1 | 1 | 1 | |
| C. guilliermondii | 222 | 0.03–4 | 1 | 4 | 8 | 8 | |
| C. dubliniensis | 131 | 0.015–4 | 0.03 | 0.12 | 0.12 | 0.12 | |
| Micafungin | C. albicans | 7,874 | 0.008–4 | 0.015 | 0.03 | 0.03 | 0.03 |
| C. glabrata | 3,102 | 0.008–4 | 0.015 | 0.03 | 0.03 | 0.03 | |
| C. parapsilosis | 3,484 | 0.015–4 | 1 | 2 | 4 | 4 | |
| C. tropicalis | 1,605 | 0.008–8 | 0.015 | 0.06 | 0.06 | 0.12 | |
| C. krusei | 617 | 0.015–1 | 0.06 | 0.25 | 0.25 | 0.25 | |
| C. lusitaniae | 258 | 0.008-≥16 | 0.25 | 0.5 | 0.5 | 1 | |
| C. guilliermondii | 234 | 0.015–8 | 0.5 | 2 | 2 | 4 | |
| C. dubliniensis | 117 | 0.008–8 | 0.06 | 0.12 | 0.12 | 0.12 | |
Calculated ECVs comprising ≥95%, ≥97.5%, or ≥99% of the statistically modeled MIC population.
The most frequent MIC.
The data in Table 1 include the number of MIC results and the range and modal MIC values for each laboratory that contributed qualifying data for the different drug-organism combinations. These results demonstrate the comparability of the MIC distributions contributed by the various laboratories for each antifungal agent and species of Candida. With few exceptions, the modal MICs for each laboratory were within 1 2-fold dilution of one another within the different drug-organism pairs.
The pooled WT MIC distributions for anidulafungin and micafungin and each of the eight species of Candida are shown in Table 2. The in vitro activities of the 2 antifungal agents tested were similar to those observed by other authors using the CLSI method (20–22). All of the MIC distributions were typical for WT organisms and covered 3 to 5 2-fold dilution steps surrounding the modal MIC.
TABLE 2.
Pooled MIC distributions of anidulafungin and micafungin for eight species of Candida from 5 to 12 laboratories using CLSI M27-A3 method
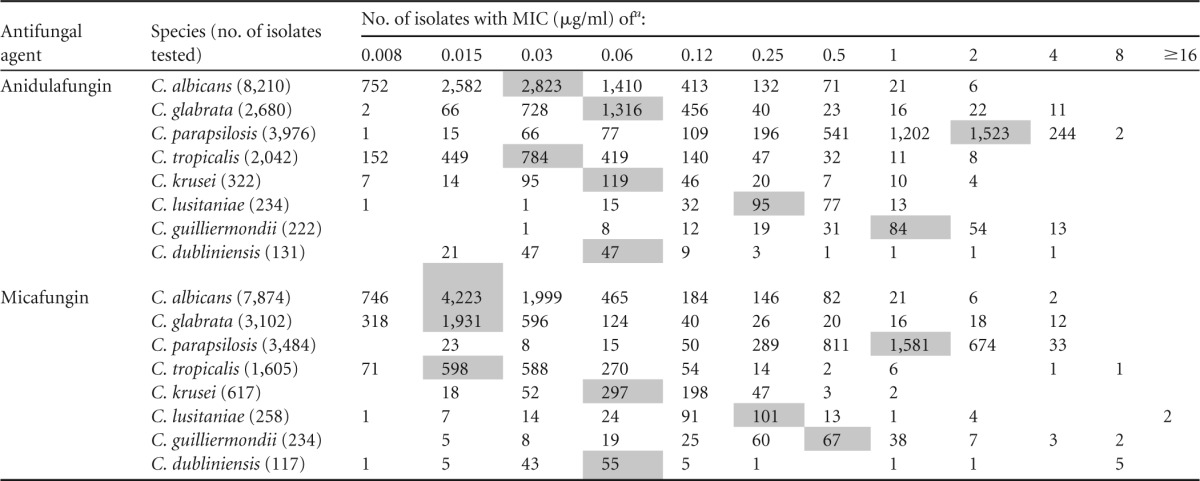
Shaded values indicate the modes (the most frequent MIC).
Table 3 depicts the proposed anidulafungin and micafungin ECVs (using ≥95%, ≥97.5%, and ≥99% of the modeled MIC population) as well as the modal MICs for each of the eight species of Candida. Very little difference between the ECVs encompassing 95%, 97.5%, or 99% of the modeled MIC populations was seen. While previous studies have reported ECVs to be the MIC encompassing at least 95% of the population defined using both the eyeball method and statistical methods for Candida spp. (7, 13) and Aspergillus spp. (16), for comparison purposes we used the ECV that encompassed 97.5% of the modeled population; these ECVs appeared to relate better to those defined by the eyeball method (18). In general, the ECVs for each antifungal agent and species of Candida were within 1 or 2 2-fold dilutions of the modal MIC values. Likewise, the ECVs for anidulafungin and micafungin and each species of Candida were within 1 to 2 2-fold dilutions of one another, with those of anidulafungin usually being higher than those of micafungin.
The ECVs defined in the present study are similar to those reported previously from a single laboratory using the CLSI broth microdilution method as well as those reported by Canton et al. (17) using the Sensititre YeastOne method. In each case, the method for calculating the ECVs was that of Turnidge et al. (18); however, the single-laboratory CLSI study and the multicenter YeastOne study used the 95% threshold, while in the present study, ECVs encompassing 97.5% of the modeled population were also defined (Table 3). In general, 100% of the ECVs from both the single-laboratory CLSI study and the YeastOne study were equal to or within 1 2-fold dilution of those reported in the present multicenter study (ECVs comprising 97.5% of the population), except for the higher YeastOne ECV of anidulafungin for C. tropicalis (1 μg/ml versus 0.12 μg/ml). Previous comparison of MICs obtained by the YeastOne and CLSI methods provided comparable results (23, 24). Regarding the European Committee on Antimicrobial Susceptibility Testing (EUCAST-AFST) cutoff values for Candida and the echinocandins, this organization has established breakpoints for anidulafungin and C. albicans (≤0.03 μg/ml), C. glabrata (≤0.06 μg/ml), C. krusei (0.06 μg/ml), and C. tropicalis (0.06 μg/ml) and, more recently, for micafungin and C. albicans (≤0.01 μg/ml), C. glabrata (≤0.03 μg/ml), and C. parapsilosis (0.002 μg/ml) (http://www.EUCAST.org).
The ability of the ECVs encompassing 97.5% of the statistically modeled population to differentiate strains of Candida with acquired mechanisms of resistance to the echinocandins (e.g., mutations in fks1 or fks2) may be seen in the data presented in Table 4. The isolates in the collection for which the results are depicted in Table 4 were selected from global and population-based surveillance and reference collections to represent both WT and non-WT isolates with available MIC results for anidulafungin and micafungin, and all isolates were previously characterized regarding the presence or absence of mutations in the hot-spot (HS) regions of fks1 (C. albicans, C. glabrata, C. tropicalis, C. krusei, and C. dubliniensis) and fks2 (C. glabrata only) (6, 10, 25–27). A total of 51 isolates harbored mutations in either fks1 or fks2: 11 C. albicans isolates, 30 C. glabrata isolates, 6 C. tropicalis isolates, 3 C. krusei isolates, and 1 C. dubliniensis isolate. The ECVs for anidulafungin and C. albicans, C. glabrata, C. tropicalis, and C. dubliniensis were all 0.12 μg/ml, and the ECV for C. krusei was 0.25 μg/ml (Table 3 and Table 4). Using these cutoffs, the CLSI method correctly classified 47 (92.2%) of the 51 mutant strains as non-WT (for which the MIC was greater than the ECV) and 223 (97.0%) of 230 WT strains (with no fks mutation) as WT. The ECVs for micafungin and C. albicans, C. glabrata, C. tropicalis, C. krusei, and C. dubliniensis were 0.03 μg/ml, 0.03 μg/ml, 0.06 μg/ml, 0.25 μg/ml, and 0.12 μg/ml, respectively (Tables 3 and 4). Using these ECVs, the CLSI method with micafungin correctly classified all 51 mutant strains as non-WT and 194 (84.3%) of 230 WT strains (for which the MIC was less than or equal to the ECV) as WT. The reason for these misclassifications could be due to an alternative mechanism of resistance (WT as non-WT) or could simply be reflective of the crossing over of WT and non-WT MIC distributions; unfortunately, there is no enough clinical information about these strains.
TABLE 4.
Application of ECVs to MIC distributions of anidulafungin and micafungin for Candida strains tested for the presence of fks1 and fks2 mutations using the CLSI broth microdilution methoda
| Species (no. of isolates tested) | Antifungal agent | ECV (μg/ml) | No. of isolates by ECV category (no. of isolates showing mutations) |
|
|---|---|---|---|---|
| MIC ≤ ECV | MIC > ECV | |||
| C. albicans (52) | Anidulafungin | 0.12 | 42 (1) | 10 (10) |
| Micafungin | 0.03 | 31 (0) | 21 (11) | |
| C. glabrata (169) | Anidulafungin | 0.12 | 135 (2) | 34 (28) |
| Micafungin | 0.03 | 124 (0) | 45 (30) | |
| C. tropicalis (31) | Anidulafungin | 0.12 | 25 (1) | 6 (5) |
| Micafungin | 0.06 | 15 (0) | 16 (6) | |
| C. krusei (27) | Anidulafungin | 0.25 | 24 (0) | 3 (3) |
| Micafungin | 0.25 | 23 (0) | 4 (3) | |
| C. dubliniensis (2) | Anidulafungin | 0.12 | 1 (0) | 1 (1) |
| Micafungin | 0.12 | 1 (0) | 1 (1) | |
In summary, MIC data originating in 5 to 12 laboratories in 7 different countries have enabled us to propose species-specific ECVs for anidulafungin and micafungin and eight different species of Candida. We present ECVs that encompass 95%, 97.5%, and 99% of the statistically modeled population and recommend that the ECVs encompassing 97.5% be used to differentiate WT from non-WT strains of Candida for both echinocandins. The robust nature of these ECVs is demonstrated by comparison with those generated in another multicenter study using the YeastOne method as well as those generated in a single-center study using the CLSI method. Furthermore, we demonstrate the ability of the species-specific ECVs for both echinocandins to identify fks mutant strains in a population of 281 well-characterized Candida species. Although either anidulafungin or micafungin testing proved very sensitive in detecting the fks mutant strains, testing with micafungin tended to misclassify some isolates of C. albicans, C. glabrata, and C. tropicalis that did not harbor fks mutations as non-WT. The ECVs for anidulafungin and micafungin and the CLSI broth microdilution method will help in monitoring the emergence of echinocandin resistance among target species of Candida.
ACKNOWLEDGMENTS
We thank all the hospital laboratories that contributed Candida isolates to this study and Keile Wahle for excellent secretarial support.
J.F.M. received grants from Astellas, Basilea, and Merck not related to this study. He has been a consultant to Basilea and Merck and received speaker's fees from Merck and Gilead. L.O.-Z. has received research grants and speaking and consulting fees from Astellas, Merck, and Pfizer.
The findings and conclusions of this article are those of the authors and do not necessarily represent the views of the Centers for Disease Control and Prevention.
Footnotes
Published ahead of print 25 November 2013
REFERENCES
- 1.Cornely OA, Bassetti M, Calandra T, Garbino J, Kullberg BJ, Lortholary O, Meersseman W, Akova M, Arendrup MC, Arikan-Akdagli S, Bille J, Castagnola E, Cuenca-Estrella M, Donnelly JP, Groll AH, Herbrecht R, Hope WW, Jensen HE, Lass-Flörl C, Petrikkos G, Richardson MD, Roilides E, Verweij PE, Viscoli C, Ullmann AJ, ESCMID Fungal Infection Study Group 2012. ESCMID guideline for the diagnosis and management of Candida diseases 2012: non-neutropenic adult patients. Clin. Microbiol. Infect. 18:19–37. 10.1111/1469-0691.12039 [DOI] [PubMed] [Google Scholar]
- 2.Pappas PG, Kauffman CA, Andes D, Benjamin DK, Jr, Calandra TF, Edwards JE, Filler SG, Fischer JF, Kullberg BJ, Ostrosky-Zeichner L, Reboli AC, Rex JH, Walsh TJ, Sobel JD. 2009. Clinical practice guidelines for the management of candidiasis: 2009 update by the Infectious Diseases Society of America. Clin. Infect. Dis. 48:503–535. 10.1086/596757 [DOI] [PMC free article] [PubMed] [Google Scholar]
- 3.Ullmann AJ, Akova M, Herbrecht R, Viscoli C, Arendrup MC, Arikan-Akdagli S, Bassetti M, Bille J, Calandra T, Castagnola E, Cornely OA, Donnelly JP, Garbino J, Groll AH, Hope WW, Jensen HE, Kullberg BJ, Lass-Flörl C, Lortholary O, Meersseman W, Petrikkos G, Richardson MD, Roilides E, Verweij PE, Cuenca-Estrella M, ESCMID Fungal Infection Study Group 2012. ESCMID guideline for the diagnosis and management of Candida diseases: adults with haematological malignancies and after haematopoietic stem cell transplantation (HCT). Clin. Microbiol. Infect. 18:53–67. 10.1111/1469-0691.12041 [DOI] [PubMed] [Google Scholar]
- 4.Clinical and Laboratory Standards Institute 2008. M27-A3. Reference method for broth dilution antifungal susceptibility testing of yeasts, 3rd ed. Clinical and Laboratory Standards Institute, Wayne, PA [Google Scholar]
- 5.Clinical and Laboratory Standards Institute 2012. M27-S4. Reference method for broth dilution antifungal susceptibility testing of yeasts, 4th informational supplement. Clinical and Laboratory Standards Institute, Wayne, PA [Google Scholar]
- 6.Pfaller MA, Diekema DJ, Andes D, Arendrup MC, Brown SD, Lockhart SR, Motyl M, Perlin DS, CLSI Subcommittee for Antifungal Testing 2011. Clinical breakpoints for the echinocandins and Candida revisited: integration of molecular, clinical, and microbiological data to arrive at species-specific interpretive criteria. Drug Resist. Updat. 14:164–176. 10.1016/j.drup.2011.01.004 [DOI] [PubMed] [Google Scholar]
- 7.Pfaller MA, Diekema DJ. 2012. Progress in antifungal susceptibility testing of Candida spp. by use of Clinical and Laboratory Standards Institute broth microdilution methods, 2010 to 2012. J. Clin. Microbiol. 50:2846–2856. 10.1128/JCM.00937-12 [DOI] [PMC free article] [PubMed] [Google Scholar]
- 8.Pfaller MA, Boyken L, Hollis RJ, Kroeger J, Messer SA, Tendolkar S, Jones RN, Turnidge J, Diekema DJ. 2010. Wild-type MIC distributions and epidemiological cutoff values for the echinocandins and Candida spp. J. Clin. Microbiol. 48:52–56. 10.1128/JCM.01590-09 [DOI] [PMC free article] [PubMed] [Google Scholar]
- 9.Kahlmeter G, Brown DF, Goldstein FW, MacGowan AP, Mouton JW, Osterlund A, Rodloff A, Steinbakk M, Urbaskova P, Vatopoulos A. 2003. European harmonization of MIC breakpoints for antimicrobial susceptibility testing of bacteria. J. Antimicrob. Chemother. 52:145–148. 10.1093/jac/dkg312 [DOI] [PubMed] [Google Scholar]
- 10.Pfaller MA, Diekema DJ, Castanheira M, Jones RN. 2011. Definitions and epidemiology of Candida species not susceptible to echinocandins. Curr. Fungal Infect. Rep. 5:120–127. 10.1007/s12281-011-0053-y [DOI] [Google Scholar]
- 11.Simjee S, Silley P, Werling HO, Bywater R. 2008. Potential confusion regarding the term ‘resistance' in epidemiological surveys. J. Antimicrob. Chemother. 61:228–229. 10.1093/jac/dkm423 [DOI] [PubMed] [Google Scholar]
- 12.Turnidge J, Paterson DL. 2007. Setting and revising antibacterial susceptibility breakpoints. Clin. Microbiol. Rev. 20:391–408. 10.1128/CMR.00047-06 [DOI] [PMC free article] [PubMed] [Google Scholar]
- 13.Pfaller MA, Castanheira M, Diekema DJ, Messer SA, Jones RN. 2011. Triazole and echinocandin MIC distributions with epidemiological cutoff values for differentiation of wild-type strains from non-wild-type strains of six uncommon species of Candida. J. Clin. Microbiol. 49:3800–3804. 10.1128/JCM.05047-11 [DOI] [PMC free article] [PubMed] [Google Scholar]
- 14.Espinel-Ingroff A, Arendrup MC, Pfaller MA, Bonfietti LX, Bustamante B, Canton E, Chryssanthou E, Cuenca-Estrella M, Dannaoui E, Fothergill A, Fuller J, Gaustad P, Gonzalez GM, Guarro J, Lass-Flörl C, Lockhart SRG, St-Germain G, Meis JF, Moore CB, Ostrosky-Zeichner L, Pelaez T, Pukinskas SRBS, Szeszs MW, Turnidge J. 2013. Interlaboratory variability of caspofungin MICs for Candida spp. using CLSI and EUCAST methods: should the clinical laboratory be testing this agent? Antimicrob. Agents Chemother. 57:5836–5842. 10.1128/AAC.01519-13 [DOI] [PMC free article] [PubMed] [Google Scholar]
- 15.Clinical and Laboratory Standards Institute 2013. Minutes and agenda: Annual Meeting of Subcommittee for Antifungal Susceptibility Testing, Tampa, FL, 22 January 2013. Clinical and Laboratory Standards Institute, Wayne, PA [Google Scholar]
- 16.Espinel-Ingroff A, Chowdhary A, Gonzalez GM, Lass-Flörl C, Martin-Mazuelos E, Meis J, Pelaez T, Pfaller MA, Turnidge J. 2013. Multicenter study of isavuconazole MIC distributions and epidemiological cutoff values for Aspergillus spp. for the CLSI M38-A2 broth microdilution method. Antimicrob. Agents Chemother. 57:3823–3828. 10.1128/AAC.00636-13 [DOI] [PMC free article] [PubMed] [Google Scholar]
- 17.Canton E, Pemán J, Hervás D, Iñiguez C, Navarro D, Echeverría J, Martínez-Alarcón J, Fontanals D, Gomila-Sard B, Buendía B, Torroba L, Ayats J, Bratos A, Sánchez-Reus F, Fernández-Natal I, FUNGEMYCA Study Group 2012. Comparison of three statistical methods for establishing tentative wild-type population and epidemiological cutoff values for echinocandins, amphotericin B, flucytosine, and six Candida species as determined by the colorimetric Sensititre YeastOne method. J. Clin. Microbiol. 50:3921–3926. 10.1128/JCM.01730-12 [DOI] [PMC free article] [PubMed] [Google Scholar]
- 18.Turnidge J, Kahmeter G, Kronvall G. 2006. Statistical characterization of bacterial wild-type MIC value distributions and determination of epidemiological cutoff values. Clin. Microbiol. Infect. 12:418–425. 10.1111/j.1469-0691.2006.01377.x [DOI] [PubMed] [Google Scholar]
- 19.Turnidge J, Bordash G. 2007. Statistical methods for establishing quality control limits in Clinical and Laboratory Standards Institute susceptibility testing. Antimicrob. Agents Chemother. 51:2483–2488. 10.1128/AAC.01457-06 [DOI] [PMC free article] [PubMed] [Google Scholar]
- 20.Espinel-Ingroff A. 2003. In vitro antifungal activities of anidulafungin and micafungin, licensed agents and the investigational triazole posaconazole as determined by NCCLS methods for 12,052 fungal isolates: review of literature. Rev. Iberoam. Micol. 20:121–136 [PubMed] [Google Scholar]
- 21.Messer SA, Jones RN, Fritsche TR. 2006. International surveillance of Candida spp. and Aspergillus spp.: report from the SENTRY Antimicrobial Surveillance Program (2003). J. Clin. Microbiol. 44:1782–1787. 10.1128/JCM.44.5.1782-1787.2006 [DOI] [PMC free article] [PubMed] [Google Scholar]
- 22.Pfaller MA, Messer SA, Woosley LN, Jones RN, Castanheira M. 2013. Echinocandin and triazole antifungal susceptibility profiles for clinical opportunistic yeast and mold isolates collected from 2010 to 2011: application of new CLSI clinical breakpoints and epidemiological cutoff values for characterization of geographic and temporal trends of antifungal resistance. J. Clin. Microbiol. 51:2571–2581. 10.1128/JCM.00308-13 [DOI] [PMC free article] [PubMed] [Google Scholar]
- 23.Canton E, Pemán J, Gobernado M, Alvarez E, Baquero F, Cisterna R, Gil J, Martín-Mazuelos E, Rubio C, Sánchez-Sousa A, Serrano C. 2005. Sensititre YeastOne caspofungin susceptibility testing of Candida clinical isolates: correlation with results of NCCLS M27-A2 multicenter study. Antimicrob. Agents Chemother. 49:1604–1607. 10.1128/AAC.49.4.1604-1607.2005 [DOI] [PMC free article] [PubMed] [Google Scholar]
- 24.Pfaller MA, Chaturvedi V, Diekema DJ, Ghannoum MA, Holliday NM, Killian SB, Knapp CC, Messer SA, Miskov A, Ramani R. 2008. Clinical evaluation of the Sensititre YeastOne colorimetric antifungal panel for antifungal susceptibility testing of the echinocandins anidulafungin, caspofungin, and micafungin. J. Clin. Microbiol. 46:2155–2159. 10.1128/JCM.00493-08 [DOI] [PMC free article] [PubMed] [Google Scholar]
- 25.Arendrup MC, Garcia-Effron G, Lass-Flörl C, Lopez AG, Rodriguez-Tudela JL, Cuenca-Estrella M, Perlin DS. 2010. Echinocandin susceptibility testing of Candida species: comparison of EUCAST EDef 7.1, CLSI M27-A3, Etest, disk diffusion, and agar dilution methods with RPMI and Iso-Sensitest media. Antimicrob. Agents Chemother. 54:426–439. 10.1128/AAC.01256-09 [DOI] [PMC free article] [PubMed] [Google Scholar]
- 26.Pfaller MA, Castanheira M, Diekema DJ, Messer SA, Moet GJ, Jones RN. 2010. Comparison of EUCAST and Etest methods with the CLSI broth microdilution method for echinocandin susceptibility testing of Candida species. J. Clin. Microbiol. 48:1592–1599. 10.1128/JCM.02445-09 [DOI] [PMC free article] [PubMed] [Google Scholar]
- 27.Zimbeck AJ, Iqbal N, Ahlquist AM, Farley MM, Harrison LH, Chiller T, Lockhart SR. 2010. FKS mutations and elevated echinocandin MIC values among Candida glabrata isolates from US population-based surveillance. Antimicrob. Agents Chemother. 54:5042–5047. 10.1128/AAC.00836-10 [DOI] [PMC free article] [PubMed] [Google Scholar]