

Abstract
Bacillus subtilis is adaptable to many environments in part due to its ability to produce a broad range of bioactive compounds. One such compound, bacillaene, is a linear polyketide/nonribosomal peptide. The pks genes encode the enzymatic megacomplex that synthesizes bacillaene. The majority of pks genes appear to be organized as a giant operon (>74 kb from pksC-pksR). In previous work (P. D. Straight, M. A. Fischbach, C. T. Walsh, D. Z. Rudner, and R. Kolter, Proc. Natl. Acad. Sci. U. S. A. 104:305–310, 2007, doi:10.1073/pnas.0609073103), a deletion of the pks operon in B. subtilis was found to induce prodiginine production by Streptomyces coelicolor. Here, colonies of wild-type B. subtilis formed a spreading population that induced prodiginine production from Streptomyces lividans, suggesting differential regulation of pks genes and, as a result, bacillaene. While the parent colony showed widespread induction of pks expression among cells in the population, we found the spreading cells uniformly and transiently repressed the expression of the pks genes. To identify regulators that control pks genes, we first determined the pattern of pks gene expression in liquid culture. We next identified mutations in regulatory genes that disrupted the wild-type pattern of pks gene expression. We found that expression of the pks genes requires the master regulator of development, Spo0A, through its repression of AbrB and the stationary-phase regulator, CodY. Deletions of degU, comA, and scoC had moderate effects, disrupting the timing and level of pks gene expression. The observed patterns of expression suggest that complex regulation of bacillaene and other antibiotics optimizes competitive fitness for B. subtilis.
INTRODUCTION
Bacillus subtilis is a globally dispersed bacterial species that is competitive in diverse environments and produces numerous bioactive compounds. B. subtilis dedicates 4 to 5% of its genome to produce secondary metabolites (1). In particular, three massive gene clusters encode enzyme complexes for dedicated synthesis of their cognate products. Two of the gene clusters encode the nonribosomal peptide synthetases (NRPS) for surfactin (srfAA-srfAD; 27 kb) and plipastatin (ppsA-ppsE; 37 kb). Surfactin is a multifunctional lipopeptide that provides surfactant and signaling activities required for motility and biofilm development (2–4). Plipastatin is a lipopeptide with antifungal properties (5, 6). A third gene cluster (pksA-pksS; 78 kb) encodes machinery for the production of bacillaene, a hybrid nonribosomal peptide/polyketide (NRP/PK) produced by B. subtilis (7, 8).
Bacillaene is a multifunctional molecule that was first reported as a broad-spectrum antibacterial compound (9). The diverse functions of bacillaene are apparent from competition studies pairing B. subtilis with species of Streptomyces (7, 10, 11). Consistent with its antibiotic function, bacillaene inhibits Streptomyces avermitilis growth (7). In the case of Streptomyces coelicolor, which is resistant to growth inhibition, bacillaene suppresses antibiotic synthesis in competitive interactions (7, 10). Recently our laboratory has observed that bacillaene is critical for the survival of B. subtilis when challenged by Streptomyces sp. strain Mg1, a soil isolate with predatory-like activity (11). Streptomyces sp. strain Mg1 causes cellular lysis and disrupts the colony extracellular matrix of B. subtilis. Strains of B. subtilis are hypersensitive to the lytic activity when bacillaene synthesis is disrupted by deletion of the pks operon.
The importance of bacillaene for competitive fitness of B. subtilis raises the question of how the organism regulates pks gene expression and bacillaene biosynthesis. The pks gene cluster has been annotated as 16 genes, 5 of them encoding the multimodular synthetase (pksJ, pksL, pksM, pksN, and pksR) and another 10 genes encoding individual enzymes that function in trans to the assembly line (pksB-pksI and pksS) (Fig. 1A). The first 15 genes, pksA-pksR, are oriented in the forward direction (positive strand), and the last gene, pksS, is in the reverse direction (negative strand). In many cases, modular type I PKS, NRPS, and hybrid PKS-NRPS gene clusters include associated regulators that coordinate the expression of the synthesis genes (12, 13). The pksA gene sits adjacent to the gene cluster and encodes a putative TetR family regulatory protein (http://genolist.pasteur.fr/SubtiList/). PksA is predicted to function as a pathway-specific regulator of the pks genes, but the regulatory function has not been experimentally confirmed (14–16). In addition to pathway-specific regulation, secondary metabolic pathways are commonly controlled by global regulatory functions that respond to changes in nutrient conditions or environmental cues to activate different physiological responses (17, 18). Differentially regulated functions in B. subtilis include genetic competence, motility, biofilm formation, and sporulation, in addition to production of antibiotics and degradative enzymes (19). Regulation of developmental processes has been studied in detail for B. subtilis, and in many instances the regulatory functions are known to influence secondary metabolism (1, 19, 20). Studies of surfactin, bacilysin, and other metabolites highlight the integration of secondary metabolism with different physiological states (2, 4, 21, 22).
FIG 1.
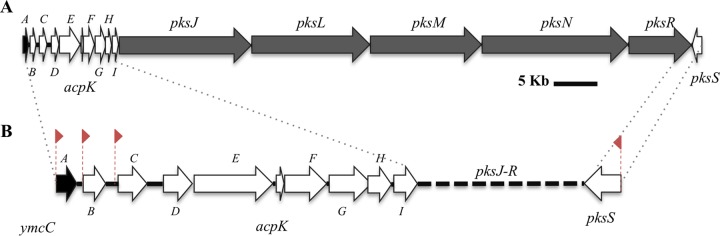
pks gene cluster in B. subtilis. (A) Sixteen genes from pksA to pksS (78.6 kb) comprise the pks gene cluster as annotated in the B. subtilis 168 genome. Dark gray arrows represent the genes encoding the multimodular PKS enzymes that synthesize bacillaene. White arrows represent genes encoding functions required in trans to the multimodular enzymes. The black arrow represents pksA, which encodes a predicted TetR family transcriptional regulator. Arrows are drawn to scale. (B) Expansion of the genes pksA-pksI and pksS highlight the intergenic regions (not to scale). Upshifts in gene expression reveal potential transcriptional control regions, indicated with red flags (23).
In the present study, we identified a competitive interaction with Streptomyces lividans that suggested differential regulation of bacillaene production between morphologically different subpopulations of B. subtilis. We investigated the regulation of pks gene transcription to determine whether bacillaene production is segregated in different B. subtilis subpopulations. Initially using liquid cultures, we show that the 5′ untranslated region (UTR) of pksC is active in promoting expression of the apparent pks operon, which extends nearly 75 kb from the pksC to pksR genes (http://subtiwiki.uni-goettingen.de/apps/expression/) (23). Also, we show that the gene annotated as pksA does not encode a pathway regulator for bacillaene. Using transcriptional reporters fused to the pksC promoter element, we identified multiple global regulators that influence expression of the pks genes. We show that Spo0A is required to activate pks gene expression through repression of the transition state regulator, AbrB (1, 24). Expression of pks genes is also dependent on CodY, which regulates metabolism in response to nutrient status and was recently shown to bind to multiple sites in the pks operon (25, 26). DegU, ComA, and ScoC are also required for full induction of pks gene expression. Using transcriptional reporters, we show that the expression of pks genes is homogeneously and transiently repressed in cells that spread toward S. lividans in a competitive interaction. Our data indicate that B. subtilis uses multiple regulatory functions to exert dynamic control of bacillaene production, which may benefit the overall competitive fitness of the colony.
MATERIALS AND METHODS
Bacterial strains, primers, media, and growth conditions.
Table 1 contains a list of primers used in this study. The undomesticated strain Bacillus subtilis NCIB 3610 was used for all of the experiments in this work. Unless otherwise stated, all B. subtilis strains were cultured at 37°C in CH medium (1% casein hydrolysate, 0.47% l-glutamate, 0.16% l-asparagine, 0.12% l-alanine, 1 mM KH2PO4, 25 mM NH4Cl, 0.22 mg/ml Na2SO4, 0.2 mg/ml NH4NO3, 1 μg/ml FeCl3 · 6H2O, 25 mg/liter CaCl2 · 2H2O, 50 mg/liter MgSO4, 15 mg/liter MnSO4 · H2O, 20 μg/ml l-tryptophan, pH 7.0), which is commonly used for consistent timing of developmental transitions and is optimal for live cell microscopy (27). To generate a uniform population of cells in the early exponential growth phase, overnight cultures of B. subtilis were diluted to an optical density at 600 nm (OD600) of 0.085, cultured to an OD600 of approximately 0.2, and rediluted to an OD600 of 0.085. This cycle was repeated three times before initiation of the experiments. Genetic manipulations of B. subtilis were initially made using the PY79 strain and then transduced via bacteriophage SPP1 into B. subtilis NCIB 3610 as previously described (28). All manipulations were confirmed by genomic extraction, amplification of genetic targets, and sequencing. Escherichia coli XL1-Blue was used for plasmid manipulations and storage. Antibiotics used in this study were chloramphenicol (5 μg/ml), spectinomycin (100 μg/ml), tetracycline (10 μg/ml), kanamycin (10 μg/ml), and MLS (1 μg/ml of erythromycin, 25 μg/ml of lincomycin).
TABLE 1.
Bacillus subtilis strains used in this study
| Strain | Relevant genotype | Source or reference |
|---|---|---|
| PSK0531 | Streptomyces lividans wild-type strain TK24 | Laboratory collection |
| PDS0066 | NCIB3610 wild type | Laboratory collection |
| PKS0212 | NCIB3610 pksR::yfp (spc) | 7 |
| PDS0184 | NCIB3610 pksA::kan | This study |
| PDS0480 | NCIB3610 pksA::kan lacA::pksA (mls) | This study |
| PDS0183 | NCIB3610 ΔpksA amyE::Phyperspac::pksA::lacI (cat) | This study |
| PDS0032 | NCIB3610 amyE::PpksB-yfp (cat) | This study |
| PDS0036 | NCIB3610 amyE::PpksC-yfp (cat) | This study |
| PDS0035 | NCIB3610 amyE::PpksS-yfp (cat) | This study |
| PDS0189 | NCIB3610 amyE::PpksB-lacZ (cat) | This study |
| PDS0227 | NCIB3610 amyE::PpksC-lacZ (cat) | This study |
| PDS0201 | NCIB3610 amyE::PpksS-lacZ (cat) | This study |
| PDS0430 | NCIB3610 amyE::PpksC-yfp (cat) lacA::Phag-cfp (mls) | This study |
| PDS0432 | NCIB3610 amyE::PpksC-yfp (cat) lacA::PtapA-cfp (mls) | This study |
| PDS0431 | NCIB3610 amyE::PpksC-yfp (cat) lacA::PsspB-cfp (mls) | This study |
| PDS0327 | NCIB3610 Δspo0A::mls | This study |
| PDS0382 | NCIB3610 ΔdegU::tet | R. Kolter laboratory |
| PDS0247 | NCIB3610 ΔabrB::tet | R. Kolter laboratory |
| PDS0262 | NCIB3610 Δabh::kan | R. Kolter laboratory |
| PDS0512 | NCIB3610 ΔcomA::cat | This study |
| PDS0368 | NCIB3610 ΔscoC::kan | This study |
| PDS0525 | NCIB3610 ΔcodY::mls | This study |
| PDS0337 | NCIB3610 ΔsigD::mls | D. Kearns laboratory |
| PDS0311 | NCIB3610 Δspo0A::mls ΔabrB::tet amyE::PpksC:lacZ (cat) | This study |
Coculture assays.
G7 plates (1.5% Bacto agar, 1% Bacto malt extract, 0.4% yeast extract, and 0.4% d-glucose buffered with 100 mM morpholinepropanesulfonic acid [MOPS] and 5 mM potassium phosphate) were used to coculture B. subtilis and Streptomyces lividans. 5-Bromo-4-chloro-3-indolyl-β-d-galactopyranoside (X-Gal) (300 μg/ml) was added to the plates when needed. Briefly, 2 μl of S. lividans spores (107 spores/ml) was spotted on solid media and incubated at 30°C for 12 h. Following initial incubation of S. lividans, 1.5-μl aliquots of a B. subtilis overnight culture were spotted in a cross-wise pattern onto the S. lividans cultures, and plates were returned to incubation at 30°C. Taking as time zero when B. subtilis was spotted, the coculture was observed over time and images were captured at the indicated time points.
Extraction and quantification of bacillaene.
Time course experiments were done in triplicate with cells growing at 30°C in 500 ml of CH medium under constant agitation (250 rpm) and complete darkness. To extract bacillaene, 15 ml of the culture supernatants was mixed 1:1 with dichloromethane. Bacillaene was recovered by evaporation of the organic phase followed by resuspension in methanol. The methanol was then evaporated and the samples resuspended in a buffer of 65% 20 mM sodium phosphate–35% acetonitrile. High-performance liquid chromatography (HPLC) analysis was performed with a C18 reverse-phase column (Phenomenex). Samples were eluted with a gradient of 35% to 40% acetonitrile and 60% to 65% of 20 mM sodium phosphate. Bacillaene was detected by UV absorption using a wavelength of 361 nm as previously reported (9). The amount of bacillaene in each sample was determined by integrating the area under the relevant peaks on the elution chromatograph. We confirmed the specificity of bacillaene peaks in the HPLC chromatographs by comparison to a sample from a B. subtilis Δpks strain. Liquid chromatography-mass spectrometry (LC-MS) analysis was used to confirm that the relevant peaks were all different isoforms of bacillaene (not shown). Quantitative data were normalized to the sample cell density (OD600) in order to compare synthesis of the molecule over time between strains.
Quantitative RT-PCR (qRT-PCR).
Cell samples were stabilized using RNAprotect bacteria reagent (Qiagen), and RNA isolation was performed using an RNeasy mini kit according to the manufacturer's instructions. Subsequently, RNA samples were treated with a Turbo DNA-free kit (Applied Biosystems) to remove DNA traces, and total RNA was quantified. A Thermo Scientific Dynamo Flash SYBR green quantitative PCR (qPCR) kit was used with target-specific primers listed in Table 2 and 200 μg of total RNA as the template to synthesize cDNA. After the reverse transcription (RT) step, quantitative PCR was done in a CFX96 Touch real-time PCR thermocycler (Bio-Rad). The protocol was denaturation at 95.0°C for 15 min; 39 cycles of denaturation at 94.0°C for 10 s, annealing at 58.0°C for 25 s, and extension at 72.0°C for 30 s; and a final melting curve from 60.0°C to 95.0°C for 6 min. We determined that gyrB transcript abundance per cell did not significantly change from an OD600 of 0.2 to 6.8 (not shown). Consequently, we used gyrB as the reference gene. The samples were run in triplicate for each target gene, and negative controls were included for each sample as reaction mixtures with total RNA after DNase treatment (no RT performed). Primer efficiency and quantification cycle (Cq) values were calculated using the software LinReg (29). Gene study analysis for comparison between independent experiments was performed based on the primer efficiency calculated by the software LinReg and the analysis of the CFX Manager software (Bio-Rad).
TABLE 2.
Primers used in this study
| Name | Sequence (5′–3′) |
|---|---|
| pksA KO_P1 | GATGGCCGCGATAAAAGTAA |
| pksA KO_P2 | CCTATCACCTCAAATGGTTCGCTGCGTTGCTTCTGCAATTTGTT |
| pksA KO_P3 | CGAGCGCCTACGAGGAATTTGTATCGGCGTGGAAGATACACGTGAG |
| pksA KO_P4 | AACACCTTCTATGTAATCATTTTCG |
| pksA compl-F | ATGCATGCTAGCATCTCGAGAACCCAAAACGCAATTTCAC |
| pksA compl-R | AACGTCCCGGGGAGCTCATGAATTCCAAGAATCGCTTTTCGCAC |
| pksA-90_FHIII | TAAAGCTTAATCCATTCCCCTCTTTTC |
| pksA-90_RSalI | TTAAGTCGACCAACAAGAATCGCTTT |
| pA-F(EcoRI) | TTAGAATTCATAAGCGATCGATATACC |
| pA-R(HindIII) | TAGGAAGCTTAGCTTTATTGTAACAAGAAA |
| pB-F(EcoRI) | CTAGAATTCCTGAGAGACTTTACGC |
| pB-R(HindIII) | ATTCAAGCTTATCATGTAAAGTTCTTAAAC |
| pC-F(EcoRI) | TTAGAATTCCCATTCGATAAAGGAT |
| pC-R(HindIII) | TATGAAGCTTGATTAGTAGATGTGTTTCAC |
| pS-F(EcoRI) | AATGAATTCGCGCTAATAGGGTAAATAGA |
| pS-R(HindIII) | TATAAAGCTTGCTATACGCAGTACGAATC |
| rtPCR_pksC_1 | AAAGCCGCATCTCTTTTTGA |
| rtPCR_pksC_2 | GCATGAAGGAACTCCTCGAA |
| qPCR-pksE1 | TACGTGAGCTGGATGCAAAG |
| qPCR-pksE2 | ATGCTTCGGGTTTTGTTCAG |
| qPCR-pksR-F | ACAGCGTAACGGAATTTTGG |
| qPCR-pksR-R | TTGATTGCCCTTCCTTATCG |
| gyrB qPCR_F | GGGCAACTCAGAAGCACGGACG |
| gyrB qPCR_R | GCCATTCTTGCTCTTGCCGCC |
Western blotting.
Cell growth conditions are the same as those described for extraction and quantification of bacillaene (described above). Cell pellets from each time point (15 ml) were lysed by incubation in 500 μl of lysis buffer [50 mM Tris, pH 7.5, 200 mM NaCl, 0.5 mM EDTA, 5 mM MgCl2, 1 mg/ml lysozyme, 1 mM 4-(2-aminoethyl)benzenesulfonylfluoride hydrochloride (AEBSF), 1 mM dithiothreitol (DTT)] at 37°C for 15 min. After treatment, protein concentration was measured by Bradford assay (Bio-Rad protein assay), and lysates were diluted to 1 mg/ml of total protein. Addition of 2× loading buffer in a 1:1 ratio and heating at 100°C for 5 min was done before loading 30 μl of the samples in 8% acrylamide gel for SDS-PAGE. Proteins were transferred onto an Immobilon polyvinylidene difluoride (PVDF) membrane (Sigma). Rabbit anti-green fluorescent protein (GFP; 1:1,000) and goat anti-rabbit horseradish peroxidase (HRP; 1:5,000) (Invitrogen) served as primary and secondary antibody, respectively. The blotting was visualized using Pierce ECL Western blotting substrate (Thermo Scientific) according to the manufacturer's instructions.
Fluorescence microscopy.
Samples from shaken liquid cultures in CH medium were taken for fluorescence imaging, centrifuged at 8,000 rpm, and washed once with phosphate-buffered saline (PBS). Cells were resuspended in 20 μM 1-(4-trimethylammoniumphenyl)-6-phenyl-1,3,5-hexatriene p-toluenesulfonate (TMA-DPH) (Molecular Probes), and fluorescence images were captured using a Nikon Ti-E inverted microscope equipped with a CFI Plan Apo lambda DM 100× objective, TI-DH diascopic illuminator, and a CoolSNAP HQ2 monochrome camera. Exposure time was 2,000 ms for yellow fluorescent protein (YFP), 200 ms for cyan fluorescent protein (CFP), and 1,000 ms for TMA. The NIS-elements AR software was used to capture and process the images identically for comparative analysis. Samples from solid media were scraped, dissolved in PBS, passed repeated times through a 25-gauge, 1.5-inch-long needle to disrupt aggregated cells, and centrifuged at 8,000 rpm. All subsequent steps were the same as those described above for samples from liquid medium.
Construction of pksA mutants.
Deletion of pksA was performed by long-flanking homology PCR, using the primers pksA KO_P1, pksA KO_P2, pksA KO_P3, and pksA KO_P4 (Table 2) to amplify the region flanking pksA and the intervening kanamycin cassette (30). To overexpress pksA, primer pair pksA-90_FHIII/pksA-90_RSalI was used to amplify pksA. The amplified regions were cut with the restriction enzymes HindIII and SalI (NEB) and ligated with T4 ligase (NEB) into pPST001 (amyE::Phyperspac lacI cat amp). The plasmid was recovered by transformation into E. coli XL1-Blue, transformed into B. subtilis PY79, and transduced into strain PDS0184 (Table 1) as previously described (28). For pksA complementation, pksA compl-F/pksA compl-R primers (Table 2) were used to clone the pksA gene with 203 bases of upstream sequence into pDR183 (lacA::mls amp) by enzymatic assembly as previously described (31). Transformation into E. coli XL1-Blue and B. subtilis PY79 and transduction into the strain PDS0184 (Table 1) were performed as described above.
Transcriptional fusions of pks promoters.
Primer pairs pB-F(EcoRI)/pB-R(HindIII), pC-F(EcoRI)/pC-R(HindIII), and pS-F(EcoRI)/pS-R(HindIII) (Table 2) were used to amplify 300 to 500 bp upstream of pksA, pksB, pksC, and pksS, respectively. The amplified regions were cut with the restriction enzymes EcoRI and HindIII (NEB) and ligated with T4 ligase (NEB) into pCW001 (amyE::yfp cat amp) and pDG1661 (amyE::lacZ cat amp). The transformations were performed using E. coli XL1-Blue for recovery of the plasmids. Subsequent transformation into PY79 and transduction into B. subtilis NCIB 3610 strains were performed as previously described (28). Recovered clones were grown in CH medium for subsequent analysis by fluorescence microscopy and β-galactosidase assays.
β-Galactosidase assays.
Samples were taken over time and cell density (OD600) was measured. β-Galactosidase assays were done as previously described by Miller (32). Briefly, 1-ml samples were lysed with Z buffer (60 mM Na2HPO4 · 7H2O, 40 mM NaH2PO4 · H2O, 10 mM KCl, 1 mM MgSO4 · 7H2O) that contained 0.27% β-mercaptoethanol and lysozyme (200 μg/ml) at 30°C for 20 min. Serial dilutions of the samples then were done to find an optimal range for colorimetric detection with o-nitrophenyl-β-d-galactopyranoside (ONPG) (400 μg) at OD420 and OD550. The values are reported in Miller units (MU).
RESULTS
Coculture of B. subtilis with Streptomyces lividans suggests that bacillaene synthesis is inactive within spreading populations of B. subtilis.
In a previous study, we found that a bacillaene-deficient B. subtilis strain (ΔpksB-R mutant; here called the Δpks mutant) induces the production of red-pigmented prodiginines (RED) by S. coelicolor (7, 10). Based on the observed pattern of induction, we associate RED with the absence of bacillaene in our coculture assays. In the present study, we plated colonies of S. lividans, which also encodes the RED genes, adjacent to wild-type B. subtilis colonies (33). Over the course of 4 days, the B. subtilis colonies spread on the plates toward the S. lividans colonies (Fig. 2). We observed that the RED pigment was induced where the spreading B. subtilis population contacts the colonies of S. lividans. The observed RED induction is similar to prior observations using bacillaene-deficient Δpks strains with S. coelicolor. The presence of RED suggested the possibility that the spreading cells do not produce bacillaene and raised the question of whether differential expression of the pks genes occurred in different subpopulations of B. subtilis.
FIG 2.
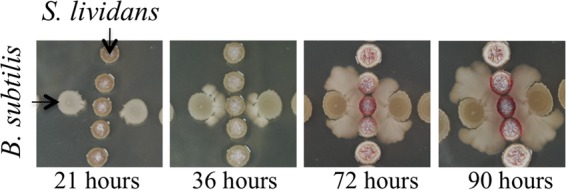
Induction of RED pigment by S. lividans is associated with absence of bacillaene. B. subtilis was spotted cross-wise with S. lividans inoculated 12 h prior from a spore suspension. Time zero corresponded to inoculation of B. subtilis. Initially, both species formed round colonies. After 21 h, the B. subtilis colonies began to migrate toward S. lividans. Upon contact with B. subtilis (36 to 72 h), S. lividans induced prodiginines (RED pigment), which are enhanced with extended incubation (90 h). No RED pigment is detected in the absence of colony contact in the time frame studied. The images shown represent the results of multiple experiments done in duplicate.
Bacillaene production peaks at the onset of stationary phase in liquid culture.
To understand the regulatory functions that control bacillaene production, we first used classical growth in liquid culture to monitor the pattern of bacillaene synthesis and to identify the relevant regulatory elements. In previous work, fluorescence microscopy of individual Pks proteins fused to yellow fluorescent protein (YFP) and cyan fluorescent protein (CFP) revealed that the bacillaene megacomplex synthetase accumulates within B. subtilis cells as cultures approach high cell density (7). This pattern of megacomplex assembly suggests that regulation of bacillaene synthesis is coordinated with cellular growth. To build a comprehensive view of bacillaene synthesis, we sought to determine whether pks gene expression and bacillaene secretion follow a pattern similar to that observed for megacomplex assembly. Thus, we monitored bacillaene synthesis, megacomplex formation, and pks gene expression in samples taken from a liquid culture of the strain PKS0212, which expressed YFP fused to the C-terminal end of the PksR protein (Fig. 3) (7). We chose to use PksR as a representative of the assembly-line enzymes required for bacillaene synthesis because the pksR gene resides at the 3′ end of the nearly 75-kb pks operon, as described for the pks gene cluster in the SubtiExpress database (http://subtiwiki.uni-goettingen.de/apps/expression/) (23). As the final product transcribed from the pks operon, we postulated that the accumulation of PksR protein approximates the amount of completely assembled enzymatic complexes within the cell. B. subtilis PSK0212 cultures growing in CH medium at 30°C were sampled multiple times during a 15-h period and monitored using three approaches. First, we used HPLC to quantitate bacillaene in the culture supernatant (Fig. 3A). Second, we used the PksR-YFP chimera to monitor the protein accumulation by Western blotting (Fig. 3B) and the formation of a megacomplex by fluorescence microscopy (Fig. 3C) (7). Third, we measured the abundance of three transcripts that span the length of the operon, pksC, pksE, and pksR, by quantitative RT-PCR (qRT-PCR) to determine the pattern of pks gene expression (Fig. 3D).
FIG 3.

Bacillaene production during liquid culture of B. subtilis NCIB 3610. Strain PSK0212 (PksR-YFP) was cultured in CH medium (30°C) and sampled during a 15-h period. All quantitative data shown are average values with standard deviations from triplicate experiments. (A) Growth curve of PSK0212 and HPLC quantitation of bacillaene. Equal culture volumes were sampled for OD600 measurements (circles). Bacillaene extracted from cell-free supernatants was quantitated by HPLC (triangles) as mAU (at a wavelength of 361 nm) divided by the OD600. Peak bacillaene accumulation per OD600 unit was detected at an OD600 of 4.2. (B) Western blot (α-GFP) of PksR-YFP from B. subtilis cell lysates. A single PksR-YFP band (indicated with an arrow) was detected at low cell densities and increased in intensity to a maximal level observed at an OD600 of 1.8 to 2.7. The signal intensity for PksR-YFP decreased at higher cell density and lower-molecular-mass forms appeared, suggesting degradation of PksR. (C) Upper panels show fluorescence images of PksR-YFP (green) in cells stained with TMA-DPH (red) to visualize membranes. Lower panels show phase contrast images of cells. PksR-YFP signal intensity and number changed with cell density. Maximal intensity was observed at the end of the log phase (OD600, 1.8) and was diminished at high cell density (OD600, 6.4). Scale bar, 3 μM. (D) qRT-PCR of representative pks genes. Cq values were determined for pksC, pksE, and pksR and normalized using the Cq for gyrB. Fold expression values reported are relative to the wild-type sample with the lowest cell density (OD600, 0.2) for each data set. The maximal fold expression for each transcript occurred at the time point at which the OD600 was 1.8.
The production of bacillaene by B. subtilis followed a pattern typical of that of many antibiotics produced during the transition from exponential growth to stationary phase (1, 34, 35). Bacillaene was not detected by HPLC in cultures of low cell density (OD600, <0.5). However, the amount of bacillaene per unit OD600 in the culture broth increased over time until the cells reached entry into stationary phase (Fig. 3A). The transition from exponential to stationary phase in CH medium occurred above an OD600 of ∼1.5 under the culture conditions used. Above this cell density, the increase in detectable bacillaene per unit OD600 was pronounced, reaching a peak accumulation at an OD600 of 4.2. Upon further incubation, the culture supernatants declined in bacillaene/unit OD600, suggesting that active synthesis is diminished as cells progress into stationary phase.
We hypothesized that the rate of bacillaene synthesis would change with cell density if the megacomplex enzymes underwent assembly and subsequent turnover or inactivation during the course of growth. In a prior study, PksR-YFP was found to increase with cell density up to an OD600 of 1.7 (7). Here, we extended the cultures to an OD600 of 6.8 in order to track the protein during stationary phase. We examined the levels of PksR-YFP in cells taken from the culture at the same time points as the samples taken for HPLC (Fig. 3A). Equivalent amounts of protein from whole-cell lysates were probed with an anti-GFP antibody to detect the presence of PksR-YFP. At low culture density, PksR-YFP was below the level of detection in our Western blot analysis, consistent with previous results (7). However, a band corresponding to 311 kDa, the expected molecular mass of the PksR-YFP fusion, was readily detected at an OD600 above 0.9 and reached peak intensity between an OD600 of 1.8 and 2.7, corresponding to the stationary-phase transition. A second high-molecular-mass band became visible from an OD600 of 1.8. The higher-molecular-mass PksR band may represent a modified form of PksR-YFP. Upon further incubation, PksR appears to be processed or degraded, as seen by the diminished signal of higher- and lower-molecular-mass bands on the Western blot (Fig. 3B).
The diminished PksR-YFP signal is consistent with the enzymes being turned over during stationary-phase culture, which would account for reduced bacillaene production in culture. We predicted that the fluorescent signal from PksR-YFP in assembled megacomplexes would decline in cultures of stationary-phase cells in accord with degradation of PksR-YFP. Using the same culture conditions as those described above, we examined cells expressing PksR-YFP by fluorescence microscopy to monitor the assembly of megacomplexes and their subsequent disruption. As seen in Fig. 3C, megacomplexes became visible as fluorescent foci within cells grown to intermediate cell density (OD600 of 1.8). At higher cell density, fewer PksR-YFP-positive cells were observed, and the overall intensity of the signal per cell is reduced (OD600 of 6.6). We counted cells with detectable, punctate YFP signal at each sample point and found that cells positive for megacomplexes first increased and then reduced to less than 50% of the population at high OD600 (see Table S1 in the supplemental material). However, an intense fluorescent signal persists for a percentage of the cells at high cell density. Whether these cells actively produce bacillaene is unknown. Comparison of bacillaene production in Fig. 3A to the fluorescence signal in Fig. 3C reveals a consistent pattern of megacomplex assembly and bacillaene synthesis that peaks during the transition to stationary phase and decreases upon continued incubation.
Antibiotic biosynthesis is commonly regulated by transcriptional activation of the biosynthetic gene clusters during transition from exponential to stationary growth phase. We next sought to determine if the pks genes are expressed in a pattern similar to the pattern of bacillaene production. A recent study of global gene expression under many different growth conditions suggests that the pks genes are expressed as a single operon from pksC to pksR (23). We selected three open reading frames within the apparent pks operon for targeted expression analysis. Two of the genes, pksC and pksE, are positioned near the 5′ end of the pks operon (Fig. 1A). The third gene we analyzed, pksR, is the final open reading frame (ORF) before the predicted transcriptional terminator and encodes a multimodular PKS enzyme. To compare their patterns of expression at the beginning and end of the apparent operon, equivalent amounts of total RNA were used to measure relative amounts of transcripts for pksC, pksE, and pksR using qRT-PCR. Here, we found that all of the pks genes followed the same expression pattern (Fig. 3D). The transcripts were at the lowest level during exponential growth and peaked near the transition to stationary phase (OD600, 1.8). Consistent with the bacillaene and PksR-YFP results, pks transcripts diminished as cells progressed through stationary phase. This pattern of pks gene expression and bacillaene synthesis suggests that the production of bacillaene is tied to the levels of pks transcript in the cells.
The TetR family protein PksA is not involved in bacillaene regulation.
Many loci that encode assembly-line enzyme complexes also encode transcription factors that control the expression of the biosynthetic genes (12, 36, 37). The pksA gene, located adjacent to the pks gene cluster, encodes a putative TetR family regulatory protein that is predicted to function as the associated regulator of the pks genes (14–16). To determine whether PksA regulates pks gene expression, we replaced the endogenous pksA gene (ΔpksA) with a kanamycin resistance gene and examined the effect on pks gene transcripts. We measured the pksC, pksE, and pksR transcripts by qRT-PCR of the wild-type and ΔpksA strains during the induction phase of pks gene expression (OD600, 0.2 to 1.8) (Fig. 4). The transcripts of all three genes increased severalfold for both wild-type and ΔpksA strains as cultures exited log phase (OD600, 1.8) (Fig. 4). We complemented the ΔpksA mutation with insertion of the pksA gene at the amyE locus. The complemented strain induced pks gene expression in a pattern similar to that of the ΔpksA and wild-type strains (Fig. 4). In addition, the ΔpksA deletion had no discernible effect on bacillaene production as determined by HPLC (see Fig. S1A in the supplemental material). The absence of a phenotype for the ΔpksA mutant does not preclude the function of PksA as a repressor of pks gene expression. To determine if overexpression of pksA would repress pks gene expression, we introduced an isopropyl-β-d-thiogalactopyranoside (IPTG)-inducible copy of pksA into the ΔpksA strain and quantitated pksC and pksR transcripts. No significant effect on either pks transcript was detected in the pksA overexpression condition, despite a 35-fold elevation in abundance of pksA transcript (see Fig. S1B). Thus, neither deletion nor overexpression of pksA significantly perturbed the induction of the pks genes during growth of B. subtilis, leading us to conclude that the target of PksA regulation is not the pks operon.
FIG 4.
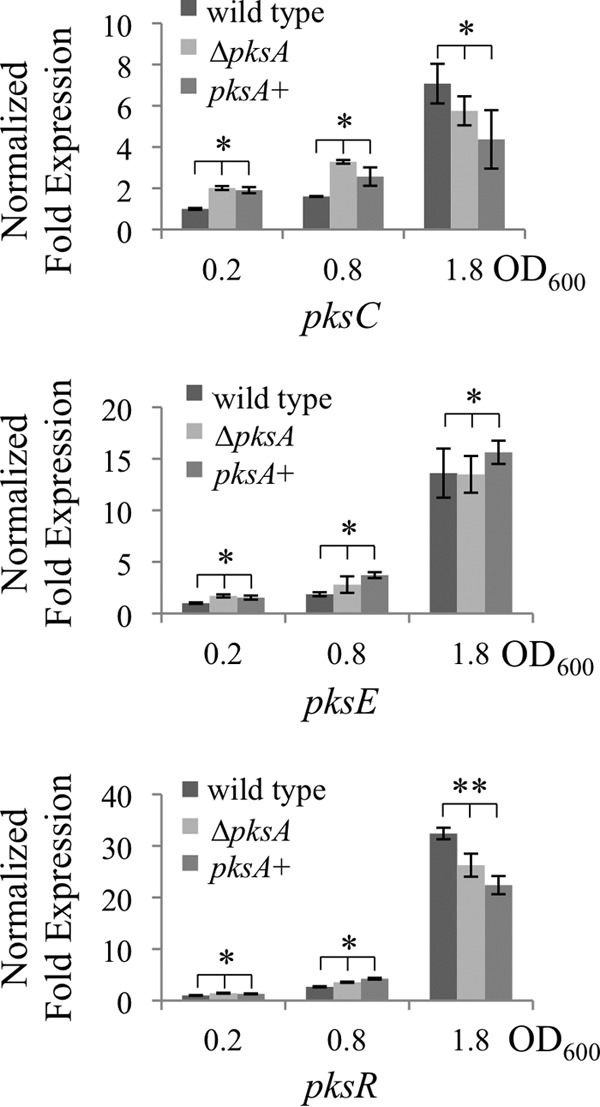
PksA function is unrelated to regulation of bacillaene synthesis. qRT-PCR data are presented as described for Fig. 3D. The pksC, pksE, and pksR transcripts measured by qRT-PCR were induced in wild-type, ΔpksA, and the ΔpksA genetically complemented mutant (pksA+) strains. Comparison of low (0.2), middle (0.8), and high (1.8) OD600 values showed induction during growth. Two-factor analysis of variance showed no significant effect of the ΔpksA and pksA+ genetic background on the pks genes tested (*, P > 0.05; **, P > 0.01).
The promoter PpksC controls expression of the pks gene cluster.
Collectively, these data indicate that the regulation of the pks operon is coupled to cellular growth by an undetermined mechanism. To identify regulatory functions that activate bacillaene production, we first generated reporters for transcriptional activation of the pks operon. Based on a previous report of B. subtilis global gene expression, three putative upstream regulatory sequences are active within the pks gene cluster, PpksB, PpksC, and PpksS (Fig. 1B) (http://subtiwiki.uni-goettingen.de/apps/expression/) (23). We isolated the 5′UTRs of pksB, pksC, and pksS and fused them to the yfp and lacZ genes for fluorescence and β-galactosidase assays, respectively. Low levels of activity from the pksB and pksS promoters were detected by fluorescence microscopy, and the intensity of signal did not change during growth (Fig. 5A). In contrast, both fluorescence microscopy and β-galactosidase assays revealed that the pksC promoter is highly active and induced at the same relative cell density as that described above (Fig. 5A and B). Thus, the PpksC reporter fusions provide a tool to determine patterns of pks gene expression in cultures of B. subtilis.
FIG 5.

Activity of promoters of the pks gene cluster. (A) Fluorescence of transcriptional reporters for pksB, pksC, and pksS promoters fused to yfp. Cells growing in liquid CH medium at 37°C were taken at the indicated culture densities to observe activation of the promoters. Images represent several microscopic fields from samples of two independent experiments. TMA-DPH-stained membranes are red. Promoter-YFP fusions are green. Scale bar, 3 μm. (B) β-Galactosidase assay of the PpksC-lacZ strain. The pattern of β-galactosidase activity indicates the pksC promoter is activated during the transition to stationary phase. Miller units are averages from triplicate experiments with reported standard deviations. (C) Coculture of S. lividans and B. subtilis (PpksC-lacZ). G7 plates (300 μg/ml of X-gal) were inoculated with S. lividans and B. subtilis as described in the legend to Fig. 2. PpksC-lacZ activity was differentially localized between spreading and static cells in the colony. S. lividans endogenous β-galactosidase activity results in blue colonies. Images represent three independent experiments, each time performed in duplicate.
Differential activation of PpksC in colonies and motile subpopulations.
We predicted that if bacillaene synthesis were inactivated in the spreading populations, as we hypothesized based on the induction of RED synthesis by S. lividans (Fig. 2), then PpksC-lacZ activity would be differentially localized between the parent colony and the spreading subpopulation. B. subtilis carrying the PpksC-lacZ reporter was challenged with S. lividans on plates containing X-Gal. As previously described, the B. subtilis cells spread toward S. lividans on the agar plate, and PpksC-lacZ was differentially activated within the colonies (Fig. 5C). Endogenous β-galactosidase activity of S. lividans produced blue streptomycete colonies and obscured the visibility of RED pigment in these assays (38). However, β-galactosidase activity from B. subtilis was coincident with the primary colony. As seen in Fig. 5C, at early time points (24 h) the β-galactosidase activity was absent from the spreading population of cells. These results supported the observation that the spreading cells are inactive for bacillaene production. Upon further incubation (48 h), PpksC-lacZ activity increased on the interior of the spreading population but remained repressed at the leading edge where contact with S. lividans is initiated. We conclude from these data that the pks operon is likely to be activated by regulatory pathways that at least transiently differentiate highly motile from static populations.
Multiple regulatory networks control pks gene expression.
B. subtilis uses a complex network of regulatory proteins to control antibiotic production, developmental transitions, and specification of cell fates within a population (1, 19, 39). To identify regulatory functions that control pks gene expression, we surveyed induction of pks gene expression in several strains carrying gene deletions for regulators that control antibiotic production, developmental transitions, or nutrient stress response. We used liquid cultures of B. subtilis for standardized comparison of pks expression levels between mutant strains. Several strains were compared to the wild type for levels of pks gene expression (Fig. 6). A moderate reduction was observed with ΔdegU and ΔcomA strains, which showed pronounced disruption of induced pks gene expression as cells transition from exponential to stationary phase (OD600, 1.8) (Fig. 6A). In contrast, moderate elevation of pksC expression was found for the intermediate sample (OD600, 0.9) in the ΔscoC mutant strain, which subsequently failed to reach wild-type levels of transcript at high cell density. Reproducibly, the Δspo0A and ΔcodY strains had the lowest detectable level of pksC expression compared to the wild type, suggesting that pks gene expression requires dual activation through CodY and Spo0A.
FIG 6.
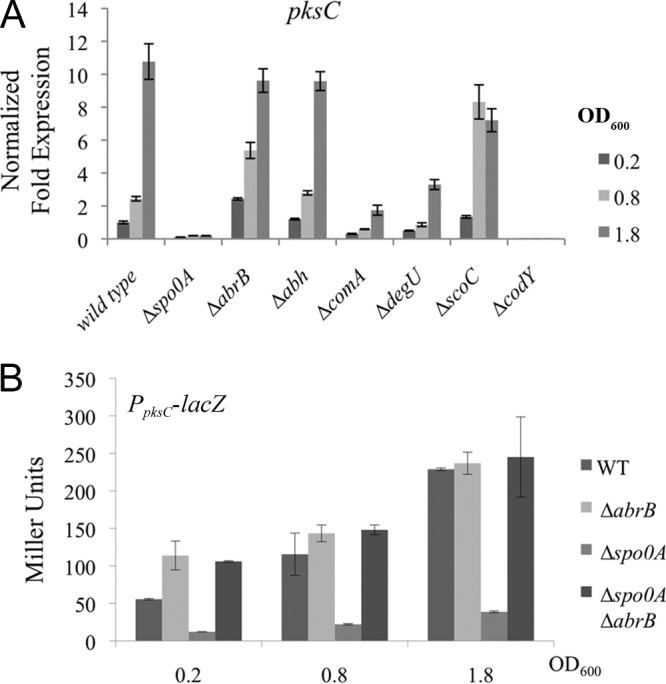
Regulatory pathways for pks gene expression. (A) Quantitative RT-PCR of pksC mRNA in liquid cultures of Δspo0A, ΔabrB, Δabh, ΔcomA, ΔdegU, ΔscoC, and ΔcodY strains. Results of qRT-PCR are reported as described for Fig. 3D. Induction of pksC expression is reduced in Δspo0A, ΔcomA, ΔdegU, and ΔcodY strains. The ΔabrB strain maintains pksC induction. Average values and standard deviations from triplicate independent experiments are reported. (B) β-Galactosidase assay of PpksC-lacZ activity in the Δspo0A and ΔabrB single mutants and the Δspo0A ΔabrB double mutant. Cells were cultured in liquid CH medium at 37°C, and cellular equivalents were compared from samples taken at the indicated OD600. Deletion of abrB restored PpksC activation to the Δspo0A strain. Miller units are averaged from triplicate experiments with standard deviations reported.
Spo0A represses transcription of AbrB, which controls multiple antibiotic biosynthesis pathways and other transition state processes in B. subtilis (24, 40–42). However, a ΔabrB strain showed a pks gene expression pattern similar to that of the wild type (Fig. 6A). Because the Δspo0A strain disrupted pks gene expression, we tested whether a Δspo0A-dependent block to pks expression requires AbrB by determining the level of pks gene expression in a Δspo0A ΔabrB double mutant strain (Fig. 6B). To do this, we used the PpksC-lacZ strain in order to accommodate existing markers for strain construction. Strains with deletions of the spo0A and abrB genes, individually and in combination, were used to quantitate pksC promoter activity by β-galactosidase assay. The deletion of abrB in a Δspo0A background restored promoter activity of pksC at all time points. We conclude that pks expression is activated by Spo0A through repression of AbrB, a pattern shared by several B. subtilis gene clusters encoding antibiotics (1, 24).
Heterogeneous PpksC activity in liquid cultures of B. subtilis.
Spo0A and CodY are stationary-phase regulators with functions that intersect with DegU-, ComA-, and ScoC-dependent processes, including transitions between motile populations, antibiotic production, extracellular matrix production, and sporulation (22, 26, 43–46). We generated PpksC-yfp reporter strains that also encode fusions of cfp to reporters for motility, extracellular matrix, and sporulation to determine whether the pks genes are coordinately controlled by these pleiotropic regulators during the switch between static and spreading populations. We used a fusion of the promoter for the hag gene (Phag-cfp), which encodes the principal flagellar protein, to indicate σD-dependent motile cells (39, 47). A PtapA-cfp fusion was used to indicate biofilm matrix-producing subpopulations. The tapA gene encodes a component of the biofilm extracellular matrix and is dependent on Spo0A repression of AbrB for activation (24, 39, 48). In addition to Phag-cfp and PtapA-cfp, we used PsspB-cfp to monitor sporulating cells, which are indicative of highly phosphorylated Spo0A and CodY derepression under conditions of nutrient depletion (20, 39, 49, 50). Fluorescence microscopy was used to examine promoter activities at cell densities associated with induction of the respective pathway-specific reporters. As seen in Fig. 7, the cells within each field show heterogeneous intensity of PpksC-yfp fluorescence, suggesting differential pks expression in distinct subpopulations of cells in a liquid culture (20). The observed pattern of PpksC-yfp activation suggested that pks gene expression is repressed in motile cells expressing Phag-cfp. Conversely, cells expressing PtapA-cfp also showed elevated levels of PpksC-yfp. Thus, the bacillaene operon appears to be induced in matrix-producing populations and not in motile subpopulations when B. subtilis is grown in liquid culture. The observed pattern is consistent with a pattern of Spo0A-dependent activation and with the PpksC-lacZ expression we have observed on agar plates with S. lividans (Fig. 5C and 6A). Upon starvation at high cell density, Spo0A is highly phosphorylated and induces sporulation (51). We examined the level of PpksC-yfp fluorescence in strains expressing PsspB-cfp as a marker of sporulation. The PpksC-yfp signal was detectable in the majority of cells at high cell density (OD600, 4.0). In a percentage of the cells, nascent spores were visible by fluorescence of both TMA-DPH-stained membranes and the PsspB-cfp reporter (Fig. 7). Within the visibly sporulating population, PpksC-yfp reporter expression was restricted to the mother cells and not to developing spores. These observations are consistent with activation of pks gene expression during the transition from exponential growth to stationary phase, processes controlled by the master regulatory protein, Spo0A, and the nutrient status regulator, CodY (50, 51).
FIG 7.
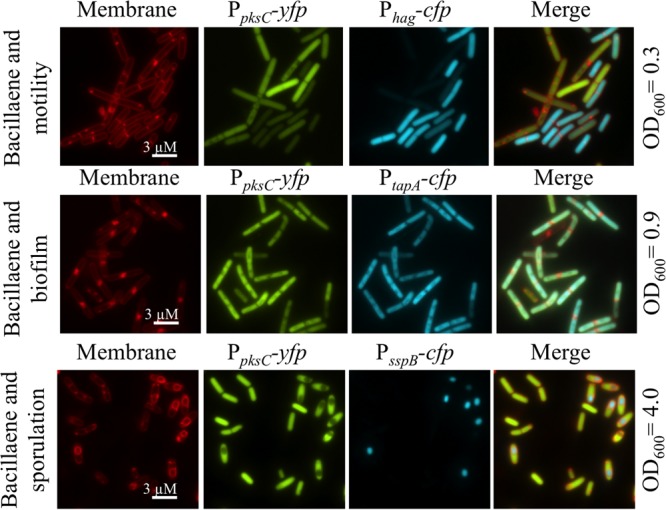
Activation of the pksC promoter coincides with activation of biofilm and spore formation. Fluorescence imaging of pks activation (amyE::PpksC-yfp) with reporters for motility (lacA::Phag-cfp), biofilm matrix production (lacA::PtapA-cfp), and sporulation (lacA::PsspB-cfp). Cells were cultured in liquid CH medium at 37°C and monitored by fluorescence microscopy over time. Images shown were taken at the indicated culture densities to observe activation of the relevant pathway reporters. Flagellum-dependent motile cells showed low signal intensity for PpksC-yfp. Cells active for matrix production (PtapA-cfp) and spore formation (PsspB-cfp) activated PpksC-yfp. TMA-DPH-stained membranes are red. Promoter-cfp fusions are blue. Promoter-yfp fusions are green. Scale bar, 3 μm.
PpksC is homogeneously repressed upon spreading of B. subtilis colonies.
Based on the observed patterns of PpksC-yfp activation in liquid culture, we asked whether pks gene expression on solid surfaces was heterogenous and exclusive to biofilm matrix-producing cells but not motile cells. We cultured the Phag-cfp, PpksC-yfp, and PtapA-cfp, PpksC-yfp strains on agar media with S. lividans (Fig. 8). We observed in these strains that PpksC-yfp activation was uniformly low in the spreading population and high in the parent colony, as was also observed with the PpksC-lacZ reporter. The patterns of Phag-cfp and PtapA-cfp expression, on the other hand, were heterogenous within these populations. This expression pattern indicated that activation of pks gene expression is not coregulated with matrix production per se, which we inferred from its coincidence with PtapA-cfp in liquid cultures, and PpksC-yfp is not strictly repressed in the Phag-cfp marked motile cells. Instead, the level of pks gene expression is largely determined by differentiation of the spreading population from a static colony. In an effort to define the type of motility observed in these assays, we determined that the spreading population is dependent upon both surfactin (ΔsrfAA) and σD (ΔsigD) for motility (see Fig. S2A in the supplemental material). Thus, we think the cells are using swarming motility, which requires σD for expression of flagellar genes, to propel themselves toward the S. lividans colony (28). Colony spreading also occurs by spontaneous mutation or targeted disruption of competence and DNA metabolism genes (52). We found that the spreading cells in our assays are not formed of spontaneous mutants, suggesting that the presence of S. lividans results in swarming motility or directional growth by B. subtilis (see Fig. S2B). In either case, the expression of the pks genes is minimal upon emergence of the swarming population. The pattern of transient repression during motility and activation in the parent colony is consistent with complex control of pks gene expression by regulators that converge on switching between motility and stationary-phase functions, including the energy and extracellular responsiveness of CodY and Spo0A.
FIG 8.
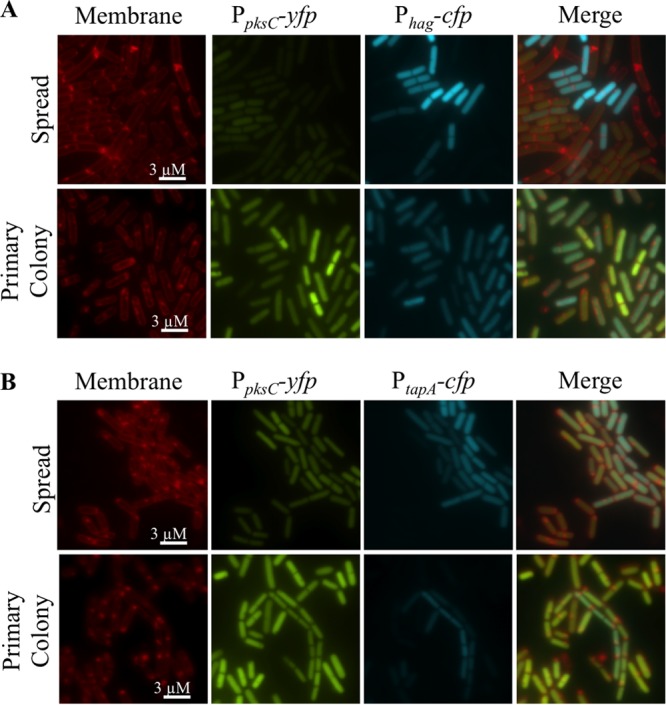
Differential pks gene expression of spreading and static cells of B. subtilis in competition with Streptomyces lividans. B. subtilis and S. lividans cocultures were prepared as described in the legend to Fig. 2. Following 36 h of incubation, cells from the leading edge and primary colony of B. subtilis were scraped from the agar and prepared for fluorescence microscopy. (A) A reporter strain for pks activation (amyE::PpksC-yfp) and flagellar expression (lacA::Phag-cfp). Low levels of PpksC-yfp activity were detected in the spreading population, while PpksC-yfp activity was elevated in B. subtilis cells from the primary colony. The spreading populations had a subpopulation of cells with high levels of Phag-cfp activity that were negative for PpksC-yfp activity. (B) A reporter strain for pks activation (amyE::PpksC-yfp) and extracellular matrix (lacA::PtapA-cfp). Lower levels of PpksC-yfp activity were also detected in the spreading population compared to the primary colony. Expression of the pks genes occurred broadly in the population and not exclusively in the subpopulation of producers of extracellular matrix. TMA-DPH-stained membranes are red. Promoter-cfp fusions are blue. Promoter-yfp fusions are green. Scale bar, 3 μm.
DISCUSSION
Bacillaene is an important determinant of outcomes during interactions between B. subtilis and competitor species. Bacillaene is essential for survival in competition with the predatory-like Streptomyces sp. strain Mg1 (11). Also, the presence or absence of bacillaene influences how a competitor responds to B. subtilis, as was illustrated previously by the induction of prodiginines (RED) by S. coelicolor and, as found in the present study, by S. lividans (7). The present study directly addressed pks gene regulation and the control of bacillaene production by B. subtilis. We took a multistep approach to identify regulatory functions that control bacillaene production and considered several existing transcriptomic studies that suggest modes of bacillaene regulation (23, 25, 42, 44, 53). We first determined that B. subtilis in liquid culture induces transcription of the >74-kb pks operon as the cells exit logarithmic growth and transition to stationary phase. As the cultures progressed into stationary phase, the production of bacillaene was diminished. Both pks transcripts decreased during stationary-phase culture, and the Pks megacomplexes were degraded, as observed by fluorescence of PksR-YFP. Thus, a similar pattern in liquid culture of induction and subsequent reduction is apparent for pks transcript levels, PksR abundance, and the presence of secreted bacillaene. This pattern suggests transcriptional regulation is a primary determinant for bacillaene production, as opposed to, for instance, activation or deactivation of enzymatic assembly lines.
The regulation of pks gene transcription was previously assigned to the PksA protein, annotated as a TetR family regulator of pks genes. Our results indicate that PksA does not regulate pks gene expression, at least under the experimental conditions we tested. Our preliminary data suggest that the function of PksA is directed toward an adjacent, divergently transcribed gene, ymcC (not shown). Related organisms, such as Bacillus amyloliquefaciens FZB42, also produce bacillaene, encoded by the enzymatic complex in the bae gene cluster (14). In contrast to B. subtilis, the orthologous pksA gene of B. amyloliquefaciens FZB42 is located in a region of the chromosome separate from the bae biosynthetic gene cluster, suggesting the protein is not a pathway-specific regulator (16). Thus, these data support a model for pks gene regulation and bacillaene production that relies on global regulatory circuits and not a pathway-specific regulator, such as PksA.
Evidence for differential activation of pks gene expression emerged from the interaction of B. subtilis with S. lividans, which suggested bacillaene is repressed in spreading subpopulations. To understand regulatory processes that control bacillaene production, we focused our attention on regulation of the pks operon that extends from pksC to pksR. We identified the 5′UTR of pksC as the control element for induction of the pks operon, which is consistent with results from a genome-wide study of B. subtilis transcription (23). Using PpksC-yfp and PpksC-lacZ reporters, we confirmed that pks gene expression was transiently repressed in populations of cells that migrate across agar toward S. lividans. We have shown that bacillaene production is principally under the control of the Spo0A and CodY stationary-phase regulators. However, full induction of pks gene expression is also dependent on DegU, ComA, and ScoC, suggesting that B. subtilis uses multiple mechanisms to integrate bacillaene synthesis with other cellular functions (19, 54–56). The observed patterns of pks gene expression suggest that B. subtilis activates and represses bacillaene production in response to nutrient conditions and developmental transitions. Similar observations for regulation of several B. subtilis antibiotics in liquid culture have been described (1, 4, 21, 22, 24, 28, 57–59).
Our results support a model wherein B. subtilis inactivates bacillaene production during a motile phase induced by growth in the presence of S. lividans. The parent colony actively expresses the pks genes. The swarming population initially repressed pks expression, which, over time, becomes active within the motile populations. The described pattern of synthesis is consistent with the observation that Spo0A, which controls a switch between motile and biofilm matrix-producing cells, are required for full induction of the pks genes (39). Additionally, the loss of pks gene expression in the ΔcodY strain revealed that the pks operon is one of a few targets dependent upon CodY for expression (60). CodY binds directly to GTP and branched-chain amino acids (BCAAs) as a mechanism for sensing nutrient-rich conditions (50, 61). When bound to these signals, CodY represses functions that include motility (e.g., hag and fla-che) and antibiotic production (e.g., surfactin and bacilysin) through increased affinity for their regulatory DNA elements (46, 62). The ΔcodY phenotype for pks gene expression suggests that the pks operon is tuned to changes in nutrient availability and is repressed when cells divert resources to motility. We speculate that maintaining low pks gene expression in motile populations is important for energy resource allocation in B. subtilis, because synthesis of megacomplexes and bacillaene are likely to require considerable energy input.
Our results suggest the hypothesis that dual regulation of pks expression ensures bacillaene production in high-cell-density populations, such as biofilms (Spo0A dependent), and under conditions of nutrient availability that permit pks genes expression (CodY). In addition, secondary control mechanisms may fine-tune expression in response to external and internal conditions or signals through DegU, ComA, and ScoC. For example, DegU is induced by the presence of glucose through catabolite regulator function (63). Thus, a DegU-dependent timing mechanism may exist for initial repression by dephospho-DegU, followed by activation through DegU phosphorylation and inhibition of motility (64). ComA and ScoC also function in both motility control and secondary metabolism. ComA regulates surfactin production, which is required for swarming motility, and DegQ, which enhances DegU phosphorylation (44, 65). ScoC, which directly controls bacilysin production, also controls the transition between motile and biofilm-forming populations through its regulation of flgM and sinI, respectively (22, 56, 66). Thus, ScoC may coordinate the timing of induction for pks gene expression, which we found is activated early by a ΔscoC mutant strain. Other, unidentified regulatory functions may contribute to pks control as well. How the relative timing of interactions between regulatory pathways integrates downstream functions is complex and incompletely understood.
Exploring the divergent functions in static and motile populations of competing bacteria provides an experimental system to better understand pathway integration. Based on our results, synthesis of bacillaene joins a growing list of processes that are divided among subpopulations of clonal B. subtilis cells (67). Regulatory mechanisms for antibiotic biosynthesis have been studied generally by culturing bacteria in liquid and monitoring patterns of synthesis correlated with cell density. As we have shown, the production of bacillaene in liquid culture fits a pattern typical of many antibiotics, i.e., induction upon transition out of logarithmic growth. Historically, this timing defines antibiotic production within the idiophase (68). When grown on solid surfaces, patterns of differentiation suggest that many bacteria have sophisticated mechanisms for determining the timing of pathway activation (39). Antibiotic biosynthesis is no exception. Developmental regulatory processes also control antibiotic biosynthesis (1). For example, many Streptomyces species couple antibiotic biosynthesis with developmental pathways of aerial growth and sporulation through complex regulatory circuits (17). In some cases, antibiotic biosynthesis is activated by pathway-specific regulatory genes that may be directed by developmental regulators (69). When no pathway-specific regulatory proteins are present, identifying the specific determinants of activation requires understanding the developmental control networks of the organism.
Studies of antibiotic regulation under competition suggest that coordinated control of multiple antibiotics with developmental transitions serves to optimize the competitive fitness of B. subtilis by ensuring efficient resource allocation (70). The convergence of bacterial developmental regulation with control of antibiotic synthesis may highlight new approaches to activate or optimize production of molecules of interest (71). For example, strategic genetic manipulations of the producing species could be used to restrict the organism to a high antibiotic output state, which may also be an effective approach to activate cryptic secondary metabolic pathways (72). Future examination of developmental controls for antibiotic biosynthesis will likely inform key principles of bacterial competition as well as new strategies to induce antibiotic production from microorganisms.
Supplementary Material
ACKNOWLEDGMENTS
We thank Craig Kaplan for use of the real-time PCR thermocycler, Jennifer Herman for advice and use of the fluorescence microscope, Chris Hoefler for support with HPLC, Hera Vlamakis and Roberto Kolter for providing us with strains, A. L. Sonenshein for a gift of the B. subtilis ΔcodY strain, and Hera Vlamakis and Jennifer Herman for critical review of the manuscript. We thank Hannah Bereuter and Sara Peffer for technical assistance.
This work was supported by Texas A&M University, Agrilife Research and by an NSF-CAREER award to P.S. (MCB-1253215).
Footnotes
Published ahead of print 1 November 2013
Supplemental material for this article may be found at http://dx.doi.org/10.1128/JB.01022-13.
REFERENCES
- 1.Stein T. 2005. Bacillus subtilis antibiotics: structures, syntheses and specific functions. Mol. Microbiol. 56:845–857. 10.1111/j.1365-2958.2005.04587.x [DOI] [PubMed] [Google Scholar]
- 2.Kearns D, Losick R. 2003. Swarming motility in undomesticated Bacillus subtilis. Mol. Microbiol. 49:581–590. 10.1046/j.1365-2958.2003.03584.x [DOI] [PubMed] [Google Scholar]
- 3.Lopez D, Fischbach MA, Chu F, Losick R, Kolter R. 2009. Structurally diverse natural products that cause potassium leakage trigger multicellularity in Bacillus subtilis. Proc. Natl. Acad. Sci. U. S. A. 106:280–285. 10.1073/pnas.0810940106 [DOI] [PMC free article] [PubMed] [Google Scholar]
- 4.López D, Vlamakis H, Losick R, Kolter R. 2009. Paracrine signaling in a bacterium. Genes Dev. 23:1631–1638. 10.1101/gad.1813709 [DOI] [PMC free article] [PubMed] [Google Scholar]
- 5.Steller S, Vollenbroich D, Leenders F, Stein T, Conrad B, Hofemeister J, Jacques P, Thonart PVJ. 1999. Structural and functional organization of the fengycin synthetase multienzyme system from Bacillus subtilis b213 and A1/3. Chem. Biol. 6:31–41. 10.1016/S1074-5521(99)80018-0 [DOI] [PubMed] [Google Scholar]
- 6.Jacques P. 2011. Surfactin and other lipopeptides from Bacillus spp., p 57–91 In Soberón-Chávez G. (ed), Microbiology monographs series, vol. 20 Springer, Berlin, Germany [Google Scholar]
- 7.Straight PD, Fischbach MA, Walsh CT, Rudner DZ, Kolter R. 2007. A singular enzymatic megacomplex from Bacillus subtilis. Proc. Natl. Acad. Sci. U. S. A. 104:305–310. 10.1073/pnas.0609073103 [DOI] [PMC free article] [PubMed] [Google Scholar]
- 8.Butcher RA, Schroeder FC, Fischbach MA, Straight PD, Kolter R, Walsh CT, Clardy J. 2007. The identification of bacillaene, the product of the PksX megacomplex in Bacillus subtilis. Proc. Natl. Acad. Sci. U. S. A. 104:1506–1509. 10.1073/pnas.0610503104 [DOI] [PMC free article] [PubMed] [Google Scholar]
- 9.Patel PS, Huangn S, Fisher S, Pirnik D, Aklonis C, Dean L, Meyers E, Fernandes P, Mayerlm F. 1995. Bacillaene, a novel inhibitor of procaryotic protein synthesis produced by Bacillus subtilis: production, taxonomy, isolation, physico-chemical activity. J. Antibiot. 48:997–1003. 10.7164/antibiotics.48.997 [DOI] [PubMed] [Google Scholar]
- 10.Yang Y-L, Xu Y, Straight P, Dorrestein PC. 2009. Translating metabolic exchange with imaging mass spectrometry. Nat. Chem. Biol. 5:885–887. 10.1038/nchembio.252 [DOI] [PMC free article] [PubMed] [Google Scholar]
- 11.Barger S, Hoefler B, Cubillos-Ruiz A, Russell W, Russell D, Straight P. 2012. Imaging secondary metabolism of Streptomyces sp. Mg1 during cellular lysis and colony degradation of competing Bacillus subtilis. Antonie Van Leeuwenhoek 102:435–445. 10.1007/s10482-012-9769-0 [DOI] [PubMed] [Google Scholar]
- 12.Fischbach MA, Walsh CT. 2006. Assembly-line enzymology for polyketide and nonribosomal peptide antibiotics: logic, machinery, and mechanisms. Chem. Rev. 106:3468–3496. 10.1021/cr0503097 [DOI] [PubMed] [Google Scholar]
- 13.Cundliffe E, Demain AL. 2010. Avoidance of suicide in antibiotic-producing microbes. J. Ind. Microbiol. Biotechnol. 37:643–672. 10.1007/s10295-010-0721-x [DOI] [PubMed] [Google Scholar]
- 14.Chen X-H, Vater J, Piel J, Franke P, Scholz R, Schneider K, Koumoutsi A, Hitzeroth G, Grammel N, Strittmatter AW, Gottschalk G, Süssmuth RD, Borriss R. 2006. Structural and functional characterization of three polyketide synthase gene clusters in Bacillus amyloliquefaciens FZB 42. J. Bacteriol. 188:4024–4036. 10.1128/JB.00052-06 [DOI] [PMC free article] [PubMed] [Google Scholar]
- 15.Reddick JJ, Antolak SA, Raner GM. 2007. PksS from Bacillus subtilis is a cytochrome P450 involved in bacillaene metabolism. Biochem. Biophys. Res. Commun. 358:363–367. 10.1016/j.bbrc.2007.04.151 [DOI] [PubMed] [Google Scholar]
- 16.Chen XH, Koumoutsi A, Scholz R, Schneider K, Vater J, Süssmuth R, Piel J, Borriss R. 2009. Genome analysis of Bacillus amyloliquefaciens FZB42 reveals its potential for biocontrol of plant pathogens. J. Biotechnol. 140:27–37. 10.1016/j.jbiotec.2008.10.011 [DOI] [PubMed] [Google Scholar]
- 17.Van Wezel GP, McDowall KJ. 2011. The regulation of the secondary metabolism of Streptomyces: new links and experimental advances. Nat. Prod Rep. 28:1311–1333. 10.1039/c1np00003a [DOI] [PubMed] [Google Scholar]
- 18.Bibb MJ. 2005. Regulation of secondary metabolism in streptomycetes. Curr. Opin. Microbiol. 8:208–215. 10.1016/j.mib.2005.02.016 [DOI] [PubMed] [Google Scholar]
- 19.López D, Kolter R. 2010. Extracellular signals that define distinct and coexisting cell fates in Bacillus subtilis. FEMS Microbiol. Rev. 34:134–149. 10.1111/j.1574-6976.2009.00199.x [DOI] [PubMed] [Google Scholar]
- 20.Lopez D, Vlamakis H, Kolter R. 2009. Generation of multiple cell types in Bacillus subtilis. FEMS Microbiol. Rev. 33:152–163. 10.1111/j.1574-6976.2008.00148.x [DOI] [PubMed] [Google Scholar]
- 21.Karatas A, Cetin S, Ozcengiz G. 2003. The effects of insertional mutations in comQ, comP, srfA, spo0H, spo0A and abrB genes on bacilysin biosynthesis in Bacillus subtilis. Biochim. Biophys. Acta 1626:51–56. 10.1016/S0167-4781(03)00037-X [DOI] [PubMed] [Google Scholar]
- 22.Inaoka T, Wang G, Ochi K. 2009. ScoC regulates bacilysin production at the transcription level in Bacillus subtilis. J. Bacteriol. 191:7367–7371. 10.1128/JB.01081-09 [DOI] [PMC free article] [PubMed] [Google Scholar]
- 23.Nicolas P, Mäder U, Dervyn E, Rochat T, Leduc A, Pigeonneau N, Bidnenko E, Marchadier E, Hoebeke M, Aymerich S, Becher D, Bisicchia P, Botella E, Delumeau O, Doherty G, Denham EL, Fogg MJ, Fromion V, Goelzer A, Hansen A, Härtig E, Harwood CR, Homuth G, Jarmer H, Jules M, Klipp E, Le Chat L, Lecointe F, Lewis P, Liebermeister W, March A, Mars RA, Nannapaneni TP, Noone D, Pohl S, Rinn B, Rügheimer F, Sappa PK, Samson F, Schaffer M, Schwikowski B, Steil L, Stülke J, Wiegert T, Devine KM, Wilkinson AJ, van Dijl JM, Hecker M, Völker U, Bessières P, Noirot P. 2012. Condition-dependent transcriptome reveals high-level regulatory architecture in Bacillus subtilis. Science 335:1103–1106. 10.1126/science.1206848 [DOI] [PubMed] [Google Scholar]
- 24.Strauch MA, Bobay BG, Cavanagh J, Yao F, Wilson A, Le Breton Y. 2007. Abh and AbrB control of Bacillus subtilis antimicrobial gene expression. J. Bacteriol. 189:7720–7732. 10.1128/JB.01081-07 [DOI] [PMC free article] [PubMed] [Google Scholar]
- 25.Belitsky B, Sonenshein A. 2013. Genome-wide identification of Bacillus subtilis CodY-binding sites at single-nucleotide resolution. Proc. Natl. Acad. Sci. U. S. A. 110:7026–7031. 10.1073/pnas.1300428110 [DOI] [PMC free article] [PubMed] [Google Scholar]
- 26.Sonenshein AL. 2005. CodY, a global regulator of stationary phase and virulence in Gram-positive bacteria. Curr. Opin. Microbiol. 8:203–207. 10.1016/j.mib.2005.01.001 [DOI] [PubMed] [Google Scholar]
- 27.Harwood CR, Cutting SM. 1990. Molecular biological methods for Bacillus. Wiley, New York, NY [Google Scholar]
- 28.Kearns DB, Chu F, Rudner R, Losick R. 2004. Genes governing swarming in Bacillus subtilis and evidence for a phase variation mechanism controlling surface motility. Mol. Microbiol. 52:357–369. 10.1111/j.1365-2958.2004.03996.x [DOI] [PubMed] [Google Scholar]
- 29.Ruijter JM, Ramakers C, Hoogaars WMH, Karlen Y, Bakker O, van den Hoff MJB, Moorman AFM. 2009. Amplification efficiency: linking baseline and bias in the analysis of quantitative PCR data. Nucleic Acids Res. 37:1–12. 10.1093/nar/gkn923 [DOI] [PMC free article] [PubMed] [Google Scholar]
- 30.Wach A. 1996. PCR-synthesis of marker cassettes with long flanking homology regions for gene disruptions in S. cerevisiae. Yeast 12:259–265 [DOI] [PubMed] [Google Scholar]
- 31.Gibson D, Young L, Chuang R, Venter J, Hutchison C, III, Smith H. 2009. Enzymatic assembly of DNA molecules up to several hundred kilobases. Nat. Methods 6:343–345. 10.1038/nmeth.1318 [DOI] [PubMed] [Google Scholar]
- 32.Miller JH. 1972. Experiments in molecular genetics. Cold Spring Harbor Laboratory Press, Cold Spring Harbor, NY [Google Scholar]
- 33.Williamson NR, Fineran PC, Leeper FJ, Salmond GPC. 2006. The biosynthesis and regulation of bacterial prodiginines. Nat. Rev. Microbiol. 4:887–899. 10.1038/nrmicro1531 [DOI] [PubMed] [Google Scholar]
- 34.Hofemeister J, Conrad B, Adler B, Hofemeister B, Feesche J, Kucheryava N, Steinborn G, Franke P, Grammel N, Zwintscher A, Leenders F, Hitzeroth G, Vater J. 2004. Genetic analysis of the biosynthesis of non-ribosomal peptide- and polyketide-like antibiotics, iron uptake and biofilm formation by Bacillus subtilis A1/3. Mol. Genet. Genomics 272:363–378. 10.1007/s00438-004-1056-y [DOI] [PubMed] [Google Scholar]
- 35.Guder A, Schmitter T, Wiedemann I, Sahl H-G, Bierbaum G. 2002. Role of the single regulator MrsR1 and the two-component system MrsR2/K2 in the regulation of mersacidin production and immunity. Appl. Environ. Microbiol. 68:106–113. 10.1128/AEM.68.1.106-113.2002 [DOI] [PMC free article] [PubMed] [Google Scholar]
- 36.Ou X, Zhang B, Zhang L, Zhao G, Ding X. 2009. Characterization of rrdA, a TetR family protein gene involved in the regulation of secondary metabolism in Streptomyces coelicolor. Appl. Environ. Microbiol. 75:2158–2165. 10.1128/AEM.02209-08 [DOI] [PMC free article] [PubMed] [Google Scholar]
- 37.Ramos JL, Martínez-Bueno M, Molina-Henares MA, Terán W, Watanabe K, Zhang X, Gallegos MT, Brennan R, Tobes R. 2005. The TetR family of transcriptional repressors. Microbiol. Rev. 69:326–356. 10.1128/MMBR.69.2.326-356.2005 [DOI] [PMC free article] [PubMed] [Google Scholar]
- 38.Kieser T, Bibb MJ, Buttner MJ, Chater KF. 2000. Practical Streptomyces genetics. John Innes Foundation, Colney, Norwich, England [Google Scholar]
- 39.Vlamakis H, Aguilar C, Losick R, Kolter R. 2008. Control of cell fate by the formation of an architecturally complex bacterial community. Genes Dev. 22:945–953. 10.1101/gad.1645008 [DOI] [PMC free article] [PubMed] [Google Scholar]
- 40.Shafikhani SH, Leighton T. 2004. AbrB and Spo0E control the proper timing of sporulation in Bacillus subtilis. Curr. Microbiol. 48:262–269. 10.1007/s00284-003-4186-2 [DOI] [PubMed] [Google Scholar]
- 41.Hamon MA, Stanley NR, Britton RA, Grossman AD, Lazazzera BA. 2004. Identification of AbrB-regulated genes involved in biofilm formation by Bacillus subtilis. Mol. Microbiol. 52:847–860. 10.1111/j.1365-2958.2004.04023.x [DOI] [PMC free article] [PubMed] [Google Scholar]
- 42.Chumsakul O, Takahashi H, Oshima T, Hishimoto T, Kanaya S, Ogasawara N, Ishikawa S. 2011. Genome-wide binding profiles of the Bacillus subtilis transition state regulator AbrB and its homolog Abh reveals their interactive role in transcriptional regulation. Nucleic Acids Res. 39:414–428. 10.1093/nar/gkq780 [DOI] [PMC free article] [PubMed] [Google Scholar]
- 43.Verhamme DT, Murray EJ, Stanley-Wall NR. 2009. DegU and Spo0A jointly control transcription of two loci required for complex colony development by Bacillus subtilis. J. Bacteriol. 191:100–108. 10.1128/JB.01236-08 [DOI] [PMC free article] [PubMed] [Google Scholar]
- 44.Ogura M, Yamaguchi H, Yoshida K, Fujita Y, Tanaka T. 2001. DNA microarray analysis of Bacillus subtilis DegU, ComA and PhoP regulons: an approach to comprehensive analysis of B. subtilis two-component regulatory systems. Nucleic Acids Res. 29:3804–3813. 10.1093/nar/29.18.3804 [DOI] [PMC free article] [PubMed] [Google Scholar]
- 45.Gupta M, Dixit M, Rao K. 2013. Spo0A positively regulates epr expression by negating the repressive effect of co-repressors, SinR and ScoC, in Bacillus subtilis. J. Biosci. 38:291–299. 10.1007/s12038-013-9309-8 [DOI] [PubMed] [Google Scholar]
- 46.Inaoka T, Takahashi K, Ohnishi-Kameyama M, Yoshida M, Ochi K. 2003. Guanine nucleotides guanosine 5′-diphosphate 3′-diphosphate and GTP co-operatively regulate the production of an antibiotic bacilysin in Bacillus subtilis. J. Biol. Chem. 278:2169–2176. 10.1074/jbc.M208722200 [DOI] [PubMed] [Google Scholar]
- 47.Mirel DB, Chamberlin MJ. 1989. The Bacillus subtilis flagellin gene (hag) is transcribed by the sigma 28 form of RNA polymerase. J. Bacteriol. 171:3095–3101 [DOI] [PMC free article] [PubMed] [Google Scholar]
- 48.Branda SS, Chu F, Kearns DB, Losick R, Kolter R. 2006. A major protein component of the Bacillus subtilis biofilm matrix. Mol. Microbiol. 59:1229–1238. 10.1111/j.1365-2958.2005.05020.x [DOI] [PubMed] [Google Scholar]
- 49.Connors MJ, Mason JM, Setlow P. 1986. Cloning and nucleotide sequencing of genes for three small, acid-soluble proteins from Bacillus subtilis Spores. J. Bacteriol. 166:417–425 [DOI] [PMC free article] [PubMed] [Google Scholar]
- 50.Ratnayake-Lecamwasam M, Serror P, Wong K, Sonenshein AL. 2001. Bacillus subtilis CodY represses early-stationary-phase genes by sensing GTP levels. Genes Dev. 15:1093–1103. 10.1101/gad.874201 [DOI] [PMC free article] [PubMed] [Google Scholar]
- 51.Fujita M, González-Pastor JE, Losick JER. 2005. High- and low-threshold genes in the Spo0A regulon of Bacillus subtilis. J. Bacteriol. 187:1357–1368. 10.1128/JB.187.4.1357-1368.2005 [DOI] [PMC free article] [PubMed] [Google Scholar]
- 52.Zafra O, Lamprecht-Grandío M, de Figueras CG, González-Pastor JE. 2012. Extracellular DNA release by undomesticated Bacillus subtilis is regulated by early competence. PLoS One 7:1–15. 10.1371/journal.pone.0048716 [DOI] [PMC free article] [PubMed] [Google Scholar]
- 53.Fadda A, Fierro AC, Lemmens K, Monsieurs P, Engelen K, Marchal K. 2009. Inferring the transcriptional network of Bacillus subtilis. Mol. Biosyst. 5:1840–1852. 10.1039/b907310h [DOI] [PubMed] [Google Scholar]
- 54.Verhamme D, Kiley T, Stanley-Wall N. 2007. DegU co-ordinates multicellular behaviour exhibited by Bacillus subtilis. Mol. Microbiol. 65:554–568. 10.1111/j.1365-2958.2007.05810.x [DOI] [PubMed] [Google Scholar]
- 55.Kunst F, Msadek T, Bignon J, Rapoport G. 1994. The DegS/DegU and ComP/ComA two-component systems are part of a network controlling degradative enzyme synthesis and competence in Bacillus subtilis. Res. Microbiol. 145:393–402. 10.1016/0923-2508(94)90087-6 [DOI] [PubMed] [Google Scholar]
- 56.Shafikhani SH, Mandic-Mulec I, Strauch IMA, Smith I, Leighton T. 2002. Postexponential regulation of sin operon expression in Bacillus subtilis. J. Bacteriol. 184:564–571. 10.1128/JB.184.2.564-571.2002 [DOI] [PMC free article] [PubMed] [Google Scholar]
- 57.Tsuge K, Ano T, Hirai M, Nakamura Y, Shoda M. 1999. The genes degQ, pps, and lpa-8 (sfp) are responsible for conversion of Bacillus subtilis 168 to plipastatin production. Antimicrob. Agents Chemother. 43:2183–2192 [DOI] [PMC free article] [PubMed] [Google Scholar]
- 58.Tsuge K, Matsui K, Itaya M. 2007. Production of the non-ribosomal peptide plipastatin in Bacillus subtilis regulated by three relevant gene blocks assembled in a single movable DNA segment. J. Biotechnol. 129:592–603. 10.1016/j.jbiotec.2007.01.033 [DOI] [PubMed] [Google Scholar]
- 59.Luo Y, Helmann JD. 2009. Extracytoplasmic function sigma factors with overlapping promoter specificity regulate sublancin production in Bacillus subtilis. J. Bacteriol. 191:4951–4958. 10.1128/JB.00549-09 [DOI] [PMC free article] [PubMed] [Google Scholar]
- 60.Molle V, Nakaura Y, Shivers RP, Yamaguchi H, Losick R, Fujita Y, Sonenshein AL. 2003. Additional targets of the Bacillus subtilis global regulator CodY identified by chromatin immunoprecipitation and genome-wide transcript analysis. J. Bacteriol. 185:1911–1922. 10.1128/JB.185.6.1911-1922.2003 [DOI] [PMC free article] [PubMed] [Google Scholar]
- 61.Shivers RP, Sonenshein AL. 2004. Activation of the Bacillus subtilis global regulator CodY by direct interaction with branched-chain amino acids. Mol. Microbiol. 53:599–611. 10.1111/j.1365-2958.2004.04135.x [DOI] [PubMed] [Google Scholar]
- 62.Bergara F, Ibarra C, Iwamasa J, Patarroyo JC, Ma LM. 2003. CodY is a nutritional repressor of flagellar gene expression in Bacillus subtilis. J. Bacteriol. 185:3118–3126. 10.1128/JB.185.10.3118-3126.2003 [DOI] [PMC free article] [PubMed] [Google Scholar]
- 63.Ishii H, Tanaka T, Ogura M. 2013. The Bacillus subtilis response regulator gene degU is positively regulated by CcpA and by catabolite-repressed synthesis of ClpC. J. Bacteriol. 195:193–201. 10.1128/JB.01881-12 [DOI] [PMC free article] [PubMed] [Google Scholar]
- 64.Kobayashi K. 2007. Gradual activation of the response regulator DegU controls serial expression of genes for flagellum formation and biofilm formation in Bacillus subtilis. Mol. Microbiol. 66:395–409. 10.1111/j.1365-2958.2007.05923.x [DOI] [PubMed] [Google Scholar]
- 65.Msadek T, Kunst F, Klier A, Rapoport G. 1991. DegS-DegU and ComP-ComA modulator-effector pairs control expression of the Bacillus subtilis pleiotropic regulatory gene degQ. J. Bacteriol. 173:2366–2377 [DOI] [PMC free article] [PubMed] [Google Scholar]
- 66.Kodgire P, Rao K. 2009. A dual mode of regulation of flgM by ScoC in Bacillus subtilis. Can. J. Microbiol. 55:983–989. 10.1139/W09-049 [DOI] [PubMed] [Google Scholar]
- 67.Aguilar C, Vlamakis H, Losick R, Kolter R. 2007. Thinking about Bacillus subtilis as a multicellular organism. Curr. Opin. Microbiol. 10:638–643. 10.1016/j.mib.2007.09.006 [DOI] [PMC free article] [PubMed] [Google Scholar]
- 68.Demain L, Fang A. 2000. The natural functions of secondary metabolites. Adv. Biochem. Eng. Biotechnol. 69:1–39 [DOI] [PubMed] [Google Scholar]
- 69.Rawlings BJ. 2001. Type I polyketide biosynthesis in bacteria (Part B) (1995 to mid-2000). Nat. Prod Rep. 18:231–281. 10.1039/b100191o [DOI] [PubMed] [Google Scholar]
- 70.Goel A, Wortel MT, Molenaar D, Teusink B. 2012. Metabolic shifts: a fitness perspective for microbial cell factories. Biotechnol. Lett. 34:2147–2160. 10.1007/s10529-012-1038-9 [DOI] [PMC free article] [PubMed] [Google Scholar]
- 71.Breitling R, Achcar F, Takano E. 2013. Modeling challenges in the synthetic biology of secondary metabolism. ACS Synth. Biol. 2:373–378. 10.1021/sb4000228 [DOI] [PubMed] [Google Scholar]
- 72.Chiang Y-M, Chang S-L, Oakley BR, Wang CCC. 2011. Recent advances in awakening silent biosynthetic gene clusters and linking orphan clusters to natural products in microorganisms. Curr. Opin. Chem. Biol. 15:137–143. 10.1016/j.cbpa.2010.10.011 [DOI] [PMC free article] [PubMed] [Google Scholar]
Associated Data
This section collects any data citations, data availability statements, or supplementary materials included in this article.