Abstract
Prochlorococcus and Synechococcus are the most abundant photosynthetic organisms in oligotrophic waters and responsible for a significant percentage of the earth's primary production. Here we developed a method for metagenomic sequencing of sorted Prochlorococcus and Synechococcus populations using a transposon-based library preparation technique. First, we observed that the cell lysis technique and associated amount of input DNA had an important role in determining the DNA library quality. Second, we found that our transposon-based method provided a more even coverage distribution and matched more sequences of a reference genome than multiple displacement amplification, a commonly used method for metagenomic sequencing. We then demonstrated the method on Prochlorococcus and Synechococcus field populations from the Sargasso Sea and California Current isolated by flow cytometric sorting and found clear environmentally related differences in ecotype distributions and gene abundances. In addition, we saw a significant correspondence between metagenomic libraries sequenced with our technique and regular sequencing of bulk DNA. Our results show that this targeted method is a viable replacement for regular metagenomic approaches and will be useful for identifying the biogeography and genome content of specific marine cyanobacterial populations.
INTRODUCTION
Two central players in marine biogeochemical cycles are the small but widespread cyanobacteria Synechococcus and Prochlorococcus (1, 2). Several ecotypes have been identified for each lineage with different light, temperature, and nutrient adaptations (3–11). Genome sequencing of Prochlorococcus and Synechococcus has revealed that adaptation to different nutrient conditions is phylogenetically highly variable. For example, genes associated with nutrient uptake have been found in variable genome regions that are likely gained through lateral gene transfer (12). Thus, genomic diversity associated with Prochlorococcus and Synechococcus (and many other marine bacteria) is likely important for their ecology and biogeochemical role in the ocean (13, 14). In addition to genome sequencing, metagenomic studies like the Global Ocean Survey (GOS) have revealed many subtypes and functions of marine bacteria (15). However, metagenomic techniques typically provide low coverage for less abundant lineages, and it can be challenging to link novel genes with specific phylogenetic clades. In an attempt to overcome these limitations, multiple studies have targeted the genomes of single cells (16, 17), but these approaches can be limited by significant bias in genome coverage and the sparse number of cells analyzed. Other studies have combined cell sorting with multiple displacement-based whole-genome amplification to target less abundant lineages. In most cases, genome assembly (18–20) or assignment of metabolic function (21) is the primary goal. However, there are commonly several biases associated with genome amplification, including the evenness of genome coverage, fraction of the genome captured, and sequencing errors (22, 23). In an effort to successfully sequence lower DNA input samples while avoiding the biases inherent to amplification, we conducted this study using a transposon-based genome amplification and library preparation protocol (i.e., Nextera) that does not require large quantities of input DNA. This method uses nanogram quantities of DNA but has not yet been tested for environmental metagenomic studies.
The aims of this study are to further develop and evaluate a metagenomic method combining cell sorting, DNA library creation, and whole-genome sequencing to target the genomic diversity of Prochlorococcus and Synechococcus. Next, we want to test the method for analyzing Prochlorococcus and Synechococcus field populations and compare the genome content from different ocean environments. We find that this method provides more even coverage in cultures and more target sequences in both cultures and environmental samples than metagenomic approaches using multiple displacement amplification (MDA) when DNA inputs are low. Thus, the improved technique can be useful for identifying the biogeography of the genome content of marine cyanobacterial populations from different ocean regions.
MATERIALS AND METHODS
An overview of the steps in the method is presented in Fig. S1 in the supplemental material.
Sample collection.
We grew Synechococcus strain WH7803 in SN medium (24) at 24°C in a diurnal incubator under a light regimen of 20 to 30 μE m−2 s−1 and estimated cell abundance using an Accuri C6 flow cytometer (BD, Franklin Lakes, NJ). Once the concentration reached 108 ml−1, we sampled and diluted 107, 106, 105, 104, and 103 cells, filtered the sample onto a 13-mm 0.22-μm polycarbonate filter, and stored it at −80°C. We also directly extracted genomic DNA (gDNA) from Synechococcus WH7803 culture using the Wizard genomic DNA purification kit (Promega, Madison, WI), and 2 ng of genomic DNA was used for the different methods.
Seawater samples were collected during cruises B258, B261, B270, and B272 in May and August 2010 and June and July 2011 at the Bermuda Atlantic Time-Series station (BATS) (31° 40′N 61° 10′W) and from the California Current on 5 February 2011, at the site of the MICRO time series (33° 22′N 117° 59′W) (25). For the sorted samples, 1 liter of seawater was collected from a depth of 0 m and 80 m for the BATS sample and at the surface for the California Current samples, and then the seawater was prefiltered through a 2.7-μm 47-mm GF/D filter. The filtrate was then refiltered through a 47-mm 0.22-μm polycarbonate filter, and the filter was never allowed to run dry, which concentrated the cells to approximately 5 ml and prevented them from attaching to the filter. We collected the filtrate with a transfer pipette and collected the filter, preserved them in 10% glycerol, and stored them in liquid nitrogen until further processing. Field samples were sorted using an Influx cell sorter (BD, Franklin Lakes, NJ) equipped with a 200-mV 488-nm solid-state laser (Coherent Inc., Santa Clara, CA) operating at 160 mW. Filters for chlorophyll (692/40 nm), phycoerythrin (575/25 nm), and side scatter were used to identify Prochlorococcus and Synechococcus. Purity checks were run throughout to determine what percentage of particles in the sorted sample was the target cell of interest, and only samples with 95% and above were used. Between 106 and 107 cells were collected, filtered onto a 13-mm 0.2-μm polycarbonate filter, and stored at −80°C (see Table S1 in the supplemental material). For the bulk nonamplified nonsorted seawater from the California Current, 24 liters of seawater was filtered in replicates through a 47-mm 2.7-μm GF/D filter and then through a 0.22-μm Sterivex filter (Millipore, Billerica, MA).
Cell lysis for sorted and culture samples.
Cells were allowed to defrost for 10 min at room temperature, and a crude cell lysis was then performed. The filter, 325 mg of 0.1-mm glass beads (MoBio, Carlsbad, CA), and 550 μl of 0.7 mM Tris buffer were shaken in a bead beater for 4 intervals of 30 s separated by 2 min on ice. Following centrifugation (1 min, 1,000 × g), 500 μl of the supernatant was concentrated to 30 μl in an Amicon 0.5-ml 3K column (Millipore, Billerica, MA). We also tested multiple alternative cell lysis methods (see Fig. S2 in the supplemental material) in order to obtain the best DNA release. The tested methods included (i) a heat denaturation approach where we heated the tube containing the filter and 0.7 mM Tris buffer without glass beads for 5 min at 95°C, followed by cell concentration using the same Amicon column; (ii) an addition of lysozyme (50 μl of 50 mg/ml); (iii) a combination of lysozyme and proteinase K (40 μl of 50 mg/ml lysozyme and 80 μl of 1/500 dilution of proteinase (Qiagen, Germantown, MD); and (iv) an acid-base lysis combination by adding 40 μl of strong base (25 μl of 1 M dithiothreitol [DTT], 20 μl of 5 M fresh KOH, 5 μl of 0.5 M EDTA, 200 μl of nuclease-free water), incubating at room temperature for 5 min, and neutralizing the base by adding 40 μl of a strong acid solution (3 ml of 2 M Tris, 4 ml of 1 N HCl, 3 ml DNA-free water) followed by a 10-min 15,000 × g centrifugation at 4°C and concentration of the sample using the same Amicon column. From the cell lysis, we measured the amounts of DNA recovered using a Qubit (Life Technologies, Grand Island NY). For the Synechococcus WH7803 cultures, the amounts of DNA recovered were approximately 3.5 ng/μl, 2 ng/μl, 1 ng/μl, not detected, and not detected for 107, 106, 105, 104, and 103 cell dilutions, respectively.
DNA extraction for bulk seawater.
DNA was extracted from the bulk seawater using the method described by Bostrom and coworkers until the cell lysis step (26). The DNA was recovered using the Genomic DNA Clean & Concentrator kit (Zymo Research, Irvine, CA). DNA libraries were prepared using TruSeq DNA sample kit (Illumina, San Diego, CA) and sequenced on a MiSeq single-end 100-bp reads using 3 μg of input DNA.
Nextera genome library preparation.
To generate a Nextera genome library (transposon-based library preparation technique), we mixed 1 μl of cell lysate, 1 μl of nuclease-free water (Ambion, Grand Island NY), 1 μl of 5× LMW Nextera reaction buffer, and 1 μl of 1/50 prediluted Nextera enzyme mix in order to randomly fragment the DNA (Illumina, San Diego, CA). For the genomic DNA samples, we added 1 μl or 2 ng/μl DNA. Each reaction tube was incubated at 55°C for 5 min, followed by a protein digestion at 50°C for 10 min with 1 μl of 0.01 arbitrary unit (AU)/ml protease (Qiagen, Germantown MD) and 70°C 20-min enzyme inactivation. Library amplification was performed using two-step PCR with customized PCR primer sets. The first PCR was carried out using 6 μl protease-digested template with 0.6 μl BST polymerase (New England BioLabs, Ipswich, MA), 1.2 μl of 10 μM customized primer set 1, and 15 μl SYBR-fast DNA polymerase mix (KAPA) and brought up to 30 μl with nuclease-free water (Ambion, Grand Island, NY). This PCR had the following conditions: 65°C for 10 min, 95°C for 30 s, followed by 6 cycles, with 1 cycle consisting of 95°C for 10 s, 58°C for 30 s, and 72°C for 2 min using Bio-Rad miniOpteron machine (Bio-Rad, Hercules, CA). We monitored amplification until it reached an estimated threshold of DNA amplification equivalent to a fluorescence value of 2,000, which is also equivalent to when the negative control starts to amplify. A second PCR step was done directly on AMPureXP beads (Beckman Coulter, Brea, CA) with captured DNA from the first PCR. The reaction mix included 25 μl SYBR-fast DNA polymerase mix (KAPA), 5 μl of 10 μM customized bar-coded primer set 2, and water to a total volume of 50 μl. The following conditions were applied: (i) 95°C for 30 s; (ii) 2 cycles, with 1 cycle consisting of 95°C for 10 s, 60°C for 30 s, and 72°C for 2 min; and (iii) 4 cycles, with 1 cycle consisting of 95°C for 10 s, 62°C for 30 s, and 72°C for 2 min. The PCR libraries were size selected with AMPureXP beads (Beckman Coulter, Brea, CA). One microliter of each library was electrophoresed through a Novex TBE gel (Invitrogen, Grand Island NY) for library size confirmation. The resulting libraries were then sequenced on a GAIIx genome analyzer to get single-end 60-bp reads.
Multiple displacement amplification.
DNA from the Synechococcus WH7803 cell lysate was amplified using a REPLI-g kit (Qiagen, Germantown, MD). Tubes, tube caps, and reverse transcription-PCR (RT-PCR)-grade water (Ambion, Grand Island, NY) were treated with UV for 15 min in the PCR hood. All the procedures followed the manufacturer's protocol designated for the amplification of purified genomic DNA. For each MDA reaction, 1.5 μl of cell lysate was mixed with 1.0 μl of clean Tris-EDTA (TE) buffer and then denatured with 2.5 μl of buffer DI and incubated at room temperature for 3 min. For the genomic DNA, samples, we added 1 μl or 2 ng/μl DNA instead of cell lysate. The reaction was neutralized by adding 5.0 μl of buffer N1 to the tubes on a prechilled cold block. The isothermal amplifications containing 10 μl of neutralized template DNA, 40 μl of enzyme master mix containing the REPLI-g DNA polymerase, REPLI-g buffer, and 0.4× of Evagreen (Biotium, Hayward, CA) were performed in a PCR thermocycler (Eppendorf Realplex; Eppendorf, Hauppauge, NY) at 30°C for 11 h. The PCR DNA concentration was recorded every 6 min.
Sequence analysis.
Sequences from Synechococcus WH7803 cultures were filtered by removing sequences of less than 60-bp length, with quality scores less than 28, and sequence duplicates using FastQC (27). We normalized the number of sequences for each analysis by rarefaction and subsequently mapped them to the Synechococcus WH7803 reference genome using CLC Genomic Workbench (Aarhus, Denmark). We then estimated the coverage for each position (fold coverage), the fraction of the genome captured at least once (percent covered), and the proportion of sequences that matched the reference genome (percent matched) (see Table S2 in the supplemental material). We also compared the GC content-dependent bias between both methods by estimating for each GC content level (0 to 100%) the mean read fold coverage of 60-bp segments with that specific GC content. For a reference, to model fold coverage in a nonbiased manner, we randomly selected and repeated 100 times from the reference genome, the same number of sequences used in the GC content analysis and mapped it back to the reference genome. We then calculated the absolute differences between each treatment and the simulated treatment to create a measure of bias and then compared said measure among all treatments using Welch's two-tailed t test. For the sequences from the field samples, we first compared the transposon-based method to the MDA method based on the mean percentage of sequences that match Prochlorococcus and Synechococcus sorted samples collected during different cruises and depths. We used stand-alone BLASTx to compare our sequences to a database comprising 3 SAR11 lineages, 22 cyanophages, 12 Synechococcus, and 15 Prochlorococcus genomes. We averaged the calculated percentage of matched sequences across all our Prochlorococcus sorted surface, 80-m depth, and Synechococcus surface samples to obtain a mean percentage of matched sequences as a representation for each genome of interest. The comparison across the two methods was calculated using Student's t test. We then used the same database to obtain a taxonomic profile. We used the top hit results as a proxy for determining which species was present. One caveat of this method is that for highly conserved genes, there are sometimes multiple equally likely top hits, which can cause the relative abundance of certain clades to be slightly misrepresented. In our case, we used a nonaxenic Synechococcus WH7803 strain (around 12% contamination by heterotrophic bacteria) in order to mimic a mixed population. According to our results based on the genomic DNA sample, an 82% match would be the maximum percent match that could be obtained. In order to determine whether nonmatching sequences were related to other lineages, we took a subset of sequences and blasted them against the NCBI NR database, and the sequences did not return any acceptable match to any known organisms based on the E value of 0.05. Gene abundances for sorted field populations were normalized to the length and mean abundance according to a gamma distribution of core genes as previously described (9) and then we estimated the distribution of nitrogen and phosphate genes (accession numbers in Table S3 in the supplemental material). The gene abundances of sorted Prochlorococcus nitrogen and phosphate genes were compared between surface and 80-m-deep water samples using Welch's t test and PERMANOVA (“adonis” in the “vegan” package in R [28]). For Synechococcus sorted samples, we compared the abundances of nitrogen and phosphate genes at the surface at BATS and at a depth of 80 m and in the California Current at the surface. We also compared the gene abundances for all genes of the Synechococcus sorted sample from the California Current to bulk nonamplified nonsorted seawater sample. Samples were normalized to the same number of matched sequences to Synechococcus WH8102 and sequence size (60 bp); sequences were analyzed by comparing the differences in distribution and gene abundance. We plotted the abundances of each gene found between each method and estimated the correlation between methods to assess for any bias. Whole raw sequences were also used to estimate the proportion of Synechococcus clades present in both samples and the difference in matched sequences to Synechococcus between methods.
Nucleotide sequence accession numbers.
The GenBank accession numbers for the sequences are separated into two bioprojects: PRJNA215901 for the environmental metagenomes, containing 26 metagenomes from SRS503713 to SRS503738, and PRJNA214889 for the Synechococcus WH7803 cultures, containing 12 metagenomes from SRS503739 to SRS503749 and SRS498470 (see Tables S4 and S5 in the supplemental material).
RESULTS
Bias assessment of transposon-based and MDA-based methods.
In order to assess potential biases and validate a transposon-based method, we performed a series of experiments using the Synechococcus WH7803 culture. We first tested which cell lysis method resulted in the best DNA extraction and found that a bead beating method led to the largest amount of extracted DNA (see Fig. S2 in the supplemental material).
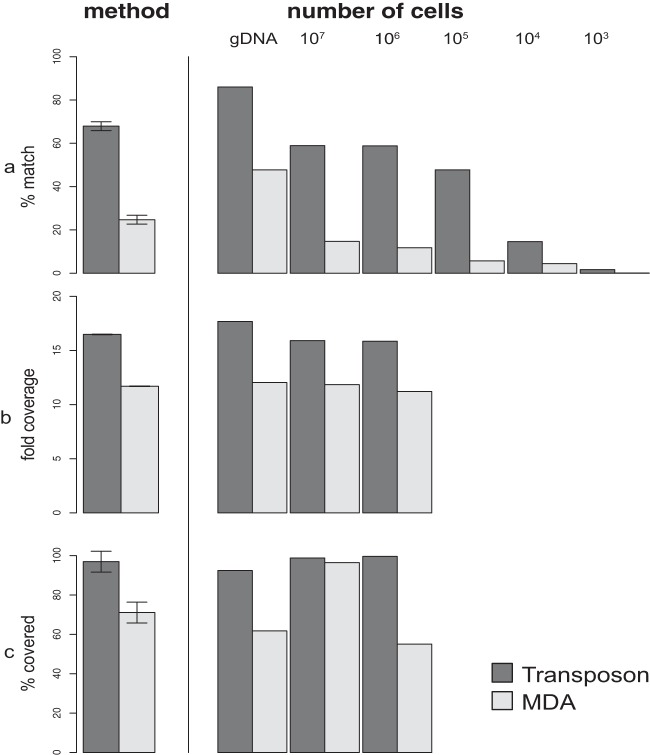
We next examined the effects of starting cell material on the quality of the sequence libraries. This effect was quantified as the number of sequences that matched the reference genome and fold genome coverage, evenness, and fraction of the genome captured. The starting number of cells had an important effect on both the modified transposon and MDA-based techniques. First, the number of PCR cycles needed to reach a threshold value of DNA concentration decreased significantly as a function of input cell number in the transposon-based technique (Fig. 1). Furthermore, a DNA library starting with 1,000 cells was indistinguishable from the negative control. Second, the fraction of high-quality sequences with a match to the reference genome was significantly positively related to input cell number for both methods (P < 0.001) (Fig. 2a). If we started with 1,000 cells, less than 5% of sequences matched the reference genome, whereas the rest had no match in NCBI and likely were spurious sequences. In contrast, between 10% for the MDA method and 60% for the transposon-based method of the sequences matched the reference genome with either 106 or 107 starting cells. However, for the matching sequences, we observed only a limited influence of input DNA on fold genome coverage for both techniques (Fig. 2b and c).
FIG 1.
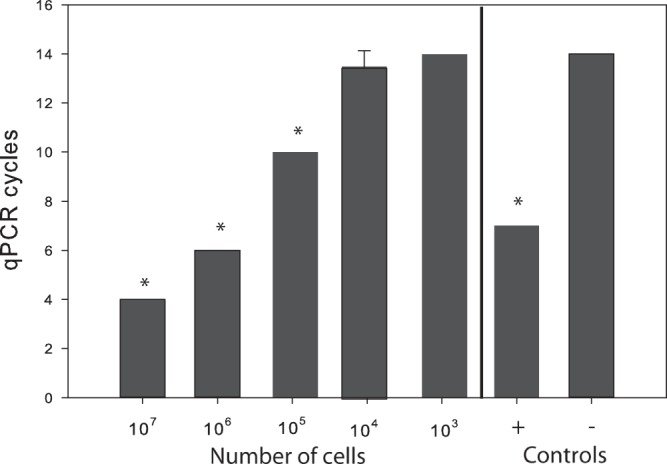
Relationship between the number of starting cells versus the number of quantitative PCR (qPCR) cycles required to reach an estimated threshold of DNA amplification equivalent to a fluorescence value of 2,000 during the first step of transposon-based library preparation (above 2,000 arbitrary value, the negative control starts to amplify). Asterisks indicate statistically significant (P < 0.05 by Student's t test) differences between the number of cells and the value for the negative (−) control (0 ng DNA). The positive (+) control is equal to 2 ng of DNA.
FIG 2.
Comparison of the effect of the method (MDA versus transposon-based library preparation technique) and effect of the starting number of cells as a function of percent matched sequences, fold coverage, and percent covered per base. The two methods gave significantly different values (P < 0.001 for all values). gDNA (genomic DNA) represents 2 ng of directly extracted input DNA.
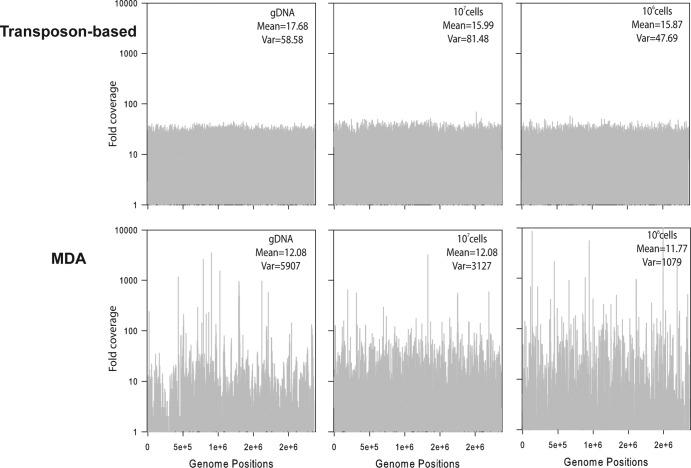
We also saw a significant effect of method (Fig. 2, P < 0.001), as the transposon-based technique consistently resulted in more high-quality sequences and genome coverage. For the MDA method, less than 20% of the sequences matched the reference genome (Fig. 2a). In contrast, the transposon-based approach resulted in more than 60% matching sequences. The average fold coverage was significantly lower for the MDA method (∼11) than for the transposon-based (∼17) method (Fig. 2b and c, P < 0.001). In addition, the MDA approach generated spikes of regions with more than 1,000-fold coverage, while other regions were poorly covered (Fig. 3). Thus, the transposon-based technique provided more even coverage of the genome. We then evaluated the fraction of the genome covered and found that the transposon-based technique captured 99.4% of the genome if we used 106 to 107 cells as input DNA with the current applied amount of sequencing. For MDA samples, there was greater inconsistency and a decreased part of the genome was covered at least once.
FIG 3.
Frequency distribution of Synechococcus WH7803 genome positions versus the number of times each position was covered (log scale) by transposon-based and MDA methods. The mean and variance (Var) were calculated using a gamma distribution. gDNA represent directly extracted 2 ng of input DNA.
One common bias using MDA is a tendency for overrepresentation of regions with a high GC content (29). Thus, we compared both methods to determine whether there was an effect of the method on GC content and fold coverage for both MDA and transposon-based methods (see Fig. S3 in the supplemental material). Figure S3 displays for each GC content level (0 to 100%) the mean read fold coverage of 60-bp reference segments and the randomly matched fragments from the reference genome. We found that independently of method, there was a significant GC bias (P < 0.005) but no clear difference between methods (P > 0.05). However, the transposon-based method appeared to be more consistent, as the input DNA amount or source had no effect of GC coverage or bias (P > 0.005), whereas the MDA genomic DNA treatment differed significantly from the MDA treatment of 107 cells in both cases (P > 0.05).
Analysis of field populations.
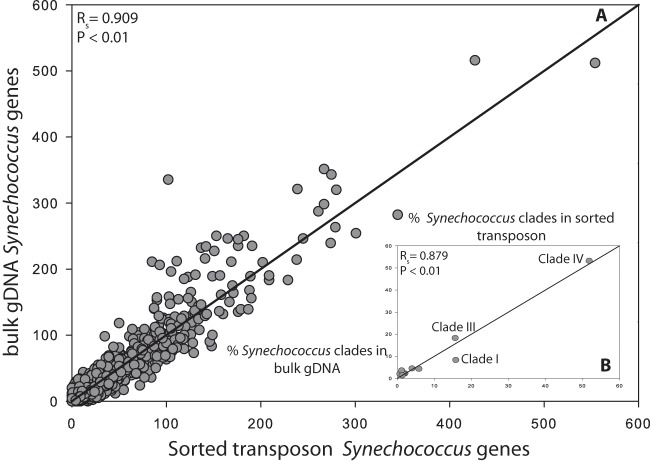
We then compared the transposon and MDA techniques using flow cytometrically sorted field samples of Prochlorococcus and Synechococcus (Fig. 4). Across samples, the transposon-based method resulted in a higher fraction of quality sequences matching the reference genome. We also compared directly sequenced bulk DNA and sorted Synechococcus from one sample (California Current). Not surprisingly, the sorted sample contained a higher proportion of Synechococcus sequences (see Fig. S4 in the supplemental material). However, when normalized to the same number of matched sequences to Synechococcus reference genomes, we found a high correlation of the sorted and bulk sample for both gene abundances (Spearman's rank correlation coefficient [RSpearman] = 0.909; P < 0.001) and phylogenetic composition (RSpearman = 0.879; P < 0.001) (Fig. 5). We also compared the abundances of specific nutrient assimilation genes between the bulk and sorted Synechococcus sample and again found high similarity in the distribution of the genes (Fig. S5). Thus, we utilized the transposon-based technique to compare the metagenomic phylogenetic and gene content of six each of Prochlorococcus and Synechococcus field populations from the western North Atlantic (BATS station) and California Current (MICRO station) isolated by flow cytometry (Fig. 6). The sorted Synechococcus samples contained between 92 and 97% sequences with a best match to Synechococcus strains. Clade III appeared to be the dominant phylotype at the surface (78%) and 80-m-depth (40%) samples from the western North Atlantic Ocean. In contrast, clade IV (52%) and clade I (16%) were more common in the California Current surface water samples. Prochlorococcus constituted 41% of the sorted surface samples and 66.6% of the 80-m samples. This, there appeared to be a substantial presence of other DNA material in the surface Prochlorococcus sample particularly. The surface and 80-m samples had a different phylogenetic composition. The surface sample was dominated by eMIT9312 clade (58%), whereas eNATL was more common at a depth of 80 m. We found very few sequences that matched cyanophages in any of the samples (<1%).
FIG 4.
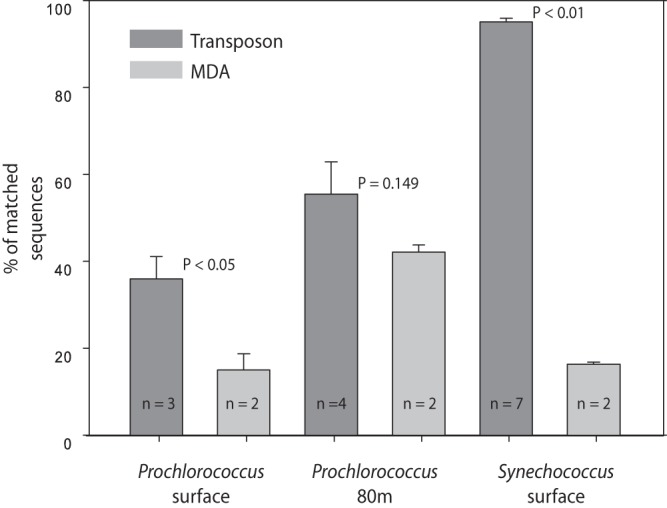
Comparison of transposon-based and MDA methods estimated as the mean percentages of sequences that match the genome of interest. Error bars denote standard errors, and n is the number of samples. P values were calculated using Student's t test.
FIG 5.
Whole-genome comparison between two California Current samples: unsorted unamplified bulk seawater prepared with TruSeq Illumina and Synechococcus sorted transposon-based library preparation with Illumina sequencing. (A) Comparison between Synechococcus sorted transposon sample (x axis) and bulk unsorted environmental genomic DNA (gDNA) (y axis) from the California Current based on Synechococcus WH8102 gene abundance normalized to the same number of matched sequences. The correlation between gene abundances was determined using Spearman's rank test (Spearman's rank correlation coefficient [RSpearman] [RS in the figure] = 0.909; P < 0.01). Gray circles represent the abundance of each gene in a sample. (B) Comparison between the distribution of different Synechococcus clades present in the samples based on a BLAST analysis of 12 Synechococcus complete genomes (gray circles). The correlation between the distribution of clades was determined using Spearman's rank test (RSpearman = 0.879; P < 0.01). The black line is the (1,1) line for both panels.
FIG 6.
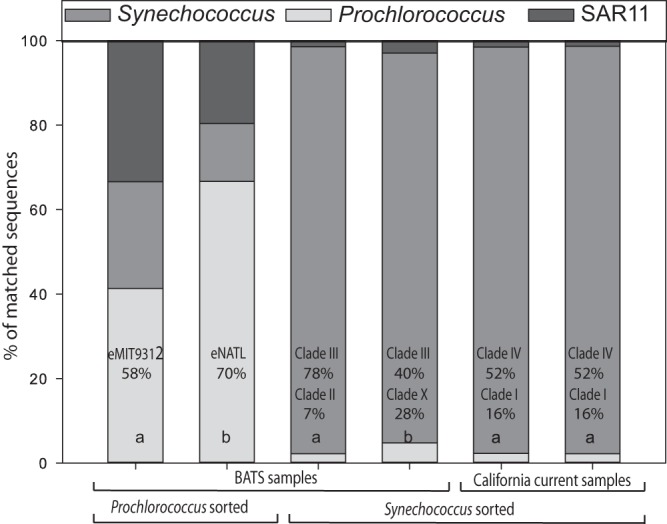
Comparison of taxonomic profiles from Prochlorococcus and Synechococcus (surface water [a]) and water at a depth of 80 m) sorted environmental samples from BATS and California Current estimated from a whole-genome BLASTx approach. For each sample, we estimated the proportion of matched sequences from Prochlorococcus, Synechococcus, and SAR11 lineages. We also noted which clades the samples are most representative of.
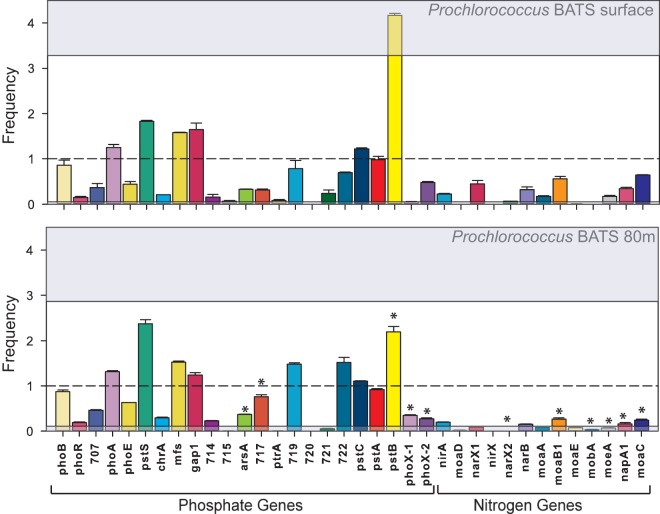
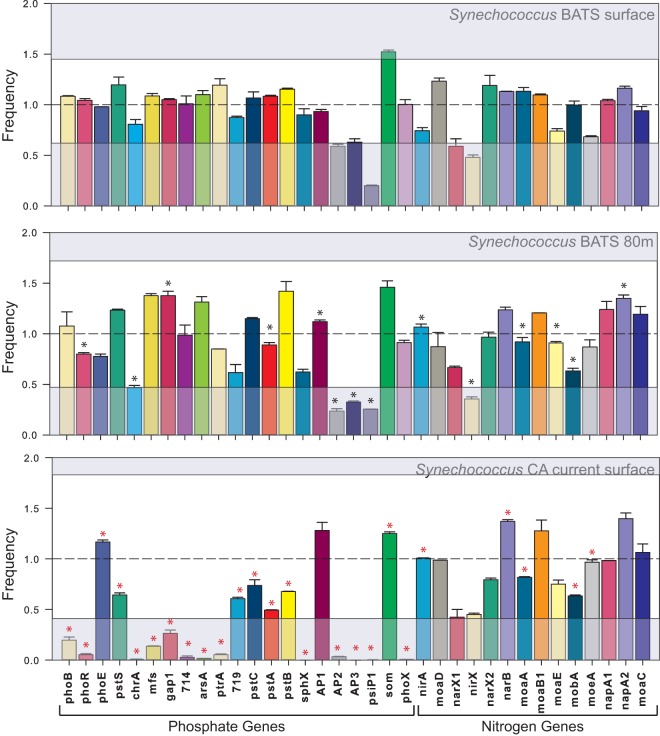
The population-specific Prochlorococcus and Synechococcus metagenomic data sets were also analyzed for the abundance and diversity of genes involved in phosphate and nitrogen assimilation (Fig. 7 and 8; see Table S3 in the supplemental material). We detected genes involved in nitrate acquisition, such as narB and nirA that previously had been associated with Prochlorococcus (30). We also saw a significant decline in the abundance of nitrogen acquisition genes between the surface water and the water at a depth of 80 m for Prochlorococcus, whereas phosphate genes were generally found in similar abundances at the two depths. However, the alkaline phosphatase phoX gene was significantly more abundant in the 80-m-depth samples, whereas phoA was found at comparable amounts between both depths (P < 0.05). In Synechococcus, around 14 out of 35 of the nitrogen and phosphate genes were significantly different between the surface water and 80-m-depth water samples at BATS, but almost all of the phosphate genes and a few nitrogen genes were significantly present in lower numbers in the California Current samples compared to BATS (P < 0.05). However, the samples did not differ significantly overall from each other (PERMANOVA, P > 0.05).
FIG 7.
Nitrogen and phosphate acquisition genes in Prochlorococcus sorted samples from BATS (surface water and water from a depth of 80 m; samples taken in August 2010). Samples for transposon-based library preparations were prepared in duplicate samples, and the error bars represent the standard deviations between the abundances of each gene. The top gray box shows the upper confidence interval, and the bottom gray box shows the low end confidence interval of the gamma distribution into which the samples were fit. The broken line at a frequency of 1 corresponds to the mean of the gamma distribution. Asterisks indicate statistically significant (P < 0.05 by Welch's t test) differences between the same genes across the two different depths (surface and 80 m) presented in the figure.
FIG 8.
Nitrogen and phosphate acquisition genes in Synechococcus sorted samples from BATS (surface and water from a depth of 80 m; samples taken in August 2010) and the California Current (surface water; samples taken in February 2011). Samples for transposon-based library preparations were prepared in duplicate samples, and the error bars represent the standard deviations between the abundances of each gene. Boxes and broken line are as explained in the legend to Fig. 7. Asterisks indicate statistically significant (P < 0.05 by Welch's t test) differences between the same genes at the two different depths (surface and 80 m) (black asterisks) and at the two locations (California [CA] current and BATS surface) (red asterisks) presented in the figure.
DISCUSSION
A limitation of traditional metagenomic techniques is the difficulty of targeting rare populations. Building on past studies combining cell sorting and whole-genome amplification, we here demonstrate that cell sorting combined with an extensively modified transposon-based library preparation technique results in higher fold coverage in culture samples, better matching of the reference genome, and better detection of specific genes in field samples in comparison to MDA. We modified the Nextera protocol so that less input DNA is required for the library preparation and sample diversity is conserved. We added a protein digestion step following the tagmentation reaction and monitored the first PCR to prevent overamplification, which can lead to libraries with high clonal rates and/or high fraction of chimeric sequences. The method is also considerably faster than regular techniques. Further, we found that the lysis technique used was very important for amplifying and sequencing the cells. Thus, by modifying the common transposon technique to lower the input DNA requirement and utilizing the appropriate lysis technique, we can now target <1 ng of input DNA.
There are some limitations with the technique. We find comparable levels of GC bias by both methods. The latter is in accordance with recent findings where a transposon-based protocol can introduce some coverage and GC biases (23). The minimum amount of cells needed for metagenomic libraries can likely be reduced by a more rigorous DNA contamination removal of all reagents (16), but this was not necessary for our purpose as we can easily sort >106 Prochlorococcus or Synechococcus cells from most ocean environments. However, the amount of input DNA is a possible limitation of the technique, and we observed that one of our Prochlorococcus field samples was partly compromised from contaminating DNA. There is a noticeable difference in purity between the surface water sorted Prochlorococcus samples and the samples taken from a depth of 80 m. The surface population is subject to a less specific sort, as we aim to capture rare Prochlorococcus subpopulations and therefore are not conservative with our sorting. There is also lower chlorophyll content in Prochlorococcus cells at the surface, which makes it more difficult to separate them from heterotrophic cells (31). Furthermore, the Prochlorococcus samples required more amplification steps than the Synechococcus sorted samples, and thus we recommend sorting more Prochlorococcus cells for the future application of this technique to avoid obtaining nontarget sequences. This requirement could be due to the fact that Prochlorococcus cells contain less DNA and have a smaller genome size, and therefore, more cycles of amplification are required, which can introduce contaminating DNA amplification (7). In contrast, we have high purity in the Synechococcus sorted samples. Thus, it is important to monitor the number of PCR cycles needed in the transposon-based protocol, as this provides an accurate indication of downstream issues with sequencing and contamination. Our method was mostly tested using Synechococcus cultures, and some uncertainties may occur with Prochlorococcus, which could be explained by their difference in GC content, genome size, and effect of cell lysis. However, transposon-based approaches for sequencing library preparation have previously been used on a variety of organisms (23, 32, 33). Thus, we expect that the modified technique can be useful for organisms other than cyanobacteria.
We also tested this method on environmental samples and found a high correlation between regular metagenomics on bulk DNA and our technique for both gene abundance and phylogenetic composition. In addition, we were able to phylogenetically resolve different populations and specific genes of interest for Prochlorococcus and Synechococcus. For Prochlorococcus, the surface water sample was dominated by the high-light-adapted eMIT9312 clade, whereas the 80-m-deep water sample was dominated by the eNATL clade commonly found at intermediate depths. For Synechococcus, we find that clade III dominated the oligotrophic samples at BATS and that clade IV was more common in coastal waters off California. This is consistent with past studies of Prochlorococcus and Synechococcus phylogenetic diversity in these regions (34–36). We also quantified the distribution of nitrogen and phosphate acquisition genes. Evidence from uncultured lineages and metagenomic data suggest that there is direct assimilation of nitrate by Prochlorococcus (30, 37). In support of this, we found Prochlorococcus variants of nitrate assimilation genes in sorted Prochlorococcus cells but not in the sorted Synechococcus cells. We also detected the two variants of phoX that are putatively associated with Prochlorococcus (38). The pstS and pstB genes responsible for the transport of orthophosphate are found to be very abundant (higher than the mean), which is consistent with the presence of multiple copies of these genes in some Prochlorococcus and Synechococcus strains (12, 39). For the Synechococcus samples, we observed mostly similar abundances in genes from BATS at both the surface and at a depth of 80 m, while we observed a significant decrease in phosphate gene abundances in the California Current sample. This difference in phosphate acquisition gene content between BATS and California Current has also been observed in the genomes of Synechococcus strains (40), and the difference in gene abundance between the two depths may be related to the amounts of nitrogen and phosphate available (41). At low ambient nutrient concentrations, we expect the abundance of genes involved in nutrient acquisition to be higher. At BATS, in the surface water and water at a depth of 80 m, phosphate, nitrate, and nitrite concentrations were reported to be less than 30 nM (42), whereas the concentrations were above 100 nM in the California Current. Thus, the differences in nutrient concentration may explain decreased abundance of phosphate assimilation genes in the California Current sample compared to BATS.
The main advantage of our method is the combination of cell sorting and metagenomics to obtain improved fold coverage and taxonomic profiles and resolve genes of interest. Despite the low abundance of cells at lower depths, we are still able to capture our population of interest and observe how genes change across ecological gradients. In summary, our method provides a considerable improvement over more conventional methods for metagenomic sequencing and can be used for assessing the genomic diversity of marine cyanobacteria populations in different ocean regions.
Supplementary Material
ACKNOWLEDGMENTS
We thank Jennifer Martiny, Tony Long, Debra Lomas, and Stephen Hatosy for valuable contributions and technical assistance.
This work was funded by the NSF Dimensions of Biodiversity (M.W.L., K.Z., and A.C.M.) and Biological Oceanography programs (M.W.L. and A.C.M.).
Footnotes
Published ahead of print 2 December 2013
Supplemental material for this article may be found at http://dx.doi.org/10.1128/AEM.02834-13.
REFERENCES
- 1.Field CB. 1998. Primary production of the biosphere: integrating terrestrial and oceanic components. Science 281:237–240. 10.1126/science.281.5374.237 [DOI] [PubMed] [Google Scholar]
- 2.Flombaum P, Gallegos JL, Gordillo RA, Rincon J, Zabala LL, Jiao N, Karl DM, Li WK, Lomas MW, Veneziano D, Vera CS, Vrugt JA, Martiny AC. 2013. Present and future global distributions of the marine cyanobacteria Prochlorococcus and Synechococcus. Proc. Natl. Acad. Sci. U. S. A. 110:9824–9829. 10.1073/pnas.1307701110 [DOI] [PMC free article] [PubMed] [Google Scholar]
- 3.Johnson ZI, Zinser ER, Coe A, McNulty NP, Woodward EM, Chisholm SW. 2006. Niche partitioning among Prochlorococcus ecotypes along ocean-scale environmental gradients. Science 311:1737–1740. 10.1126/science.1118052 [DOI] [PubMed] [Google Scholar]
- 4.Zwirglmaier K, Jardillier L, Ostrowski M, Mazard S, Garczarek L, Vaulot D, Not F, Massana R, Ulloa O, Scanlan DJ. 2008. Global phylogeography of marine Synechococcus and Prochlorococcus reveals a distinct partitioning of lineages among oceanic biomes. Environ. Microbiol. 10:147–161. 10.1111/j.1462-2920.2007.01440.x [DOI] [PubMed] [Google Scholar]
- 5.Paerl RW, Johnson KS, Welsh RM, Worden AZ, Chavez FP, Zehr JP. 2011. Differential distributions of Synechococcus subgroups across the California current system. Front. Microbiol. 2:59. 10.3389/fmicb.2011.00059 [DOI] [PMC free article] [PubMed] [Google Scholar]
- 6.Dufresne A, Ostrowski M, Scanlan DJ, Garczarek L, Mazard S, Palenik BP, Paulsen IT, de Marsac NT, Wincker P, Dossat C, Ferriera S, Johnson J, Post AF, Hess WR, Partensky F. 2008. Unraveling the genomic mosaic of a ubiquitous genus of marine cyanobacteria. Genome Biol. 9:R90. 10.1186/gb-2008-9-5-r90 [DOI] [PMC free article] [PubMed] [Google Scholar]
- 7.Partensky F, Blanchot J, Vaulot D. 1999. Differential distribution and ecology of Prochlorococcus and Synechococcus in oceanic waters: a review. Bull. Inst. Oceanogr. 19:457–475 [Google Scholar]
- 8.Moore LR, Rocap G, Chisholm SW. 1998. Physiology and molecular phylogeny of coexisting Prochlorococcus ecotypes. Nature 393:464–467. 10.1038/30965 [DOI] [PubMed] [Google Scholar]
- 9.Martiny AC, Tai AP, Veneziano D, Primeau F, Chisholm SW. 2009. Taxonomic resolution, ecotypes and the biogeography of Prochlorococcus. Environ. Microbiol. 11:823–832. 10.1111/j.1462-2920.2008.01803.x [DOI] [PubMed] [Google Scholar]
- 10.Rusch DB, Martiny AC, Dupont CL, Halpern AL, Venter JC. 2010. Characterization of Prochlorococcus clades from iron-depleted oceanic regions. Proc. Natl. Acad. Sci. U. S. A. 107:16184–16189. 10.1073/pnas.1009513107 [DOI] [PMC free article] [PubMed] [Google Scholar]
- 11.Rocap G, Distel DL, Waterbury JB, Chisholm SW. 2002. Resolution of Prochlorococcus and Synechococcus ecotypes by using 16S-23S ribosomal DNA internal transcribed spacer sequences. Appl. Environ. Microbiol. 68:1180–1191. 10.1128/AEM.68.3.1180-1191.2002 [DOI] [PMC free article] [PubMed] [Google Scholar]
- 12.Martiny AC, Coleman ML, Chisholm SW. 2006. Phosphate acquisition genes in Prochlorococcus ecotypes: evidence for genome-wide adaptation. Proc. Natl. Acad. Sci. U. S. A. 103:12552–12557. 10.1073/pnas.0601301103 [DOI] [PMC free article] [PubMed] [Google Scholar]
- 13.Kettler GC, Martiny AC, Huang K, Zucker J, Coleman ML, Rodrigue S, Chen F, Lapidus A, Ferriera S, Johnson J, Steglich C, Church GM, Richardson P, Chisholm SW. 2007. Patterns and implications of gene gain and loss in the evolution of Prochlorococcus. PLoS Genet. 3:e231. 10.1371/journal.pgen.0030231 [DOI] [PMC free article] [PubMed] [Google Scholar]
- 14.Mazard S, Ostrowski M, Partensky F, Scanlan DJ. 2012. Multi-locus sequence analysis, taxonomic resolution and biogeography of marine Synechococcus. Environ. Microbiol. 14:372–386. 10.1111/j.1462-2920.2011.02514.x [DOI] [PubMed] [Google Scholar]
- 15.Rusch DB, Halpern AL, Sutton G, Heidelberg KB, Williamson S, Yooseph S, Wu D, Eisen JA, Hoffman JM, Remington K, Beeson K, Tran B, Smith H, Baden-Tillson H, Stewart C, Thorpe J, Freeman J, Andrews-Pfannkoch C, Venter JE, Li K, Kravitz S, Heidelberg JF, Utterback T, Rogers YH, Falcon LI, Souza V, Bonilla-Rosso G, Eguiarte LE, Karl DM, Sathyendranath S, Platt T, Bermingham E, Gallardo V, Tamayo-Castillo G, Ferrari MR, Strausberg RL, Nealson K, Friedman R, Frazier M, Venter JC. 2007. The Sorcerer II Global Ocean Sampling expedition: northwest Atlantic through eastern tropical Pacific. PLoS Biol. 5:e77. 10.1371/journal.pbio.0050077 [DOI] [PMC free article] [PubMed] [Google Scholar]
- 16.Zhang K, Martiny AC, Reppas NB, Barry KW, Malek J, Chisholm SW, Church GM. 2006. Sequencing genomes from single cells by polymerase cloning. Nat. Biotechnol. 24:680–686. 10.1038/nbt1214 [DOI] [PubMed] [Google Scholar]
- 17.Lasken RS. 2012. Genomic sequencing of uncultured microorganisms from single cells. Nat. Rev. Microbiol. 10:631–640. 10.1038/nrmicro2857 [DOI] [PubMed] [Google Scholar]
- 18.Zehr JP, Bench SR, Carter BJ, Hewson I, Niazi F, Shi T, Tripp HJ, Affourtit JP. 2008. Globally distributed uncultivated oceanic N2-fixing cyanobacteria lack oxygenic photosystem II. Science 322:1110–1112. 10.1126/science.1165340 [DOI] [PubMed] [Google Scholar]
- 19.Palenik B, Ren Q, Tai V, Paulsen IT. 2009. Coastal Synechococcus metagenome reveals major roles for horizontal gene transfer and plasmids in population diversity. Environ. Microbiol. 11:349–359. 10.1111/j.1462-2920.2008.01772.x [DOI] [PubMed] [Google Scholar]
- 20.Cuvelier ML, Allen AE, Monier A, McCrow JP, Messie M, Tringe SG, Woyke T, Welsh RM, Ishoey T, Lee JH, Binder BJ, DuPont CL, Latasa M, Guigand C, Buck KR, Hilton J, Thiagarajan M, Caler E, Read B, Lasken RS, Chavez FP, Worden AZ. 2010. Targeted metagenomics and ecology of globally important uncultured eukaryotic phytoplankton. Proc. Natl. Acad. Sci. U. S. A. 107:14679–14684. 10.1073/pnas.1001665107 [DOI] [PMC free article] [PubMed] [Google Scholar]
- 21.Mazard S, Ostrowski M, Garczarek L, Scanlan DJ. 2011. A targeted metagenomic approach to determine the “population genome” of marine Synechococcus, p 301–307 In de Bruijn FJ. (ed), Handbook of molecular microbial ecology, vol II Metagenomics in different habitats. Wiley-Blackwell, Hoboken, NJ [Google Scholar]
- 22.Pinard R, de Winter A, Sarkis GJ, Gerstein MB, Tartaro KR, Plant RN, Egholm M, Rothberg JM, Leamon JH. 2006. Assessment of whole genome amplification-induced bias through high-throughput, massively parallel whole genome sequencing. BMC Genomics 7:216. 10.1186/1471-2164-7-216 [DOI] [PMC free article] [PubMed] [Google Scholar]
- 23.Marine R, Polson SW, Ravel J, Hatfull G, Russell D, Sullivan M, Syed F, Dumas M, Wommack KE. 2011. Evaluation of a transposase protocol for rapid generation of shotgun high-throughput sequencing libraries from nanogram quantities of DNA. Appl. Environ. Microbiol. 77:8071–8079. 10.1128/AEM.05610-11 [DOI] [PMC free article] [PubMed] [Google Scholar]
- 24.Waterbury JB, Watson SW, Valois FW, Franks DG. 1987. Biological and ecological characterization of the marine unicellular cyanobacterium Synechococcus. Can. Bull. Fish. Aquat. Sci. 214:71–120 [Google Scholar]
- 25.Allison SD, Chao Y, Farrara JD, Hatosy S, Martiny AC. 2012. Fine-scale temporal variation in marine extracellular enzymes of coastal southern California. Front. Microbiol. 3:301. 10.3389/fmicb.2012.00301 [DOI] [PMC free article] [PubMed] [Google Scholar]
- 26.Bostrom K, Simu K, Hagstrom A, Riemann L. 2004. Optimization of DNA extraction for quantitative marine bacterioplankton community analysis. Limnol. Oceanogr. 2:365–373. 10.4319/lom.2004.2.365 [DOI] [Google Scholar]
- 27.Andrews S. 2010. FastQC (version 0.10.1). Babraham Institute, Cambridge, United Kingdom: http://www.bioinformatics.babraham.ac.uk/projects/fastqc/ [Google Scholar]
- 28.Oksanen J, Blanchet FG, Kindt R, Legendre P, Minchin R, O'Hara B, Simpson GL, Solymos P, Stevens MHH, Wagner H. 2002. vegan: Community Ecology Package. R package version 2.0-3. http://cran.r-project.org/web/packages/vegan/index.html. [Google Scholar]
- 29.Abulencia CB, Wyborski DL, Garcia JA, Podar M, Chen W, Chang SH, Chang HW, Watson D, Brodie EL, Hazen TC, Keller M. 2006. Environmental whole-genome amplification to access microbial populations in contaminated sediments. Appl. Environ. Microbiol. 72:3291–3301. 10.1128/AEM.72.5.3291-3301.2006 [DOI] [PMC free article] [PubMed] [Google Scholar]
- 30.Martiny AC, Kathuria S, Berube PM. 2009. Widespread metabolic potential for nitrite and nitrate assimilation among Prochlorococcus ecotypes. Proc. Natl. Acad. Sci. U. S. A. 106:10787–10792. 10.1073/pnas.0902532106 [DOI] [PMC free article] [PubMed] [Google Scholar]
- 31.Chisholm SW, Frankel SL, Goericke R, Olson RJ, Palenik B, Waterbury JB, West-Johnsrud L, Zettler ER. 1992. Prochlorococcus marinus nov. gen. nov. sp.: an oxyphototrophic marine prokaryote containing divinyl chlorophyll a and b. Arch. Microbiol. 157:297–300. 10.1007/BF00245165 [DOI] [Google Scholar]
- 32.Adey A, Shendure J. 2012. Ultra-low-input, tagmentation-based whole-genome bisulfite sequencing. Genome Res. 22:1139–1143. 10.1101/gr.136242.111 [DOI] [PMC free article] [PubMed] [Google Scholar]
- 33.Faircloth BC, McCormack JE, Crawford NG, Harvey MG, Brumfield RT, Glenn TC. 2012. Ultraconserved elements anchor thousands of genetic markers spanning multiple evolutionary timescales. Syst. Biol. 61:717–726. 10.1093/sysbio/sys004 [DOI] [PubMed] [Google Scholar]
- 34.Malmstrom RR, Coe A, Kettler GC, Martiny AC, Frias-Lopez J, Zinser ER, Chisholm SW. 2010. Temporal dynamics of Prochlorococcus ecotypes in the Atlantic and Pacific oceans. ISME J. 4:1252–1264. 10.1038/ismej.2010.60 [DOI] [PubMed] [Google Scholar]
- 35.Tai V, Palenik B. 2009. Temporal variation of Synechococcus clades at a coastal Pacific Ocean monitoring site. ISME J. 3:903–915. 10.1038/ismej.2009.35 [DOI] [PubMed] [Google Scholar]
- 36.Zwirglmaier K, Spence E, Zubkov MV, Scanlan DJ, Mann NH. 2009. Differential grazing of two heterotrophic nanoflagellates on marine Synechococcus strains. Environ. Microbiol. 11:1767–1776. 10.1111/j.1462-2920.2009.01902.x [DOI] [PubMed] [Google Scholar]
- 37.Casey JR, Lomas MW, Michelou VK, Dyhrman ST, Orchard ED, Ammerman JW, Sylvan JB. 2009. Phytoplankton taxon-specific orthophosphate (Pi) and ATP utilization in the western subtropical North Atlantic. Aquat. Microb. Ecol. 58:31–44. 10.3354/ame01348 [DOI] [Google Scholar]
- 38.Kathuria S, Martiny AC. 2011. Prevalence of a calcium-based alkaline phosphatase associated with the marine cyanobacterium Prochlorococcus and other ocean bacteria. Environ. Microbiol. 13:74–83. 10.1111/j.1462-2920.2010.02310.x [DOI] [PubMed] [Google Scholar]
- 39.Scanlan DJ, Ostrowski M, Mazard S, Dufresne A, Garczarek L, Hess WR, Post AF, Hagemann M, Paulsen I, Partensky F. 2009. Ecological genomics of marine picocyanobacteria. Microbiol. Mol. Biol. Rev. 73:249–299. 10.1128/MMBR.00035-08 [DOI] [PMC free article] [PubMed] [Google Scholar]
- 40.Palenik B, Ren Q, Dupont CL, Myers GS, Heidelberg JF, Badger JH, Madupu R, Nelson WC, Brinkac LM, Dodson RJ, Durkin AS, Daughterty SC, Sullivan SA, Khouri H, Mohamoud Y, Halpin R, Paulsen IT. 2006. Genome sequence of Synechococcus CC9311: insights into adaptation to a coastal environment. Proc. Natl. Acad. Sci. U. S. A. 103:13555–13559. 10.1073/pnas.0602963103 [DOI] [PMC free article] [PubMed] [Google Scholar]
- 41.Martiny AC, Huang Y, Li W. 2009. Occurrence of phosphate acquisition genes in Prochlorococcus cells from different ocean regions. Environ. Microbiol. 11:1340–1347. 10.1111/j.1462-2920.2009.01860.x [DOI] [PubMed] [Google Scholar]
- 42.Lomas MW, Bates NR, Johnson RJ, Knap AH, Steinberg DK, Carlson CA. 2013. Two decades and counting: 24-years of sustained open ocean biogeochemical measurements in the Sargasso Sea. Deep Sea Res. Part II Top. Stud. Oceanogr. 93:16–32. 10.1016/j.dsr2.2013.01.008 [DOI] [Google Scholar]
Associated Data
This section collects any data citations, data availability statements, or supplementary materials included in this article.


