Abstract
LSD1 is essential for the maintenance of pluripotency of embryonic stem (ES) or embryonic carcinoma/teratocarcinoma (EC) cells. We have previously developed novel LSD1 inhibitors that selectively inhibit ES/EC cells. However, the critical targets of LSD1 remain unclear. Here, we found that LSD1 interacts with histone deacetylase 1 (HDAC1) to regulate the proliferation of ES/EC cells through acetylation of histone H4 at lysine 16 (H4K16), which we show is a critical substrate of HDAC1. The LSD1 demethylase and HDAC1 deacetylase activities were both inactivated if one of them in the complex was chemically inhibited in ES/EC cells or in reconstituted protein complexes. Loss of HDAC1 phenocopied the selective growth-inhibitory effects and increased the levels of H3K4 methylation and H4K16 acetylation of LSD1 inactivation on ES/EC cells. Reduction of acetylated H4K16 by ablation of the acetyltransferase males absent on the first (MOF) is sufficient to rescue the growth inhibition induced by LSD1 inactivation. While LSD1 or HDAC1 inactivation caused the downregulation of Sox2 and Oct4 and induction of differentiation genes, such as FOXA2 or BMP2, depletion of MOF restored the levels of Sox2, Oct4, and FoxA2 in LSD1-deficient cells. Our studies reveal a novel mechanism by which LSD1 acts through the HDAC1- and MOF-mediated regulation of H4K16 acetylation to maintain the pluripotency of ES/EC cells.
INTRODUCTION
Lysine-specific demethylase 1 (LSD1; or KDM1, AOF2, and BHC110) is a conserved flavin adenine dinucleotide (FAD)-dependent lysine-specific demethylase that primarily removes mono- and dimethyl groups from methylated histone H3 at lysine 4 (H3K4) (1) and, in some cells, histone H3 at lysine 9 (H3K9) (2). Although LSD1 alone can demethylate histones or methylated peptide substrates in vitro, it usually requires other proteins for the demethylation of nucleosomal or chromatin substrates in vivo due to the absence of a DNA binding domain (3). In HeLa human cervical carcinoma or 293 embryonic kidney cells, LSD1 is often found to be part of several multiprotein complexes that also contain CtBP, NuRD, CoREST, and/or histone deacetylase 1 (HDAC1)/HDAC2 (3–6). Loss of LSD1 in the mouse is embryonic lethal, but the underlying mechanism remains unclear (7). LSD1 is essential for the maintenance of pluripotency of embryonic stem (ES) cells (7–9), proliferation of normal neural stem cells, or the oncogenic potential of MLL-AF9 leukemia stem cells (10, 11). LSD1 expression is associated with high-risk cancer cells (12–17). We have previously designed novel LSD1 inhibitors that selectively inhibited the proliferation of pluripotent mouse ES cells and various embryonic carcinoma/teratocarcinoma (EC) cells that express pluripotent stem cell proteins Oct4, Sox2, Nanog, and Lin28 (17). These studies underscore the pivotal role of LSD1 in the maintenance of pluripotency or multipotency in various stem cells.
Histone deacetylase 1 (HDAC1) is a class I deacetylase that specifically removes the acetyl group from acetylated histone H3 at lysine 56 (H3K56) (18), which is involved in DNA replication, transcription, and DNA repair (19–24). Although HDAC1 and HDAC2 often coexist in many repressive transcriptional complexes, they may have distinct functions because germ line deletion of HDAC1 causes mouse embryo lethality before embryonic day 10.5, whereas HDAC2 specifically regulates synaptic plasticity and memory formation (7, 18, 25). A unique role of HDAC1 is also observed in ES cell differentiation. Deletion of HDAC1 but not HDAC2 in ES cells causes a significant reduction in the HDAC activity of Sin3A, NuRD, and CoREST corepressor complexes (18). HDAC1 is required for chromatin modification in development, and its activity is often altered in many cancers (26, 27). HDAC1 is highly expressed in pancreatic ductal adenocarcinoma and colorectal, ovarian, and lung carcinomas (28–31). A group of HDAC inhibitors has been developed for cancer therapy or the treatment of other human diseases (32, 33), but so far most of them are nonselective and interfere with the enzymatic activity of many HDACs.
The mammalian orthologue of the Drosophila melanogaster MOF (males absent on the first; also called MYST1 or KAT8) gene product is a histone H4 lysine 16 (H4K16)-specific acetyltransferase (34). It belongs to the MYST family of acetyltransferases and is a key component of the male-specific lethal (MSL) complex for the acetylation of H4K16 that is responsible for dosage compensation in Drosophila melanogaster and Caenorhabditis elegans (35–37). Mouse MOF deletion causes genome instability and early embryonic lethality (38, 39). The acetylation of H4K16 by MOF is a critical epigenetic signature for ES cells, embryogenesis, and oncogenesis (38, 40). Reduced expression of MOF and H4K16 acetylation are frequently found in cancer cells and primary tumors (41, 42). MOF also acts as a cofactor for Nanog-mediated transcription to maintain the expression of pluripotency-associated genes and to prime developmental genes for differentiation (38). Here, we found that the acetylation of H4K16 is a critical target of the LSD1-HDAC1 complex in ES/EC cells and the loss of MOF is sufficient to rescue the growth-inhibitory effects of LSD1 inactivation in ES and EC cells.
MATERIALS AND METHODS
Cell culture and siRNA.
Mouse ES cells, F9 teratocarcinoma cells, immortalized NIH 3T3 cells, and PA-1 human ovarian teratocarcinoma, HeLa cervical carcinoma, and HCT116 colorectal carcinoma cells were purchased from the American Type Culture Collection (ATCC). The mouse normal liver cell line NCTC1469 was from the Cell Center of Shanghai Institutes for Biological Sciences, Chinese Academy of Sciences. The cells were cultured as previously described (17). For mouse ES cells, they were cultured in knockout Dulbecco modified Eagle medium supplemented with 15% knockout serum replacement, 0.1 mM 2-mercaptoethanol, 200 mM l-glutamine, 1/100 (vol/vol) nonessential amino acids, and 1/100 (vol/vol) penicillin-streptomycin (all from Gibco) and 1/1,000 (vol/vol) leukemia inhibitory factor (Millipore). The ES cells were maintained on a feeder layer of mitomycin C-treated primary mouse embryonic fibroblasts (MEFs).
For the small interfering RNA (siRNA) assay, cells were seeded at a density of 30% confluence at 20 h before transfection and transfected with 50 nM the indicated siRNAs using the DharmaFECT transfection reagent (Thermo Scientific) for F9, NCTC1469, PA-1, and HCT116 cells, while Oligofectamine (Invitrogen) was used for HeLa and NIH 3T3 cells. Cells were harvested at 48 h after transfection. To optimize transfection efficiency in mouse ES (mES) cells, mES cells were passaged twice on plates coated with 0.1% gelatin and supplemented with ES cell complete medium recovered from MEFs. Mouse ES cells were cultured for 24 h prior to transfection and were transfected with 50 nM the indicated siRNAs using the DharmaFECT transfection reagent. The medium was replaced with fresh ES complete medium at 24 h after transfection, and samples were harvested 48 h later. The siRNAs used are listed in Table 1. To prevent potential off-target effects of siRNAs, at least two independent siRNAs against each target were designed and used. All of the siRNA experiments were repeated at least three times to ensure consistent results.
TABLE 1.
siRNAs
| siRNA name | Sequence (5′–3′) |
|---|---|
| Mouse-HDAC1 | GCAAGCAGATGCAGAGATT |
| Human-HDAC1 | GCAAGCAGATGCAGAGATT |
| Mouse-HDAC2 | CCAGAACACTCCAGAATAT |
| Human-HDAC2 | AGACTGATATGGCTGTTAA |
| Mouse-HDAC3 | GCATTGATGACCAGAGTTA |
| Human-HDAC3 | AAAGCGATGTGGAGATTTA |
| Mouse-HDAC6 | GGATGTTCATCATGGTAAT |
| Human-HDAC6 | TGACCAAAATATGATGAAT |
| Mouse-Sirt1 | CCATGAAGTATGACAAAGA |
| Human-Sirt1 | CCTCAAAGTAAGACCAGTA |
| Mouse-LSD1 | AAGGAAAGCUAGAAGAAAA |
| Human-LSD1 | AAGGAAAGCUAGAAGAAAA |
| Mouse-MOF | GATCCAGTCTCGAGTGAAC |
| Human-MOF | GATCCAGTCTCGAGTGAAC |
| Mouse-HDAC1 5′-UTR | GCAAGAUGGCGCAGACUCA |
| Human-HDAC1 3′-UTR | AAGACAAACUCCUGAAAUG |
| Mouse-LSD1 3′-UTR | AAGCAAGTGGTGTGAGATA |
| Human-LSD1 3′-UTR | GGGAGGAACUUGUCCAUUA |
| Mouse-MOF 3′-UTR | TCTGGGTTTCCTGGCCTCT |
| Human-MOF 3′-UTR | GGGAAGGGGAGGCCAAGAA |
| Mouse-Tip60 | GACGGAGUAUGACUGCAAA |
| Human-Tip60 | CUCCAGGCAAUGAGAUUUA |
Antibodies and immunoprecipitation.
Antibodies against HDAC1, HDAC2, HDAC3, HDAC6, Sox2, and CoREST were obtained from Bethyl Laboratories; anti-histone H4 peptide with acetylated lysine 16 (anti-H4K16ac; catalog no. 07-329), anti-histone H4 peptide with acetylated lysine 12 (anti-H4K12ac; catalog no. 04719), and histone H3 peptide with trimethylated lysine 4 (anti-H3K4me3) antibodies were from Millipore; anti-histone H3 peptide with acetylated lysine 56 (H3K56ac) antibodies (catalog no. 39281) were from Active Motif; anti-histone H3 peptide with dimethylated lysine 4 (H3K4me2; ab32356), histone H3 peptide with methylated lysine 4 (H3K4me1; ab8895), histone H3 (ab1791), histone H3 peptide with acetylated lysine 14 (H3K14ac; ab52946), histone H3 peptide with acetylated lysine 9 (H3K9ac; ab4441), histone H3 peptide with acetylated lysine 27 (H3K27ac; ab4279), Sall4, Nanog, and LSD1 (ab17721) antibodies were from Abcam; and Lin28 and Klf4 antibodies were from Proteintech Group. Goat anti-mouse IgG–horseradish peroxidase (HRP), goat anti-rabbit IgG–HRP, and mouse monoclonal anti-Oct4 antibodies were from Santa Cruz Biotechnologies. MS-275, valproic acid (VPA), all-trans-retinoic acid (RA), and trichostatin A (TSA) were from Sigma. CBB1003 and CBB1007 were synthesized as described previously (17).
For immunoaffinity purification, cells were lysed in ice-cold lysis buffer (50 mM Tris-HCl, pH 7.5, 120 mM NaCl, 0.5% Nonidet P-40, 10% glycerol, protease inhibitors) and centrifuged at 13,000 rpm for 15 min, and the supernatant was incubated with anti-LSD1 or anti-HDAC1 antibodies and rabbit IgG (normal rabbit serum [NRS]) overnight at 4°C. The immunocomplexes were captured by protein A-Sepharose. Isolated LSD1-protein A or HDAC1-protein A complexes were verified by Western blotting with LSD1 and HDAC1 antibodies. For purification of the 3× Flag-3× hemagglutinin (HA)-LSD1 complexes, human LSD1 cDNA was cloned into the 3× Flag-3× HA-pMSCV retroviral vector. The recombinant virus was packaged in 293 cells and used to transfect F9 cells (43). Stable 3× Flag-3× HA-LSD1-expressing F9 cells were selected under puromycin selection, and the expression of tagged LSD1 was confirmed by Western blotting. For the isolation of 3× Flag-3× HA-LSD1 complexes, 30 dishes (15 cm) of F9 cells were harvested and the tagged LSD1 complexes were first immunoprecipitated using anti-Flag M2 affinity gel (Sigma) and eluted with the 3× Flag peptide. The eluted complex was further purified by anti-HA affinity Sepharose (Roche). The proteins in the 3× Flag-3× HA-LSD1 complexes were separated on an SDS-polyacrylamide gel, excised, trypsinized, and identified using an ESI LTQ Orbitrap XL mass spectrometer (Thermo Scientific) coupled with an Eksigent nano-liquid chromatograph. The presence of CoREST and HDAC1 in the LSD1 complex was confirmed independently by immunoprecipitation and Western blotting.
Peptides and recombinant proteins.
H3K4me2 and H4K16ac were purchased from AnaSpec and Shanghai Science Peptide Biological Technology Co., Ltd., respectively. Human LSD1 and HDAC1 full-length cDNAs were obtained from Open Biosystems. Human CoREST cDNA was amplified by reverse transcription-PCR (RT-PCR) using mRNA isolated from HeLa cells. These cDNAs were fully sequenced and cloned into the pGEX-KG or pET28a vector and expressed as the glutathione S-transferase (GST)- or His-tagged fusion proteins in the Escherichia coli BL21 strain and affinity purified with glutathione or Ni-Sepharose (GE Healthcare, United Kingdom) resin. The GST tag of purified protein GST-HDAC1 or GST-LSD1 was removed by the use of PreScission protease at 4°C for 16 h in the digestion buffer (20 mM Tris-HCl, pH 7.4, 200 mM NaCl, 1 mM dithiothreitol [DTT], protease and phosphatase inhibitors). The GST tag and uncut GST-HDAC1/GST-LSD1 proteins were depleted by glutathione-Sepharose. For the reconstitution reaction, recombinant GST-CoREST, His-LSD1, and recombinant HDAC1 (rHDAC1) (GST was removed by the use of PreScission protease) (10 μg) were assembled into the LSD1-CoREST-HDAC1 complex and then pulled down by GST-Sepharose resins. Protein A-Sepharose was used as a negative-control resin.
Preparation of nucleosomes.
Nucleosomes were purified according to previously described procedures (3). Briefly, cells (1 × 10⁶) were washed twice with ice-cold hypotonic buffer (20 mM potassium-HEPES, pH 7.8, 5 mM potassium acetate, 0.5 mM MgCl2, 0.5 mM DTT), swelled, and disrupted with 25 strokes in a Dounce homogenizer using a tight-fitting pestle. Nuclei were pelleted at 4,000 rpm for 5 min and resuspended in buffer A (20 mM HEPES, pH 7.9, 1.5 mM magnesium acetate, 50 mM potassium acetate, 10% glycerol, 0.5 mM DTT, 150 mM NaCl, protease and phosphatase inhibitors). After incubation on ice for 15 min, the nuclei were centrifuged for 10 min at 10,000 rpm. The chromatin pellet was resuspended in 0.5 ml buffer B (0.32 M sucrose, 50 mM Tris-HCl, pH 7.5, 4 mM MgCl2, 1 mM CaCl2, 0.1 mM phenylmethylsulfonyl fluoride) and incubated with 30 units of micrococcal nuclease for 10 min at 37°C. The digested samples were centrifuged at 8,000 × g for 10 min, and the supernatant, which contained oligonucleosomes, was recovered.
In vitro deacetylation and demethylation assays.
For a typical deacetylation assay, 1 μg rHDAC1 or 1 μg immunoprecipitated endogenous HDAC1-protein A complexes (from two 10-cm dishes) was incubated with 0.4 μg H4K16ac peptide in the presence or absence of 50 μM CBB1007 or 2 μM MS-275 at 30°C for 1 h. The percentages of deacetylated products were analyzed by mass spectrometry, and the data were analyzed by GraphPad Prism (version 5) software. The reaction products were analyzed by mass spectrometry to separate the peptide substrate (H4K16ac) and the product (H4K16), as previously described (17). For a typical demethylation assay, 0.4 μg H3K4me2 substrate peptide was incubated individually with 1 μg recombinant LSD1 (rLSD1) or 1 μg immunoprecipitated LSD1-protein A complex in the presence or absence of 50 μM CBB1007 or 2 μM MS-275 at 30°C for 1 h. The reaction products were analyzed by mass spectrometry to separate the products (H3K4me1 and H3K4) from the substrate (H3K4me2), as previously described (17).
For reactions with nucleosomes, 2 μg nucleosomes was incubated with 1 μg rLSD1, rHDAC1, or the recombinant CoREST-LSD1-HDAC1 complex in the presence or absence of 50 μM CBB1007 or 2 μM MS-275 at 30°C for 45 min. The reaction products (demethylated or deacetylated histones) were analyzed by Western blotting.
RNA isolation and quantitative RT-PCR.
Total RNA was extracted with the TRIzol reagent (Invitrogen), and cDNA was generated using a cloned avian myeloblastosis virus first-strand cDNA synthesis kit (TaKaRa). The mRNA levels of the target genes were quantified by real-time PCR using SYBR green (TaKaRa) in an ABI Prism 7300 real-time PCR system (Applied Biosystems). The sequences of the oligonucleotide primers used for quantitative PCR (qPCR) are listed in Table 2.
TABLE 2.
Sequences of primers used for qPCR
| Primer name | Orientation | Sequence (5′–3′) |
|---|---|---|
| Mouse Sox2 | Forward | GTGAGCGCCCTGCAGTACAA |
| Mouse Sox2 | Reverse | GCGAGTAGGACATGCTGTAGGTG |
| Human Sox2 | Forward | GTGAGCGCCCTGCAGTACAA |
| Human Sox2 | Reverse | GCGAGTAGGACATGCTGTAGGTG |
| Mouse Oct4 | Forward | GATCACTCACATCGCCAATC |
| Mouse Oct4 | Reverse | GGTGTCCCTGTAGCCTCATA |
| Human Oct4 | Forward | TGAAGCTGGAGAAGGAGAAGCTG |
| Human Oct4 | Reverse | GCAGATGGTCGTTTGGCTGA |
| Mouse HDAC1 | Forward | TTGCTCGCTGCTGGACTTAC |
| Mouse HDAC1 | Reverse | TGGCTTCTCCTCCTTGGTTT |
| Human HDAC1 | Forward | GGGATCGGTTAGGTTGCTTC |
| Human HDAC1 | Reverse | TTGTCAGGGTCGTCTTCGTC |
| Mouse HDAC2 | Forward | GGACAGGCTTGGTTGTTTCA |
| Mouse HDAC2 | Reverse | ATTCCTACGACCTCCTTCAC |
| Human HDAC2 | Forward | AAGGCAAATACTATGCTGTC |
| Human HDAC2 | Reverse | TTGGGAATCTCACAATCAAG |
| Mouse HDAC3 | Forward | CCGAAATGTTGCCCGGTGTT |
| Mouse HDAC3 | Reverse | GGGTGCTTCTGGCCTGCTGT |
| Human HDAC3 | Forward | GCACCATGCCAAGAAGTTTG |
| Human HDAC3 | Reverse | CACCACCCAGCACGAGTAGA |
| Mouse HDAC6 | Forward | AACCGCACTGGGCTGGTCTA |
| Mouse HDAC6 | Reverse | TCAAAGTTGGCACCTTCACG |
| Human HDAC6 | Forward | CAGCGAAGAAGTAGGCAGAA |
| Human HDAC6 | Reverse | GCTGTCATCCCAGAGGCAAT |
| Mouse Sirt1 | Forward | GGGAACCTTTGCCTCATCTA |
| Mouse Sirt1 | Reverse | TACTGGAACCAACAGCCTTA |
| Human Sirt1 | Forward | TCCTCATTGTTATTGGGTCT |
| Human Sirt1 | Reverse | ATTACTCTTAGCTGCTTGGT |
| Mouse LSD1 | Forward | TCTTATCAACTTCGGCATCT |
| Mouse LSD1 | Reverse | TAGCAACTCGTCCACCTACT |
| Human LSD1 | Forward | AGCGTCATGGTCTTATCAA |
| Human LSD1 | Reverse | GAAATGTGGCAACTCGTC |
| Mouse HNF4A | Forward | GATGCTTCTCGGAGGGTCTG |
| Mouse HNF4A | Reverse | GCTGTGGAGTCTCGGGAGTG |
| Human HNF4A | Forward | AGCTGCAGATCGATGACAATGAG |
| Human HNF4A | Reverse | CATACTGGCGGTCGTTGATGTAG |
| Mouse FoxA2 | Forward | AGAACTCCATCCGCCACTCT |
| Mouse FoxA2 | Reverse | GGTCTTCTTGCCTCCGCTAC |
| Human FoxA2 | Forward | CCCCAACAAGATGCTGACGC |
| Human FoxA2 | Reverse | GCGAGTGGCGGATGGAGTT |
| Mouse Sox17 | Forward | GGGATACGCCAGTGACGACC |
| Mouse Sox17 | Reverse | CCACCTCGCCTTTCACCTTT |
| Human Sox17 | Forward | CTGCAGGCCAGAAGCAGTGTTA |
| Human Sox17 | Reverse | CCCAAACTGTTCAAGTGGCAGA |
| Mouse BMP2 | Forward | TGTGAGGATTAGCAGGTCTT |
| Mouse BMP2 | Reverse | GTCCACATACAAAGGGTGTC |
| Human BMP2 | Forward | ACAGCGGAAACGCCTTAA |
| Human BMP2 | Reverse | GGGAGCCACAATCCAGTC |
| Mouse EOMES | Forward | CCCAACAGAGCGAAGAGGTG |
| Mouse EOMES | Reverse | GAAGGTCGGGTCAGGGTAAT |
| Human EOMES | Forward | CCCAGACCCAACCTTTCC |
| Human EOMES | Reverse | GAGCCAATTTCCTCTTTCACTT |
| Human beta-Actin | Forward | TCCAGCCTTCCTTCTTGGGTATG |
| Human beta-Actin | Reverse | GAAGGTGGACAGTGAGGCCAGGAT |
| Mouse beta-Actin | Forward | TGCGTGACATCAAAGAGAAG |
| Mouse beta-Actin | Reverse | GATGCCACAGGATTCCATA |
| Human Hes1 | Forward | ATAGCTCGCGGCATTCCAAG |
| Human Hes1 | Reverse | GAAGCGGGTCACCTCGTTCA |
| Human DLL1 | Forward | ACAGCAAGCGTGACACCAAG |
| Human DLL1 | Reverse | TGAAGTTGAACAGCCCGAGT |
| Human Gadd45g | Forward | ACGCTGATCCAGGCTTTCTG |
| Human Gadd45g | Reverse | AACAGGCTGAGCTTCTCCAA |
| Mouse Hes1 | Forward | GACGGCCAATTTGCCTTTCTCATC |
| Mouse Hes1 | Reverse | TCAGTTCCGCCACGGTCTCCACA |
| Mouse DLL1 | Forward | CAGATAACCCTGACGGAGGCTACA |
| Mouse DLL1 | Reverse | GGAGGAGGCACAGTCATCCACATT |
| Mouse Gadd45g | Forward | CGTCTACGAGTCCGCCAAAGTCC |
| Mouse Gadd45g | Reverse | CAGAACGCCTGAATCAACGTGAAAT |
| Human Tip60 | Forward | GATGGAATACCGTCAGCACC |
| Human Tip60 | Reverse | TGAGGCAGAACTCGCACAGG |
| Mouse Tip60 | Forward | GTGAAACGGAAGGTGGAGGT |
| Mouse Tip60 | Reverse | CCAGTCATTCGTGGTGCTGA |
ChIP assays.
Chromatin immunoprecipitation (ChIP) assays were carried out according to previously described procedures (8, 9). Briefly, 1 × 10⁷ to 5 × 10⁷ cells were used for each sample. Proteins were cross-linked to DNA by addition of formaldehyde to a final concentration of 0.75%. After incubating with 125 mM glycine for 5 min, cells were harvested, resuspended in FA lysis buffer (50 mM HEPES-K+, pH 7.5, 140 mM NaCl, 1 mM EDTA pH 8.0, 1% Triton X-100, 0.1% sodium deoxycholate, 0.1% SDS, protease inhibitors), and sonicated to generate DNA fragments of 500 to 1,000 bp in average length. Soluble chromatin fragments were diluted (1:8) in radioimmunoprecipitation assay buffer (50 mM Tris-HCl, pH 8.0, 150 mM NaCl, 2 mM EDTA, 1% NP-40, 0.5% sodium deoxycholate, 0.1% SDS, protease inhibitors) and incubated with primary antibodies overnight. The immunocomplexes were incubated with protein A-Sepharose resins for 2 h, briefly centrifuged, and washed sequentially with the wash buffer (0.1% SDS, 1% Triton X-100, 2 mM EDTA, 150 mM NaCl, 20 mM Tris-HCl, pH 8.0) and the final wash buffer (0.1% SDS, 1% Triton X-100, 2 mM EDTA, pH 8.0, 500 mM NaCl, 20 mM Tris-HCl, pH 8.0). Immunocomplexes were eluted, and the cross-links were reversed in the elution buffer (1% SDS, 0.1 M NaHCO3) at 65°C. Purified DNA was quantified by real-time qPCR using beta-actin as a control. The sequences of the primers used for ChIP assays are listed in Table 3.
TABLE 3.
Sequences of primers used for ChIP assays
| Primer name | Orientation | Position relative to ATG | Sequence (5′–3′) |
|---|---|---|---|
| Human FoxA2 | Forward | +4000 | TCAGTGCCAAGTAGACAAAT |
| Human FoxA2 | Reverse | +4000 | TACGAAATTAACAGGATGTG |
| Human FoxA2 | Forward | +2000 | CCAGGTCTCGGGTCCGATTA |
| Human FoxA2 | Reverse | +2000 | CCCTCCCTCCTTCTTGAAAT |
| Human FoxA2 | Forward | +1500 | GGTGTACTCCCGGCCCATTA |
| Human FoxA2 | Reverse | +1500 | ATTTCTTCTCCCTTGCGTCT |
| Human FoxA2 | Forward | 0 (−1000) | CCGCCCACTTCCAACTACCG |
| Human FoxA2 | Reverse | 0 (−890) | GTCAGCCAAAGCACCGTCCC |
| Human FoxA2 | Forward | −2000 | TTTCAAGTCTGCGGTCATCC |
| Human FoxA2 | Reverse | −2000 | CAGCAACATCAGTGCCCTTT |
| Human FoxA2 | Forward | −4000 | CAACCTTCGGCACAACGATC |
| Human FoxA2 | Reverse | −4000 | GAAGCCACCATACAAACTGA |
| Human FoxA2 | Forward | −6000 | CAAGCCTCACATTTGAACCC |
| Human FoxA2 | Reverse | −6000 | CTGCGGAACCACTGACCACC |
| Mouse FoxA2 | Forward | +4000 | AACGCTGGCCGTCTGTATTG |
| Mouse FoxA2 | Reverse | +4000 | GCCTATGGACTCTGCCCTTC |
| Mouse FoxA2 | Forward | +2000 | AGGCTGAGTGGAGACTTTGG |
| Mouse FoxA2 | Reverse | +2000 | ATTTCCATTCCCTTCCCTAT |
| Mouse FoxA2 | Forward | +1500 | GGACCTCTTCCCTTTCTACC |
| Mouse FoxA2 | Reverse | +1500 | GTCTTCTTGCCTCCGCTACT |
| Mouse FoxA2 | Forward | 0 (−900) | CCCACTCCCAGCTACTTCCC |
| Mouse FoxA2 | Reverse | 0 (−650) | CAGCCACAACAAACGACCAG |
| Mouse FoxA2 | Forward | −2000 | GCTCCAATGCTTACTCCTCT |
| Mouse FoxA2 | Reverse | −2000 | TTCTCCCACAAATTCAAGGT |
| Mouse FoxA2 | Forward | −4000 | CCCCATAGACAAGTGTTTCG |
| Mouse FoxA2 | Reverse | −4000 | TTCTTCCAGCCTTCCCTAAT |
| Mouse FoxA2 | Forward | −6000 | ATGGCTTTGCCTATTTGTCC |
| Mouse FoxA2 | Reverse | −6000 | GGTTTCCTGGCTGATGCTTA |
| Human Sox2 | Forward | +4000 | TTCTCCTGCCTCAGCCTCCT |
| Human Sox2 | Reverse | +4000 | GCCTATAATTCCAGCACTTT |
| Human Sox2 | Forward | +2000 | TGCTTCCTCCCTACTGTCTG |
| Human Sox2 | Reverse | +2000 | CTCACCGCAACCTCCATCTC |
| Human Sox2 | Forward | +1000 | CATCACCCACAGCAAATGAC |
| Human Sox2 | Reverse | +1000 | TTCCTGCAAAGCTCCTACCG |
| Human Sox2 | Forward | 0 (−400) | CAGGAGTTGTCAAGGCAGAG |
| Human Sox2 | Reverse | 0 (−400) | GGAAAATCAGGCGAAGAATA |
| Human Sox2 | Forward | −1000 | TTTGGGTCTCCTAACTTCTA |
| Human Sox2 | Reverse | −1000 | GTCATTGTTCTCCCGCTCAT |
| Human Sox2 | Forward | −2000 | GCATTCCGTTGGCTATTCTC |
| Human Sox2 | Reverse | −2000 | GATGTGCTTTGTTTAGTGGG |
| Human Sox2 | Forward | −4000 | AATACTGGTGGTCGTCAAAC |
| Human Sox2 | Reverse | −4000 | TGAGAACTAGCCAAGCATCT |
| Mouse Sox2 | Forward | −4000 | GGGCATAGACAAACAGAACC |
| Mouse Sox2 | Reverse | −4000 | ACCACAACCATAGCAGGAAT |
| Mouse Sox2 | Forward | −2000 | TCCAAGTCGCTGCCTTTATT |
| Mouse Sox2 | Reverse | −2000 | TTCCGTTTCCTCCACTCTGT |
| Mouse Sox2 | Forward | −1000 | GTGCTGGCGACAAGGTTGGA |
| Mouse Sox2 | Reverse | −1000 | ATGGGTGGTTCAGGGCGACT |
| Mouse Sox2 | Forward | 0 (−300) | AAGACTAGGGCTGGGAGAAA |
| Mouse Sox2 | Reverse | 0 (−300) | ATCTGGCGGAGAATAGTTGG |
| Mouse Sox2 | Forward | +1000 | CTGGACTGCGAACTGGAGAA |
| Mouse Sox2 | Reverse | +1000 | ATTTGGATGGGATTGGTGGT |
| Mouse Sox2 | Forward | +2000 | GGACATTTGGCTACTTAGAG |
| Mouse Sox2 | Reverse | +2000 | GAAGATATTGAAACAGGGAC |
| Mouse Sox2 | Forward | +4000 | TCCCAACGAGAAGAGTATGA |
| Mouse Sox2 | Reverse | +4000 | AGAGCAGTGACGGGAACAGA |
| Human Oct4 | Forward | −1000 | TGTGCTTATGGCTGTTGATG |
| Human Oct4 | Reverse | −1000 | CCACTGTGCCCTGTTAGTTT |
| Human Oct4 | Forward | −2000 | GCATTCCGTTGGCTATTCTC |
| Human Oct4 | Reverse | −2000 | GATGTGCTTTGTTTAGTGGG |
| Human Oct4 | Forward | −4000 | GGATGTACGGCAGCTTGATA |
| Human Oct4 | Reverse | −4000 | GCTGGACACTGGAGGATAGA |
| Human Oct4 | Forward | 0 (−100) | GCCACCACCATTAGGCAAAC |
| Human Oct4 | Reverse | 0 (−100) | GCGAAGGGACTACTCAACCC |
| Human Oct4 | Forward | +1000 | AGAAAGCGAACCAGTATCGA |
| Human Oct4 | Reverse | +1000 | GCGCCGGTTACAGAACCACA |
| Human Oct4 | Forward | +2000 | TGCTTCCTCCCTACTGTCTG |
| Human Oct4 | Reverse | +2000 | CTCACCGCAACCTCCATCTC |
| Human Oct4 | Forward | +4000 | TTCTCCTGCCTCAGCCTCCT |
| Human Oct4 | Reverse | +4000 | GCCTATAATTCCAGCACTTT |
| Mouse Oct4 | Forward | −1000 | AGGCACTCTGAGGGCTATTC |
| Mouse Oct4 | Reverse | −1000 | GACACTAAGGAGACGGGATT |
| Mouse Oct4 | Forward | −2000 | TCCAAGTCGCTGCCTTTATT |
| Mouse Oct4 | Reverse | −2000 | TTCCGTTTCCTCCACTCTGT |
| Mouse Oct4 | Forward | −4000 | GCAGAAGGTCAGGTCCACTC |
| Mouse Oct4 | Reverse | −4000 | CATTCAAGATAACCAGCCAC |
| Mouse Oct4 | Forward | 0 (−100) | GGTCCCGTCCTAAGGGTTGT |
| Mouse Oct4 | Reverse | 0 (−100) | TGGGTGGGTGGAGGAGCAGA |
| Mouse Oct4 | Forward | +1000 | TCCCAACGAGAAGAGTATGA |
| Mouse Oct4 | Reverse | +1000 | CCAGAGCAGTGACGGGAACA |
| Mouse Oct4 | Forward | +2000 | GGACATTTGGCTACTTAGAG |
| Mouse Oct4 | Reverse | +2000 | GAAGATATTGAAACAGGGAC |
| Mouse Oct4 | Forward | +4000 | TCCCAACGAGAAGAGTATGA |
| Mouse Oct4 | Reverse | +4000 | AGAGCAGTGACGGGAACAGA |
Cell cycle analysis, viability, synchronization, and differentiation.
The fluorescence-activated cell sorting (FACS) and 3-(4,5-dimethyl-2-thiazolyl)-2,5-diphenyl-2H-tetrazolium bromide (MTT) assays were conducted as described previously (44). To synchronize PA-1 and F9 cells at the G1/S phase transition, cells were treated with 2.5 mM thymidine for 12 h, released into fresh medium for 6 h, and blocked again with 2.5 mM thymidine for an additional 12 h. The cell cycle arrest was analyzed by FACS. For differentiation, F9 and PA-1 cells were seeded in 6-well plates at a density of 1 × 10⁴ cells per well and supplemented with 5 μM RA for 3 days. Cells were then recultured in fresh medium without RA for another 2 days, and the cell cycle was analyzed on a BD FACSCalibur cell sorter using the CellQuest program (Becton, Dickinson, Mountain View, CA). The percentages of cells in G1, S, and G2/M phases were determined by the use of ModFit LT software.
Reexpression and siRNA rescues.
Wild-type pCMV10-3Flag-LSD1, pCMV10-3Flag-HDAC1, and pCMV10-3Flag-MOF plasmids were constructed by fusing the full-length cDNAs of human LSD1, HDAC1, or MOF with the Flag tag in the pCMV10-3Flag vector (Clontech). F9 and PA-1 cells were transfected with LSD1, HDAC1, and MOF siRNAs for the untranslated regions (UTRs) first by use of the DharmaFECT transfection reagent to silence the endogenous LSD1, HDAC1, and MOF proteins. Twenty-four hours later, these cells were transfected with 5 μg of each recombinant plasmid by use of Lipofectamine LTX and PLUS reagent (Invitrogen) for 24 to 36 h, and cells were harvested and analyzed. The green fluorescent protein (GFP) expression control vector was used in parallel to estimate the transfection efficiency in each experiment, which was about 50 to 60% of total cells. The efficacy of siRNAs and the expression of exogenous proteins were further confirmed by Western blotting or qPCR.
Immunoblotting and quantification.
To quantify and compare the protein band densities in the Western blots shown in the figures, a titration by serial dilution of the siRNA protein samples for mES cell lysates was used as a reference. The concentration of titration samples was measured by use of a NanoDrop 2000 apparatus, and the protein concentration of all titration samples was adjusted to 1 μg/μl. The protein samples were loaded onto an SDS-polyacrylamide gel at levels ranging from 1 μg to 13 μg at 2-μg intervals and immune blotted with each antibody, including anti-LSD1, anti-HDAC1, and anti-histone H3 antibodies, with three independent loadings. The Western blots were developed with exposure times ranging from 30 s to 1 min. The exposure density of each band was scanned by Adobe Photoshop Elements (version 4.0) software using a CanonScan 8600F scanner (Canon, CA) and was subsequently quantified by use of the area density tool of Gel-Pro Analyzer (version 4.0) software (Media Cybernetics, Inc.) and plotted. The regression analysis of each signal was performed by use of the Microsoft Excel program's Analysis Tool Pak regression option. The titration data showed that the association between the amount of proteins loaded and protein band intensities after Western blotting was statistically significant and all of the values used for quantification fell within the linear range. Using the titration plots as references, all of the samples for the Western blots shown in the figures were loaded with 5 μg to 7 μg total proteins, and the exposure time was from 30 s to 3 min. The amount of the protein band in the Western blot shown in the figures was quantified by scanning, as described for the reference titration. The band density of each protein in various samples was internally corrected by the use of loading controls, such as histone H3, which is assumed to be constant in each sample. The quantity of protein band densities between two protein samples was externally corrected by use of the reference plots. The internally and externally corrected protein band intensities were compared between duplicate or triplicate samples tested in parallel or independently and plotted. The statistical differences between the experimental and control groups were analyzed by one-way analysis of variance (ANOVA). All Western blotting results are representative of those from at least three independent experiments.
RESULTS
LSD1 forms a complex with HDAC1, and loss of HDAC1 phenocopies the selective growth-inhibitory effects of LSD1 inactivation in ES/EC cells.
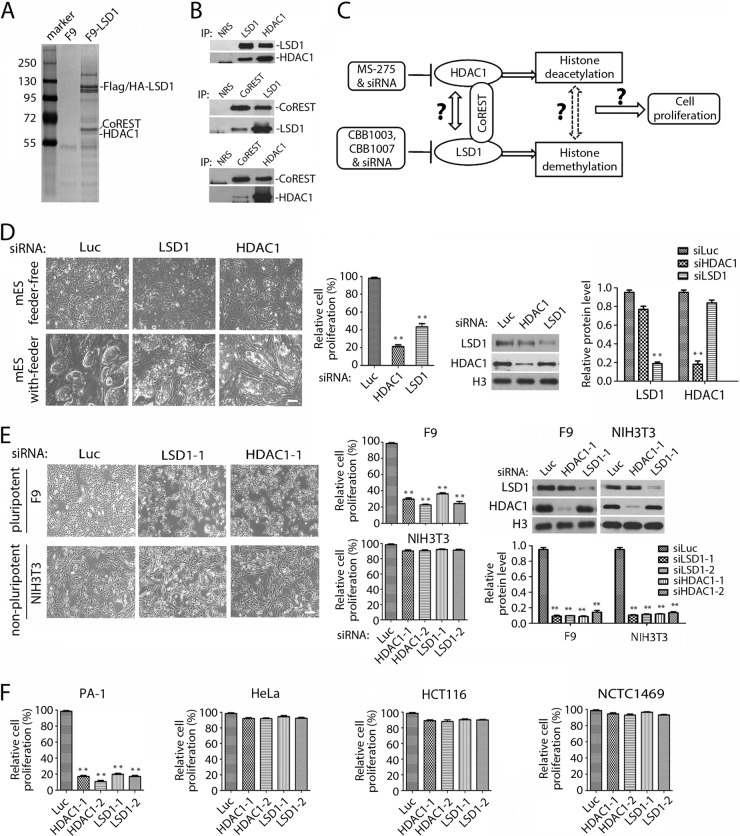
Previously, we showed that LSD1 inhibitors specifically block the growth of ES and EC cells and induce their differentiation but not that of nonpluripotent cells, such as HeLa, 293, or NIH 3T3 cells (17). To investigate the mechanism by which LSD1 regulates the pluripotency of ES/EC cells, we isolated the proteins that interact with LSD1 in ES/EC cells, as LSD1 was reported to be a component of several repressor complexes (3–6, 45). For this purpose, we epitope tagged human LSD1 with triple Flag and HA tags and stably expressed it in pluripotent mouse teratocarcinoma F9 cells. The LSD1 complexes were isolated by immunoprecipitation of anti-Flag and HA antibodies, and the associated proteins were identified by mass spectrometry analyses. Our analysis revealed that LSD1 primarily associated with CoREST and HDAC1 in F9 cells (Fig. 1A). Independent immunocoprecipitation followed by Western blotting of LSD1 complexes confirmed that LSD1 forms a protein complex with HDAC1 and CoREST in F9 cells (Fig. 1B).
FIG 1.
The effects of inactivation of HDAC1 resemble the selective growth-inhibitory effects of LSD1 deficiency in ES/EC cells. (A) LSD1 formed a protein complex with CoREST and HDAC1. The 3× Flag/HA-tagged LSD1 protein complex was isolated by immunoprecipitation from F9 cells that stably expressed the tagged LSD1 using F9 cells as a control. LSD1, HDAC1, and CoREST were identified by mass spectrometry. Marker, molecular weight markers (in thousands). (B) The interactions among LSD1, HDAC1, and CoREST were confirmed by immunoprecipitation (IP), followed by Western blotting, as indicated. NRS, normal rabbit serum as a control. (C) Schematic of the experimental design for the functional relationship between LSD1, CoREST, and HDAC1. (D) Ablation of HDAC1 or LSD1 inhibits the proliferation of pluripotent mES cells. The mES cells were transfected with luciferase, HDAC1, or LSD1 siRNA (siLuc, siHDAC1, and siLSD1, respectively), and the growth of mES cells was examined under a microscope and quantified by the MTT assay. The efficacy of the siRNAs was determined by Western blotting and quantified by the use of Gel-Pro Analyzer (version 4.0) software. (E) Inactivation of LSD1 or HDAC1 specifically inhibits the proliferation of pluripotent F9 cells but not that of nonpluripotent NIH 3T3 cells. Cells were transfected with two sets of independent LSD1 and HDAC1 siRNAs for 48 h. Only one set of cell images is shown. The rest were quantified by MTT assay, as described for panel D. (F) Loss of LSD1 or HDAC1 by siRNA-mediated ablation also caused growth inhibition of pluripotent human PA-1 teratoma cells but not that of nonpluripotent HeLa, HCT116, or mouse NCTC1469 cells. All experiments were performed in duplicate with consistent results each time and repeated at least three times. Error bars represent SEMs for duplicates of the data. The statistical differences between experimental and control groups were analyzed by one-way ANOVA. **, P < 0.01.
To determine the significance of the association between LSD1 and HDAC1 (Fig. 1C), we ablated the expression of LSD1 or HDAC1 by the use of specific siRNAs in pluripotent mouse ES (mES) and F9 cells and nonpluripotent mouse NIH 3T3 cells (Fig. 1D and E). Consistent with our previous findings (17), loss of LSD1 led to profound and selective growth inhibition only of the pluripotent mES and F9 cells (Fig. 1D and E), which expressed pluripotent stem cell proteins Sox2, Oct4, and Lin28 (Table 4), while LSD1 ablation had no significant effects on that of nonpluripotent NIH 3T3 cells (Fig. 1E). Notably, ablation of HDAC1 using specific siRNAs phenocopied the effects of LSD1 inactivation on the selective growth inhibition of pluripotent mES and F9 cells but not that of nonpluripotent NIH 3T3 cells (Fig. 1D and E). These effects were specific to the loss of LSD1 or HDAC1, as inactivation using independent siRNAs against LSD1 or HDAC1 produced the same selective effects (Fig. 1E). Further examination of the effects of LSD1 and HDAC1 ablation by their specific siRNAs in pluripotent PA-1 human ovarian teratocarcinoma cells and nonpluripotent NCTC1469 normal mouse liver, HeLa, and HCT116 human colorectal carcinoma cells confirmed that inactivation of LSD1 or HDAC1 impaired the growth only of pluripotent PA-1 cells and not that of nonpluripotent cells (Fig. 1F).
TABLE 4.
Expression of pluripotent stem cell proteins Oct4, Sox2, Klf4, Lin28, Nanog, and Sall4 in mES, EC, and nonpluripotent cells
| Cell line | Protein expressiona |
|||||
|---|---|---|---|---|---|---|
| Oct4 | Sox2 | Klf4 | Lin28 | Nanog | Sall4 | |
| mES | √ | √ | √ | √ | √ | √ |
| F9 | √ | √ | √ | √ | √ | √ |
| PA-1 | √ | √ | √ | √ | × | √ |
| NIH 3T3 | × | × | √ | × | × | × |
| NCTC1469 | × | × | √ | × | × | × |
| HeLa | × | × | √ | × | × | × |
| HCT116 | × | × | √ | × | × | × |
√, expression of proteins, as confirmed by Western blotting; ×, no detectable expression of proteins.
Inhibition of HDAC1 or LSD1 increases both H4K16 acetylation and H3K4 methylation in cells sensitive to LSD1 inhibitors.
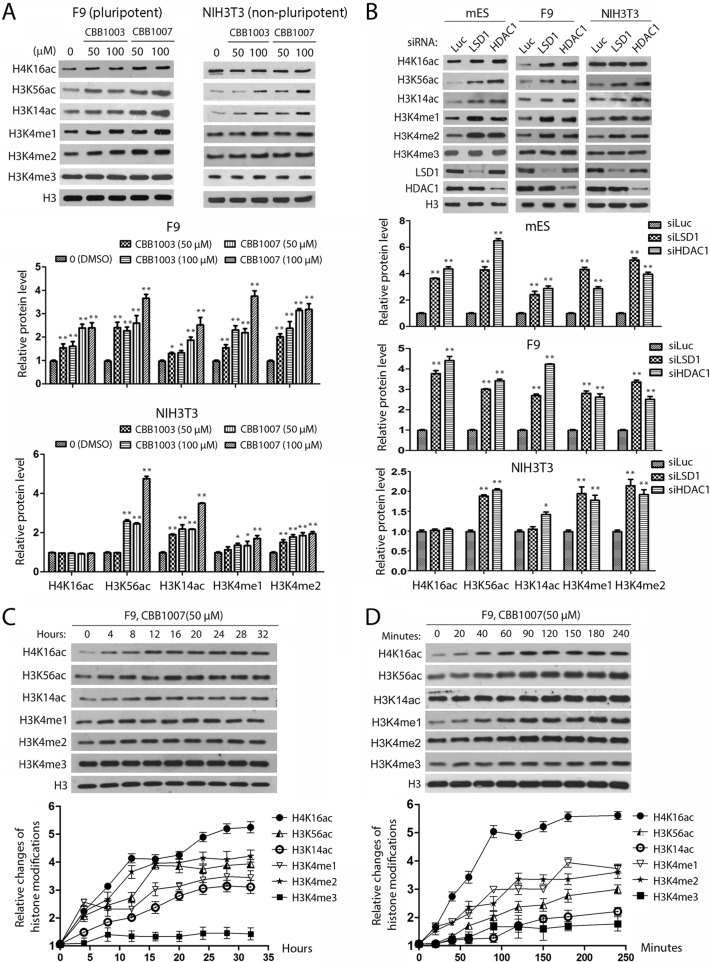
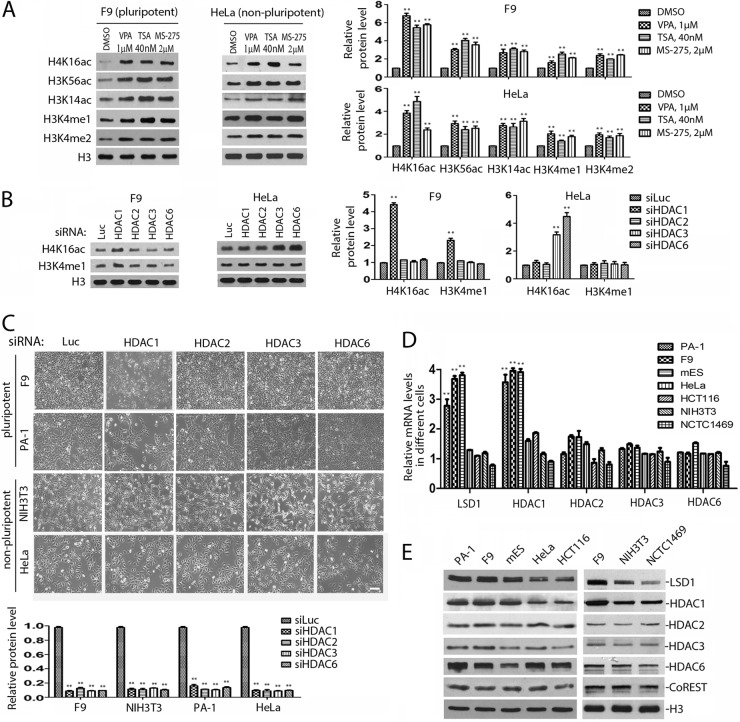
The similarity between the inhibitory effects of LSD1 and HDAC1 inactivation on the proliferation of pluripotent ES/EC cells and the interaction between LSD1 and HDAC1 in these cells raised the possibility that LSD1-regulated H3K4 methylation cross talks with the HDAC1-mediated histone acetylation in pluripotent ES/EC cells. To identify the potential link between these two pathways in pluripotent ES/EC cells, we examined and compared the changes of epigenetic modifications of histones H3 and H4 in pluripotent mES and F9 cells (Fig. 2A and B). Inactivation of LSD1 by LSD1 inhibitors or specific siRNAs not only induced the accumulation of mono- and dimethylated H3K4 but also increased the levels of acetylated H4K16, H3K56, and H3K14 in these cells but not the level of trimethylated H3K4 (Fig. 2A and B). Notably, a loss of HDAC1 caused the same patterns of accumulation of mono- and dimethylated H3K4 and acetylated H4K16, H3K56, and H3K14 in these pluripotent cells (Fig. 2B). These observations are consistent with the notion that LSD1 and HDAC1 may coordinate to regulate H3K4 methylation and histone acetylation in pluripotent cells.
FIG 2.
Inactivation of LSD1 or HDAC1 causes similar changes of histone methylation and acetylation in ES/EC cells. (A) F9 and NIH 3T3 cells were treated with the LSD1 inhibitors CBB1003 and CBB1007 for 24 h, and the acetylation and methylation of histones H3 and H4 were monitored by Western blotting and quantified by the use of Gel-Pro Analyzer (version 4.0) software using histone H3 as a loading control. (B) mES, F9, and NIH 3T3 cells were transfected with luciferase, LSD1, or HDAC1 siRNAs, and methylated and acetylated histones were analyzed and quantified as described for panel A. (C) Time course analyses of the effects of 50 μM LSD1 inhibitor CBB1007 on histone modifications in F9 cells. (D) The same as described for panel C, but with a shorter time course. The mean density of each band was quantified by the use of Gel-Pro Analyzer (version 4.0) software, and error bars represent SEMs for duplicate samples. All of the experiments were repeated more than three times, with similar results each time. The statistical differences were analyzed by one-way ANOVA. *, P < 0.05; **, P < 0.01.
As inactivation of both LSD1 and HDAC1 only selectively induced growth inhibition of pluripotent ES/EC cells and not that of nonpluripotent cells, we also compared the changes of histone methylation and acetylation between pluripotent and nonpluripotent cells. Strikingly, we repeatedly observed that while inactivation of LSD1 or HDAC1 selectively caused the increased levels of acetylated H4K16 in pluripotent mES and F9 cells, such an increase in acetylated H4K16 did not happen in nonpluripotent NIH 3T3 cells (Fig. 2A and B). It is possible that the loss of LSD1 caused secondary changes in histone modification when the cells were treated with LSD1 inhibitors or siRNAs for an extended time. We therefore monitored the time course of changes in histone modifications after treatment of F9 cells with the LSD1 inhibitor CBB1007 (Fig. 2C and D). We repeatedly found that the increases of acetylation at H4K16 and H3K56 and mono- and dimethylation at H3K4 occurred within 20 min after addition of CBB1007 in F9 cells, whereas the accumulation of H3K14 acetylation appeared to occur relatively late, at between 4 and 8 h. These analyses suggest that the changes in histone modifications in H3K56ac, H4K16ac, and H3K4me1/me2 may be the primary effects of LSD1 inactivation.
Acetylated H4K16 is a direct substrate of HDAC1.
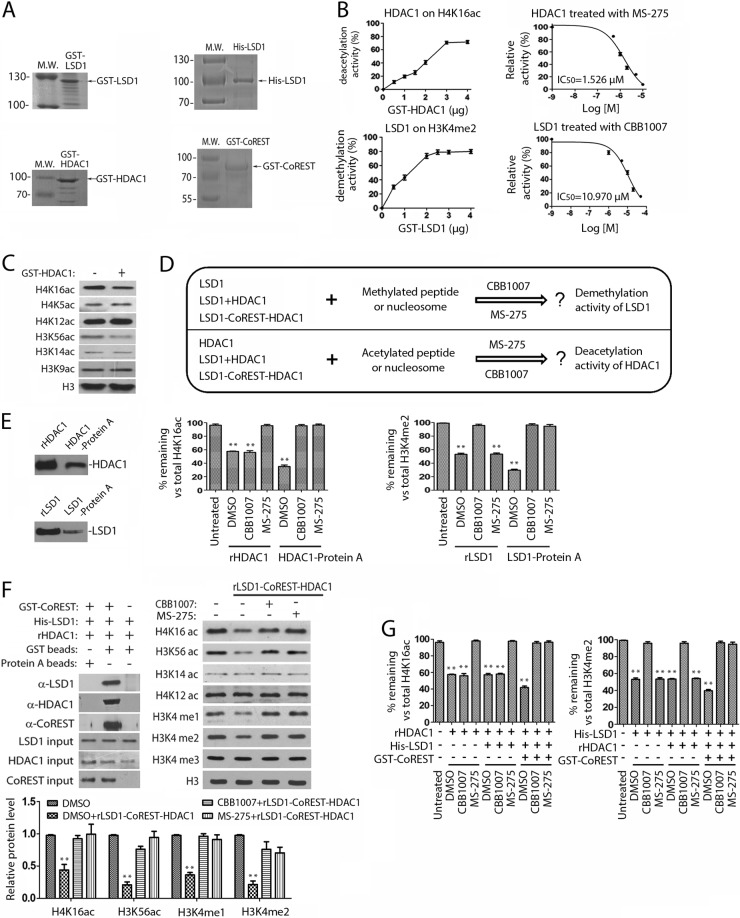
As the effects of LSD1 and HDAC1 inactivation mirrored each other and affected both histone methylation and acetylation, it prompted us to further biochemically characterize these effects in vitro using defined substrates and proteins. To determine whether acetylated H3K56, H4K16, and H3K14 are direct substrates of HDAC1, recombinant HDAC1 protein (Fig. 3A) was used to analyze its deacetylase activity against these acetylated bulk histones from F9 cells. We found that GST-HDAC1 could remove the acetyl groups from the acetylated H3K56 and H4K16 but not the acetyl group of acetylated H3K14 (Fig. 3C). To further confirm that the acetylated H4K16 is a substrate of HDAC1, we also used a synthetic H4K16ac that contains the acetylated H4K16 as a substrate, and our studies showed that HDAC1 could deacetylate this peptide in a reaction that was inhibited by MS-275, an inhibitor of class I HDACs, which include HDAC1 (Fig. 3B). These observations, as well as the findings from the in vivo studies (Fig. 2C and D), indicated that acetylated H3K56 and H4K16 are indeed the specific and direct substrates of HDAC1, while acetylated H3K14 is not.
FIG 3.
Regulation of LSD1 and HDAC1 by mutual activities in the LSD1-CoREST-HDAC1 complex. (A) Purified recombinant GST-LSD1, 6-histidine-tagged LSD1 (His-LSD1), GST-HDAC1, and GST-CoREST proteins. Lanes M.W., molecular weight markers (in thousands). (B) Analysis of the activities of recombinant HDAC1 and LSD1 proteins on peptide substrates. (Left) Concentration-dependent GST-HDAC1 (top) and GST-LSD1 (bottom) activities using H4K16ac and H3K4me2 peptides as the substrates. The products were analyzed by mass spectrometry and quantified by GraphPad Prism (version 5) software. (Right) Determination of the 50% inhibitory concentration (IC50) of MS-275 toward HDAC1 and that of CBB1007 toward LSD1. (C) GST-HDAC1 deacetylates H4K16ac and H3K56ac in acid-extracted histones. (D) Schematic design to test whether inhibition of LSD1 blocks the activity of HDAC1 and vice versa. (E) The activities of HDAC1 and LSD1 in the isolated endogenous protein complexes were sensitive to both MS-275 and CBB1007. (Left) Protein levels of recombinant HDAC1 and LSD1 (rHADC1 or rLSD1) and immunoaffinity-purified HDAC1 and LSD1 (HDAC1-protein A or LSD1-protein A complexes) from F9 cells. The GST tag of the GST-HDAC1 and GST-LSD1 proteins was removed prior to the reactions. (Middle) The endogenous HDAC1 in immunoprecipitated protein complexes was sensitive to both CBB1007 and MS-275, whereas rHDAC1 was sensitive only to MS-275. (Right) The activity of LSD1 in the isolated immunoprecipitated LSD1-protein A was inhibited by MS-275 and CBB1007, while the activity of rLSD1 was inhibited only by CBB1007. (F) Both LSD1 and HDAC1 in the reconstituted recombinant LSD1-CoREST-HDAC1 complex were partially sensitive to LSD1 or HDAC1 inhibitors. (Top left) The indicated recombinant LSD1, HDAC1, and GST-CoREST proteins were mixed, and the protein complexes were isolated by GST beads. The components in the isolated reconstituted complexes were examined by Western blotting. Protein A beads were used as a negative control. (Top right) The activity of the reconstituted LSD1-CoREST-HDAC1 complexes was measured using oligonucleosomes as the substrate either in the presence or in the absence of 50 μM CBB1007 or 2 μM MS-275. (Bottom) The protein levels in the top right panel were quantified using Gel-Pro Analyzer (version 4.0) software. The first lane in the top right panel contained oligonucleosomes only. (G) In the absence of CoREST, LSD1 was not sensitive to MS-275, while HDAC1 was not inhibited by CBB1007 using the H3K4me2 or H4K16ac peptide as the substrate. All experiments were conducted at least three times, and only the results of a representative experiment are shown. Error bars denote SEMs for duplicate samples. The statistical differences were analyzed by one-way ANOVA. **, P < 0.01.
Regulation of LSD1 and HDAC1 by mutual activities in the LSD1-CoREST-HDAC1 complex.
To investigate the relationship between LSD1 and HDAC1, we compared the activities of recombinant LSD1 and HDAC1 proteins with those of LSD1-HDAC1 complexes isolated from F9 cells. We also examined whether the recombinant LSD1 or HDAC1 proteins and isolated LSD1 or HDAC1 protein complexes are sensitive to LSD1 or HDAC1 inhibitors in vitro (Fig. 3A and D). We also immunoaffinity purified the LSD1-protein A and HDAC1-protein A complexes, which also contain CoREST, from F9 cells using anti-LSD1 and HDAC1 antibodies (Fig. 1A and B and 3E) to compare their activities with those of recombinant proteins. The substrate H4K16ac peptide was incubated with GST-HDAC1 and HDAC1-protein A. The substrate (acetylated H4K16) and product (nonacetylated H4K16) peptides were separated, resolved, and quantified by mass spectrometry (Fig. 3E, middle). Both GST-HDAC1 and HDAC1-protein A could remove the acetyl group from the H4K16ac peptide, and both were sensitive to MS-275, although the endogenous HDAC1 appeared to be more active, even though it consisted of about 2.5 times less protein (Fig. 3E, left and middle). Because H4K16ac in F9 cells is sensitive to LSD1 inhibitors (Fig. 2), we also examined the potential effects of LSD1 inhibitors in our HDAC1 assay in vitro. Strikingly, we found that the LSD1 inhibitor CBB1007 is sufficient to inhibit the deacetylase activity of immunoaffinity-purified HDAC1 (HDAC1-protein A) but not that of GST-HDAC1 (Fig. 3E, middle) in the deacetylation reaction.
As H3K4me1 and H3K4me2 were also sensitive to the inactivation of HDAC1 in pluripotent ES and EC cells (Fig. 2A and B), we also examined the effects of MS-275 on the in vitro activities of recombinant and endogenous LSD1 complexes isolated from F9 cells using a dimethylated H3K4 peptide as a substrate (Fig. 3E). While both GST-LSD1 and the immunoaffinity-isolated LSD1 complexes from F9 cells (LSD1-protein A) could remove the methyl groups from the dimethylated H3K4 peptide and convert it into mono- and nonmethylated H3K4 peptides in a reaction that was sensitive to CBB1007 (Fig. 3B and E, right), addition of HDAC inhibitor MS-275 in the demethylation reaction blocked the demethylation activity of immunoaffinity-purified LSD1 but not that of GST-LSD1 (Fig. 3E, right). Similar to the endogenous HDAC1, the immunoaffinity-purified LSD1 protein from F9 cells seemed to be more active, as 4 times less LSD1 protein was present in the LSD1-protein A complex (Fig. 3E). Our results suggest that, different from the recombinant LSD1 or HDAC1 proteins, the activities of LSD1 and HDAC1 are mutually dependent on each other in the protein complexes isolated from F9 cells, which is consistent with our observation that loss of LSD1 or HDAC1 selectively inhibited cell growth and increased H3K4me1/me2, H4K16ac, and H3K56ac levels in ES/EC cells (Fig. 1 and 2).
Because LSD1 and HDAC1 were both associated with CoREST in F9 cells (Fig. 1A and B), we wondered whether the mutual requirements of LSD1 and HDAC1 activities were due to their binding to the same CoREST complex. To validate this point, we used the recombinant proteins to reconstitute the LSD1-CoREST-HDAC1 protein complex (Fig. 3F, top left). The activities of the reconstituted complexes were then assayed using oligonucleosomal histones as the substrate which were extracted from F9 cells after micrococcal nuclease digestion, as recombinant LSD1 alone did not work on such a substrate (3, 4). Our studies showed that the reconstituted LSD1-CoREST-HDAC1 complex could be assembled in vitro and the complex contained both demethylase and deacetylase activities toward the nucleosomal substrates (Fig. 3F, top right). Treatment of this complex with the LSD1 inhibitor CBB1007 not only inhibited the activity of LSD1 demethylase but also caused the partial inhibition of the HDAC1 deacetylase activity. Conversely, the HDAC inhibitor MS-275 could also partially inhibit the LSD1 demethylase activity by blocking the HDAC1 activity in the reconstituted LSD1-CoREST-HDAC1 complex (Fig. 3F, bottom). The formation of the LSD1 and HDAC1 complexes and the mutual sensitivities toward either LSD1 or HDAC1 inhibitors are dependent on CoREST. In the absence of CoREST, not only did the LSD1-HDAC1 complex not form but also the activity of LSD1 was independent of HDAC1 and vice versa for HDAC1 (Fig. 3F and G). Our studies thus unravel the allosteric effects of LSD1 and HDAC1 through their trimeric complex formation with CoREST to regulate their demethylase and deacetylase activities.
Regulation of LSD1 and HDAC1 activities by substrate modification.
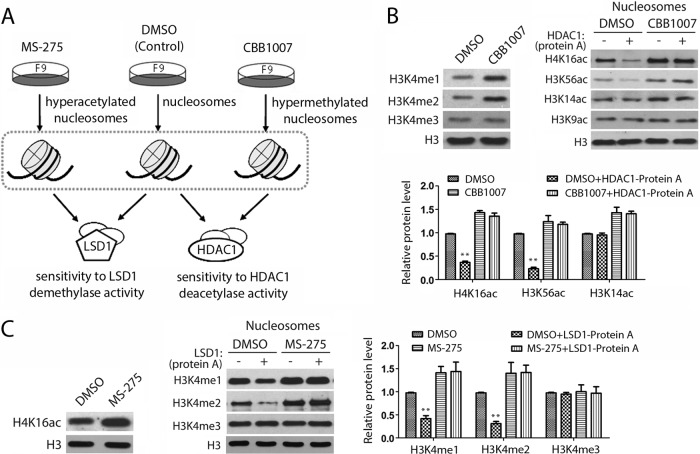
Because the loss of LSD1 or HDAC1 in ES/EC cells induces hypermethylated H3K4 or hyperacetylated H4K16 or H3K56, respectively (Fig. 2), we also wondered whether the hypermethylated or hyperacetylated nucleosomes serve as optimal substrates for HDAC1 or LSD1 (Fig. 4A). To isolate hypermethylated or hyperacetylated nucleosomes, F9 cells were treated with either the LSD1 inhibitor CBB1007 or the HDAC inhibitor MS-275, and oligonucleosomes were subsequently isolated (Fig. 4A and B, top, and C, left). The hypermethylated nucleosomes from CBB1007-treated cells were incubated with immunoaffinity-purified HDAC1 complex (HDAC1-protein A), and the efficiency of deacetylation was compared with that of dimethyl sulfoxide (DMSO)-treated nucleosomes (Fig. 4B). We found that the HDAC1 complex could no longer efficiently deacetylate the H3K4 hypermethylated nucleosomes isolated from LSD1 inhibitor-treated F9 cells (Fig. 4B, bottom). Conversely, when hyperacetylated nucleosomes isolated from MS-275-treated F9 cells were used as the substrates (Fig. 4C, left), the immunoaffinity-purified LSD1 complex (LSD1-protein A) could not utilize this substrate (Fig. 4C, right), consistent with the findings of previous TSA experiments (3). Thus, our studies suggest not only that LSD1 and HDAC1 can mutually regulate their activities through an allosteric effect in the CoREST complex but also that their activities are controlled by the preference for the hypomethylated or hypoacetylated nucleosomal substrates, respectively.
FIG 4.
Regulation of LSD1 and HDAC1 activities by substrate modification. (A) Schematic outline for the experimental design. The hyperacetylated or hypermethylated nucleosomes were isolated from cells treated with either MS-275 or LSD1 inhibitors. The hyperacetylated or hypermethylated nucleosomes, as well as the control nucleosomes (DMSO treated), were subsequently used as the substrates for immunoaffinity-purified HDAC1 or LSD1 complexes to determine the substrate preferences. (B) HDAC1 was unable to use hypermethylated H3K4 oligonucleosomes as a substrate. (Top) Oligonucleosomes from CBB1007-treated F9 cells were hypermethylated on H3K4, and HDAC1 in the immunoprecipitated HDAC1-protein A complexes could not efficiently use hypermethylated histones as a substrate; (bottom) the protein bands were quantified by the use of Gel-Pro Analyzer (version 4.0) software. (C) LSD1 preferred hypoacetylated oligonucleosomes as the substrate. Oligonucleosomes from MS-275-treated F9 cells were hyperacetylated on H4K16 (left), and they were resistant to the demethylase activity of LSD1 in the immunoprecipitated LSD1-protein A complex (right). Quantification was done as described in the legend to Fig. 1, and error bars denote SEMs for duplicate samples. Results are representative of those from three independent experiments. The statistical differences were analyzed by one-way ANOVA. **, P < 0.01.
Multiple HDACs regulate the acetylation of histone H4K16 in nonpluripotent cells.
Our results indicated that the acetylated H4K16 is a substrate of HDAC1 (Fig. 2 and 3). However, the loss of HDAC1 could induce the accumulation of acetylated H4K16 only in pluripotent ES/EC cells and not in nonpluripotent NIH 3T3 or HeLa cells (Fig. 2A and B and 5B). HDAC1 belongs to the HDAC family, which has 18 members in the human genome. Because HDAC1 and HDAC2 were reported to play a redundant role in the proliferation of HeLa cells (46, 47), we wondered whether the acetylation of H4K16 is regulated by multiple HDACs in nonpluripotent cells. To test this, we treated HeLa cells with various HDAC inhibitors, including valproic acid (VPA), trichostatin A (TSA), and MS-275 (Fig. 5A). It is known that MS-275 inhibits the activities of HDACs 1, 2, and 3 and VPA specifically targets HDACs 1, 2, 3, and 8, while TSA has a broader substrate specificity against class I and class II HDACs, including HDAC6 and HDAC10 (33). Indeed, we found that these pan-HDAC inhibitors induced the accumulation of acetylated H4K16 in HeLa cells (Fig. 5A), suggesting that the deacetylation of H4K16 in nonpluripotent cells may be regulated by multiple HDACs, in addition to HDAC1.
FIG 5.
Regulation of H4K16 acetylation by elevated HDAC1 and LSD1 levels in ES/EC cells. (A) The acetylation of H4K16 is sensitive to pan-HDAC inhibitors in HeLa cells. F9 and HeLa cells were treated with the HDAC inhibitor VPA (1 μM) or MS-275 (2 μM) for 24 h or TSA (40 nM) for 16 h. Methylated and acetylated histones H3 and H4 were blotted by specific antibodies, as indicated, and quantified by the use of Gel-Pro Analyzer (version 4.0) software. (B and C) Ablation effects of various HDACs. (B) F9 and HeLa cells were transfected with the indicated siRNAs, and histone modifications were analyzed and quantified. (C) Only the loss of HDAC1 causes inhibition of F9 and PA-1 cell growth. The cell growth was analyzed by microscopy, and proteins were analyzed by Western blotting and quantified by the use of Gel-Pro Analyzer (version 4.0) software. (D and E) The expression of HDAC1 and LSD1 is elevated in ES/EC cells. (D) Total mRNAs were isolated from pluripotent PA-1, F9, and mES cells and nonpluriptoent HeLa, HCT116, NIH 3T3, and NCTC1469 cells. The expression levels of LSD1, HDAC1, HDAC2, HDAC3, and HDAC6 were compared using quantitative real-time PCR (qPCR). (E) The levels of the HDAC1, HDAC2, HDAC3, and HDAC6, CoREST, and LSD1 proteins were compared between the various cell lines, as indicated. The RNA interference effects were confirmed in three independent experiments. The error bars denote SEMs for duplicate samples. The statistical differences were analyzed by one-way ANOVA. **, P < 0.01.
To determine whether additional HDACs are involved in the deacetylation of H4K16ac, we individually ablated the expression of HDACs 1 to 3 and 6 and examined their effects on the acetylation of H4K16 in nonpluripotent HeLa and pluripotent F9 cells. We found that the loss of HDAC3 or HDAC6 alone was sufficient to induce the accumulation of acetylated H4K16 in HeLa cells, even though the loss of HDAC1 could sometimes cause a slight increase of this acetylation (Fig. 5B). However, the loss of HDAC3 and HDAC6 in pluripotent EC cells, such as F9 cells, did not induce the accumulation of acetylated H4K16 and cause growth inhibition of EC cells, such as PA-1 and F9 cells (Fig. 5B and C), even though HDAC6 deficiency caused some growth inhibition in HeLa cells (Fig. 5C). These studies suggest that HDAC1 is unique in regulating the acetylation of H4K16 in ES/EC cells (Fig. 1, 2, and 5).
The levels of both HDAC1 and LSD1 are significantly elevated in ES/EC cells.
To determine the mechanism by which HDAC1 or LSD1 inactivation causes the accumulation of H4K16 acetylation only in pluripotent ES/EC cells (Fig. 2 and 5B), we examined the mRNA and protein levels of HDACs 1 to 3 and HDAC6 in pluripotent ES/EC cells and nonpluripotent cells. We found that the mRNA levels of HDAC1 and LSD1 are significantly elevated in pluripotent mES, F9, and PA-1 cells compared with their levels in nonpluripotent cells, such as HeLa, HCT116, NIH 3T3, and NCTC1469 cells (Fig. 5D). Analysis of the levels of the HDAC1 and LSD1 proteins confirmed these observations (Fig. 5E). In contrast, the expression of HDAC2, HDAC3, and HDAC6, as well as that of CoREST, remained relatively constant in both pluripotent and nonpluripotent cells (Fig. 5D and E). These studies suggest that the elevated expression of HDAC1 and LSD1 and the formation of a predominant LSD1-HDAC1 protein complex in pluripotent ES/EC cells may account for the enhanced sensitivity of H4K16 acetylation to the changes of HDAC1 or LSD1, which is required for the proliferation of ES/EC cells. However, because of the relatively low levels of LSD1 and HDAC1 in nonpluripotent cells, other HDACs, such as HDAC3 and HDAC6, may play a major role in the removal of acetylated H4K16.
HDAC1 is required for the expression of Oct4 and Sox2 and for suppressing genes for differentiation in ES/EC cells.
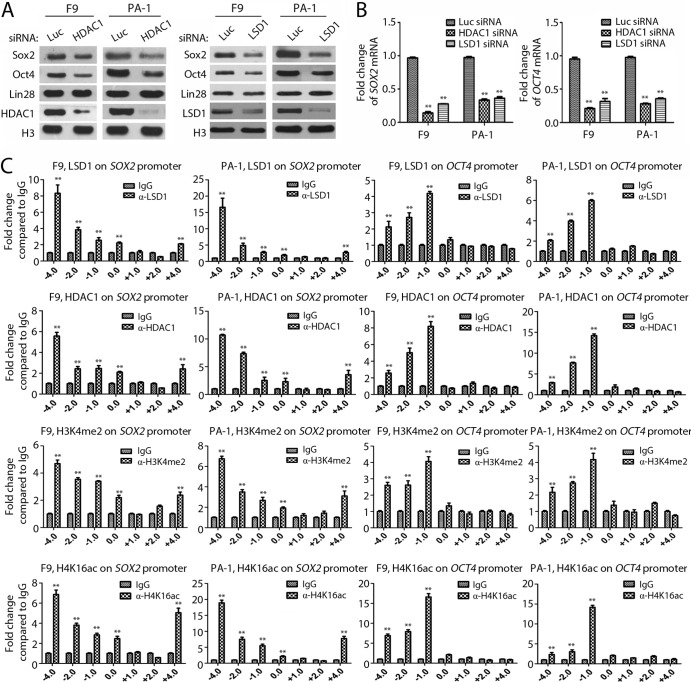
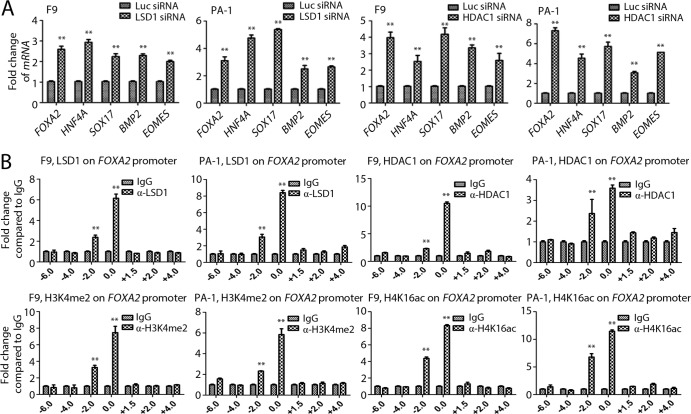
Our previous studies revealed that inhibition of LSD1 in ES/EC cells caused the downregulation of pluripotent stem cell proteins Oct4 and Sox2 (17). Consistent with this observation, we found that the loss of HDAC1 in pluripotent F9 and PA-1 cells also reduced the expression of both Oct4 and Sox2 at the mRNA and protein levels (Fig. 6A and B). In addition, inactivation of LSD1 can induce the expression of differentiation-associated genes in ES/EC cells (8, 17). We found that ablation of either HDAC1 or LSD1 by specific siRNAs also induced the expression of differentiation genes, such as FOXA2, HNF4A, SOX17, BMP2, and EOMES, in F9 and PA-1 cells (Fig. 7A), consistent with the notion that LSD1 and HDAC1 act through the same pathway to regulate the pluripotency of ES/EC cells.
FIG 6.
HDAC1 is required for the expression of Oct4 and Sox2 by directly binding to the regulatory regions. (A and B) Inactivation of HDAC1 or LSD1 suppresses the expression of pluripotent stem cell proteins Oct4 and Sox2. F9 and PA-1 cells were transfected with siRNAs specific for HDAC1 or LSD1, and the effects of Oct4 and Sox2 on the protein (A) and mRNA (B) levels were analyzed by Western blotting and qPCR. (C) Direct association of LSD1, HDAC1, H3K4me2, and H4K16ac with OCT4 and SOX2 regulatory regions. The ChIP assay was performed to analyze the binding of LSD1, HDAC1, H3K4me2, and H4K16ac to the transcriptional regulatory regions of the SOX2 and OCT4 genes using specific ChIP-grade antibodies and qPCR in F9 and PA-1 cells. IgG, purified rabbit IgG was used in ChIP as a control. All experiments were conducted in triplicate and repeated at least three times. Bars and error bars denote means ± SEMs. The statistical differences between the experimental and control groups were analyzed by one-way ANOVA. **, P < 0.01.
FIG 7.
Loss of HDAC1 or LSD1 induces the expression of genes for differentiation. (A) PA-1 and F9 cells were transfected with the indicated siRNAs. The mRNAs were isolated, and the levels of the differentiation genes FOXA2, HNF4A, SOX17, BMP2, and EOMES were analyzed using qPCR. (B) LSD1, HDAC1, H3K4me2, and H4K16ac colocalize to the regulatory regions of the differentiation gene FOXA2. The ChIP assay showed that LSD1, HDAC1, H3K4me2, and H4K16ac were enriched in the kb 0.0 to −2.0 upstream region of the FOXA2 gene in F9 and PA-1 cells. All experiments were conducted in triplicate, and the results were confirmed at least three times. Error bars denote SEMs for triplicate experiments. The statistical differences were analyzed by one-way ANOVA. **, P < 0.01.
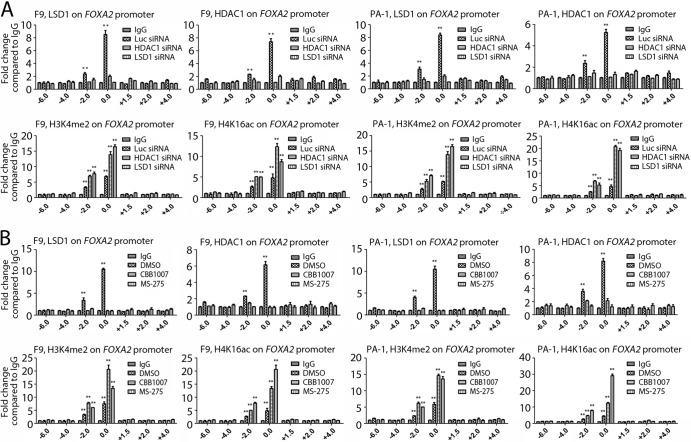
To further determine the roles of HDAC1 and LSD1 in regulating the expression of Oct4 and Sox2 and the genes for differentiation, we carried out the chromatin immunoprecipitation (ChIP) assay using antibodies specific for HDAC1, LSD1, H3K4me2, and H4K16ac and IgG as a control. The ChIP analysis allowed us to map the binding sites of HDAC1 and LSD1 and the presence of histone methylation/acetylation on the transcriptional regulatory regions of the target genes in F9 and PA-1 cells. Our results showed that both HDAC1 and LSD1, as well as H3K4me2 and H4K16ac, were enriched and colocalized on the OCT4, SOX2, and FOXA2 upstream regulatory regions (Fig. 6C and 7B). Inactivation of LSD1 or HDAC1 activities by siRNAs or by LSD1 inhibitors reduced the binding of LSD1 or HDAC1 to the promoters of differentiation genes, such as the FOXA2 promoter, and induced elevated levels of H3K4me2 and H4K16ac on the FOXA2 regulatory region (Fig. 8). These ChIP analyses suggest that LSD1 and HDAC1 directly regulate the expression of these genes in pluripotent EC cells.
FIG 8.
LSD1 or HDAC1 inactivation induces elevated levels of H3K4me2 and H4K16ac on the regulatory regions of differentiation genes. (A and B) F9 and PA-1 cells were transfected with siRNAs for 48 h (A) or treated with CBB1007 or MS-275 for 30 h (B), as indicated. The ChIP assay was performed to analyze the association of LSD1, HDAC1, H3K4me2, and H4K16ac with the transcriptional regulatory regions of FOXA2 in control and LSD1- or HDAC1-inactivated cells through qPCR in F9 and PA-1 cells. While the binding of LSD1 and HDAC1 was reduced when either LSD1 or HDAC1 was inactivated, the presence of H3K4me2 and H4K16ac was stimulated on the upstream regulatory region of the FOXA2 gene. All experiments were confirmed at least three times. The error bars represent SEMs for triplicate experiments. The statistical differences were analyzed by one-way ANOVA. **, P < 0.01.
Loss of LSD1 or HDAC1 causes G1 cell cycle arrest in pluripotent EC cells.
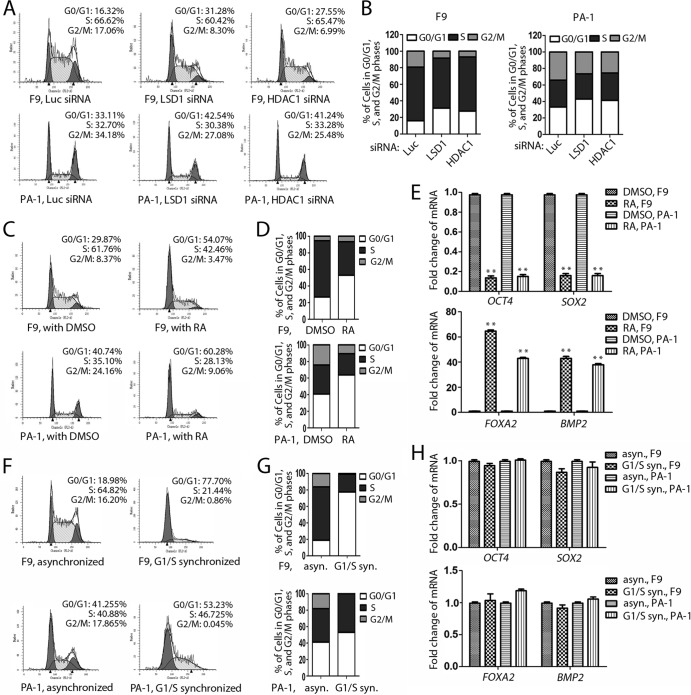
We also examined the cell cycle effects of F9 and PA-1 cells after LSD1 or HDAC1 inactivation, using fluorescence-activated cell sorting (FACS) analyses. We found that the inactivation of LSD1 or HDAC1 consistently caused a profound G1 cell cycle arrest in these EC cells (Fig. 9A and B). Such a G1 cell cycle arrest could also be induced by the treatment of these EC cells with retinoic acid (RA), a differentiation inducer (Fig. 9C and D). RA treatment also caused the reduction of pluripotent stem cell gene OCT4 and SOX2 levels and the induction of genes for differentiation, such as FOXA2 and BMP2 (Fig. 9E). However, synchronization of F9 and PA-1 cells in the G1/S border by the double-thymidine-block method was insufficient to cause the downregulation of OCT4 and SOX2 and the induction of genes for differentiation (Fig. 9F to H). These studies indicate that the effects induced by inactivation of LSD1 or HDAC1 on the expression of Oct4, Sox2, and differentiation genes are similar to those induced by the differentiation agent RA, while G1 cell cycle arrest alone was not sufficient to induce effects similar to those induced by LSD1 or HDAC1 inactivation on F9 and PA-1 cells.
FIG 9.
Loss of LSD1 or HDAC1 induces G1 cell cycle arrest in F9 and PA-1 cells. (A and B) F9 and PA-1 cells were transfected with the indicated siRNAs, and the cell cycle was analyzed by FACS. F9 and PA-1 cells were arrested in the G1 cell cycle by LSD1 or HDAC1 inactivation. (C to E) Retinoic acid (RA) treatment induces G1 cell cycle arrest and differentiation. (F to H) The G1/S arrest caused by double thymidine does not affect expression of the OCT4 or SOX2 gene or genes for differentiation in F9 and PA-1 cells. Results were confirmed by three repeated experiments, and error bars denote SEMs for duplicate experiments. The statistical differences were analyzed by one-way ANOVA. **, P < 0.01.
HDAC1 is unique in coupling the acetylation of H4K16 to the methylation of H3K4 to control the proliferation of ES/EC cells.
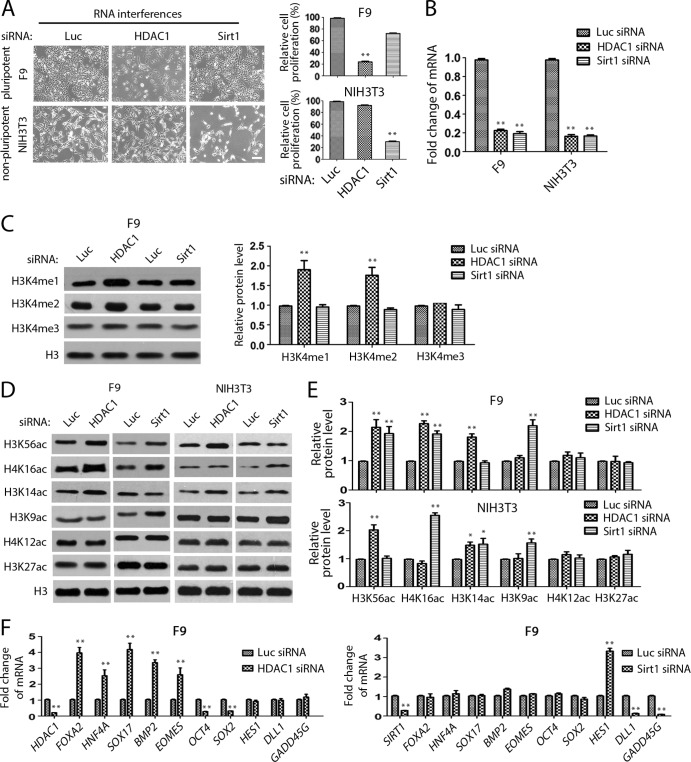
It was reported that Sirt1, another HDAC, interacts with histone H1 and removes the acetyl group from the acetylated H4K16 and H3K9 (48). We found that the loss of Sirt1 did not cause growth inhibition of pluripotent F9 and PA-1 cells, even though the proliferation of NIH 3T3 cells was affected, indicating that Sirt1 deficiency did not have effects on pluripotent EC cells similar to those of HDAC1 inactivation (Fig. 10A and B). Examination of various chromatin modifications revealed that Sirt1 inactivation caused increased levels of acetylated H4K16 and H3K9 but not increased levels of H3K4me1/me2, while the loss of HDAC1 induced the accumulation of H4K16ac and H3K4me1/me2 but not that of acetylated H3K9 (Fig. 10C to E). These analyses indicate that Sirt1 inactivation induced patterns of histone modifications that are different from those induced by the loss of HDAC1 or LSD1, except for H4K16ac. Consistent with the differential histone modifications, the loss of Sirt1 also caused gene expression patterns in F9 and PA-1 cells different from those caused by HDAC1 inactivation (Fig. 10F). While the loss of HDAC1 caused the downregulation of OCT4 and SOX2 and induced the genes for differentiation, ablation of Sirt1 did not have similar effects on the expression of these genes (Fig. 10F). Rather, Sirt1 inactivation induced the expression of HES1, which was not regulated by HDAC1 in F9 and PA-1 cells (Fig. 10F). It is likely that Sirt1 and HDAC1 regulate distinct sets of target genes due to their differences in combinatorial chromatin modifications and, possibly, compositional differences in various protein complexes in F9 and PA-1 cells.
FIG 10.
HDAC1 and Sirt1 regulate the expression of different sets of genes. (A and B) Inactivation of Sirt1 does not affect the growth of F9 cells. F9 and NIH 3T3 cells were transfected with the indicated siRNAs for 48 h. (A) Cell growth was analyzed by microscopy and quantified by MTT assays. (B) The efficacy of siRNA interference was examined by qPCR. (C) Inactivation of Sirt1 does not cause changes in H3K4me1 and H3K4me2. The proteins were analyzed by Western blotting and quantified by the use of Gel-Pro Analyzer (version 4.0) software. (D and E) The changes in histone H3 and H4 acetylation after the loss of HDAC1 and Sirt1 were analyzed by Western blotting (D), and proteins were quantified by the use of Gel-Pro Analyzer (version 4.0) software (E). (F) The loss of Sirt1 and HDAC1 has differential effects on the expression of differentiation genes and HES1. Deletion of HDAC1 upregulated differentiation genes FOXA2, HNF4A, SOX17, BMP2, and EOMES and downregulated OCT4 and SOX2 but had no effect on HES1, DLL1, and GADD45G. The loss of Sirt1 increased HES1 expression and decreased DLL1 and GADD45G expression but had negligible effects on the expression of differentiation genes and pluripotent stem cell genes. The experiments were confirmed by three repeats, and each experiment was done in duplicate. The error bars represent SEMs for duplicate experiments. The statistical differences were analyzed by one-way ANOVA. *, P < 0.05; **, P < 0.01.
Loss of MOF rescues growth inhibition of ES and EC cells by LSD1 inactivation.
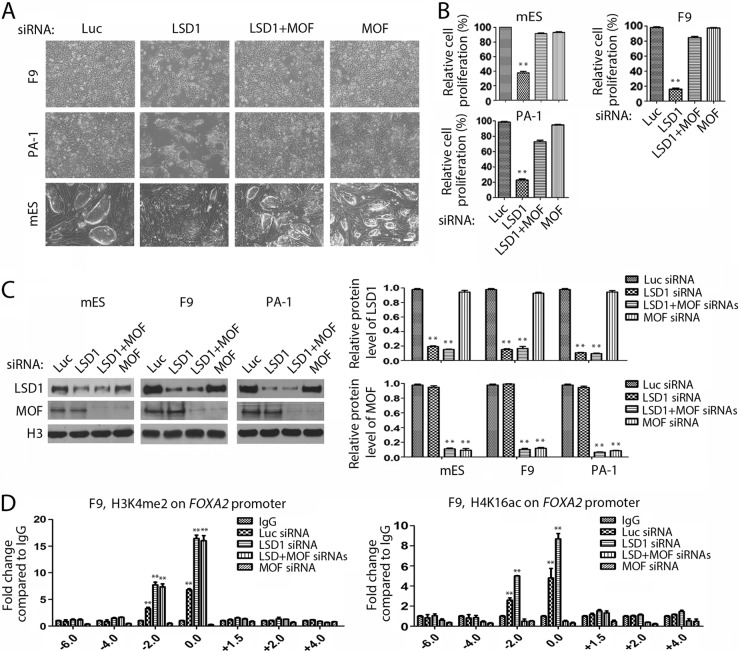
We found that the loss of LSD1 or HDAC1 caused the unique increase of H4K16 acetylation in ES/EC cells (Fig. 2A). If increased acetylation of H4K16 plays a critical role in the selective growth-inhibitory effects after LSD1 inhibition in ES/EC cells, reduction or elimination of the increased level of H4K16 acetylation should diminish the effects of LSD1 inactivation. To test this possibility, we examined the effects of ablation of MOF on growth inhibition after LSD1 inactivation in pluripotent mES, F9, and PA-1 cells. MOF is an acetyltransferase that usually associates with H3K4-specific methyltransferase MLL complexes to specifically acetylate H4K16 (49). We found that while the loss of LSD1 caused the marked growth inhibition of mES, F9, and PA-1 cells, coablation of LSD1 and MOF significantly rescued the growth inhibition caused by LSD1 deficiency in these ES/EC cells (Fig. 11A to C). However, the loss of MOF alone did not have discernible effects on the growth of ES/EC cells (Fig. 11A and B).
FIG 11.
Loss of the acetyltransferase MOF rescues the growth-inhibitory effects of LSD1 inactivation in ES/EC cells. (A to C) F9, PA-1, and mES cells were transfected with siRNAs specific for luciferase, LSD1, LSD1 plus MOF, and MOF for 48 h. Cell growth was examined by microscopy (A) and quantified by MTT assays (B). Proteins were analyzed by Western blotting and quantified by the use of Gel-Pro Analyzer (version 4.0) software (C). (D) The loss of MOF restored the levels of H4K16ac but not those of H3K4me2 on the FOXA2 gene. F9 cells were transfected with siRNAs, as indicated, and the presence of H3K4me2 and H4K16ac on FOXA2 was analyzed by ChIP using control IgG and anti-H3K4me2 and anti-H4K16ac antibodies. The results of the rescue experiments were independently confirmed three times. The error bars represent SEMs for duplicate samples. The statistical differences were analyzed by one-way ANOVA. **, P < 0.01.
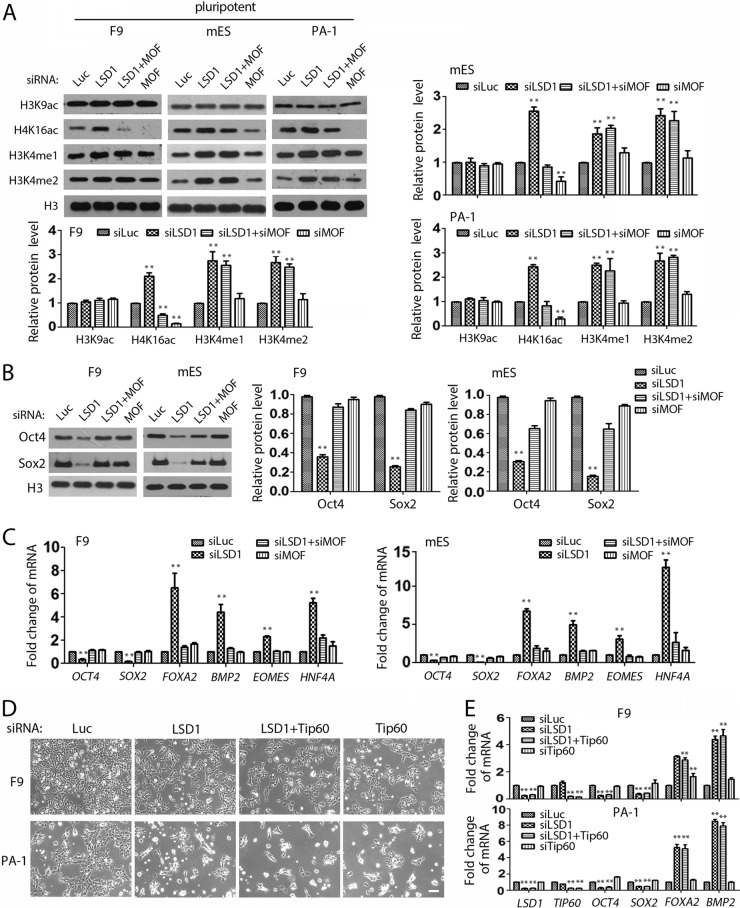
Examination of histone modifications showed that while the loss of LSD1 increased the levels of acetylated H4K16, coablation of LSD1 and MOF nearly restored the normal levels of acetylated H4K16 in LSD1-deficient cells (Fig. 12A). Interestingly, the loss of MOF did not appear to have significant effects on the global mono- and dimethylation of H3K4 or dimethylated H3K4 on the FOXA2 gene, even though it caused decreased levels of H4K16ac on FOXA2 (Fig. 11D and 12A), suggesting that MOF acts through H4K16 acetylation to rescue the growth inhibition in ES/EC cells. Importantly, ablation of MOF is also sufficient to restore the downregulated Oct4 and Sox2 levels in LSD1-deficient ES/EC cells (Fig. 12B) and partially suppressed the induction of differentiation genes FOXA2, HNF4A, BMP2, and EOMES in these cells (Fig. 12C). The rescuing effect is specific for MOF, as loss of another histone acetyltransferase, Tip60 (KAT5), could not rescue growth inhibition, the reduction of Oct4/Sox2, or the suppression of differentiation genes induced by LSD1 inactivation in F9 and PA-1 cells (Fig. 12D and E). Our studies thus reveal that LSD1 acts through the HDAC1- and MOF-mediated regulation of H4K16 acetylation to maintain the pluripotency of ES/EC cells.
FIG 12.
Inactivation of MOF reverses the effects of LSD1 inactivation on increased acetylation of H4K16 and gene expression in ES/EC cells. (A) F9, mES, and PA-1 cells were transfected with the indicated siRNAs. Histone modifications of H3 and H4 were monitored by Western blotting and quantified by the use of Gel-Pro Analyzer (version 4.0) software. MOF inactivation reversed the increase in H4K16ac in LSD1-deficient cells. (B and C) MOF inactivation restored the protein (B) and mRNA (C) levels of Oct4 and Sox2 and partially rescued the mRNA expression of differentiation genes FOXA2, BMP2, EOMES, and HNF4A in LSD1-deficient mES and F9 cells. (D and E) Ablation of acetyltransferase Tip60 did not rescue the growth-inhibitory effects or gene expression in LSD1-deficient F9 and PA-1 cells. F9 and PA-1 cells were transfected with the indicated siRNAs for 48 h, and cell growth (D) and the expression of OCT4, SOX2, FOXA2, and BMP2 (E) were analyzed, as indicated. Rescue data were confirmed three times, and error bars represent SEMs for duplicate experiments. The statistical differences were analyzed by one-way ANOVA. *, P < 0.05; **, P < 0.01.
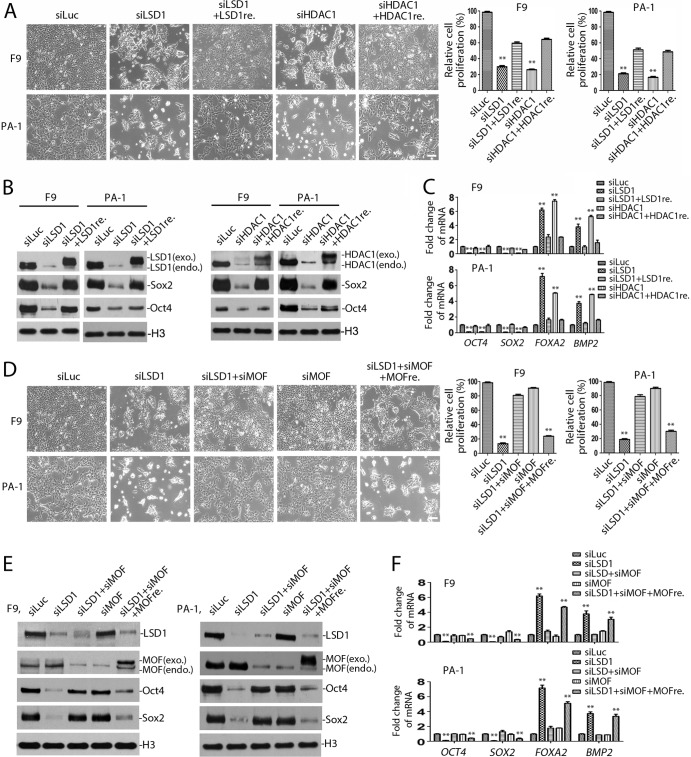
To eliminate the possibility of potential off-target effects of siRNAs, we also examined whether the effects of inactivation of LSD1, HDAC1, and MOF by siRNAs can be rescued by reexpression of LSD1, HDAC1, and MOF, respectively. While ablation of LSD1, HDAC1, or MOF expression using siRNAs specifically targeting the UTRs of their cognate mRNAs caused growth inhibition of F9 or PA-1 cells, reexpression of the coding cDNAs of LSD1, HDAC1, and MOF in these growth-inhibited cells restored their growth (Fig. 13). Our studies confirmed that LSD1, HDAC1, and MOF indeed regulate pluripotency and cell cycle progression in these EC cells.
FIG 13.
Restoration of LSD1, HDAC1, and MOF siRNA ablation effects by reexpression of cognate cDNAs. (A to C) After they were transfected with siRNA specific for the LSD1 and HDAC1 5′ or 3′ UTR for 24 h, F9 and PA-1 cells were transfected with Flag-tagged LSD1 (LSD1re, where the suffix -re represents reexpression) or HDAC1 (HDAC1re) cDNA to express ectopic cDNAs for another 24 h. The transfection efficiency for reexpression was about 50 to 60%, using parallel expression of GFP on the same vector as a control. Cell growth (A), proteins (B), and mRNAs (C) were analyzed to determine the effects of expression of exogenous (exo.) proteins after target gene ablation. endo., endogenous. (D to F) Effects of reexpression of Flag-tagged MOF (MOFre) in LSD1- and MOF-ablated F9 and PA-1 cells. siMOF, siRNA for MOF. Experiments were confirmed with three repeats. Error bars denote the SEMs for duplicate data. The statistical differences were analyzed by one-way ANOVA. **, P < 0.01.
DISCUSSION
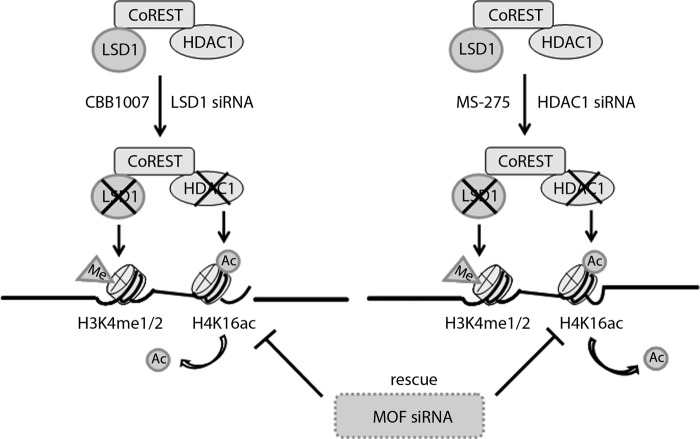
In this study, we found that LSD1 forms a complex with HDAC1 and CoREST and that the loss of HDAC1 phenocopied the selective growth-inhibitory effects induced by LSD1 inactivation in ES/EC cells but not in nonpluripotent cells (Fig. 1). Our studies revealed that the activities of LSD1 or HDAC1 in the CoREST complex are mutually dependent and inhibition of either LSD1 or HDAC1 activity is sufficient to cause the inactivation of both LSD1 and HDAC1 in the CoREST complex (Fig. 2 to 4; the results are summarized in Fig. 14). While LSD1 prefers the hypoacetylated histones as the substrates for demethylation, HDAC1 is less active on its acetylated substrates if H3K4 is hypermethylated (Fig. 4). Thus, the activities of LSD1 and HDAC1 in the CoREST complex are controlled by both allosteric regulation and substrate preference.
FIG 14.
Schematic summarizing LSD1- or HDAC1-regulated pluripotency of mES or EC cells through HDAC1-mediated H4K16 acetylation. LSD1 and HDAC1 form a complex with CoREST, and the activities of LSD1 and HDAC1 in the CoREST complex are mutually dependent. Acetylated H4K16 was the direct substrate of HDAC1 in ES/EC cells. The loss of MOF reversed the growth-inhibitory effects of LSD1 inactivation in ES/EC cells. Me, methylated; Ac, acetylated or acetyl.
We found that the loss of LSD1 or HDAC1 uniquely causes the accumulation of acetylated H4K16 and mono- and dimethylation of H3K4 in ES/EC cells but not in nonpluripotent cells (Fig. 2). Although HDAC1 was known to deacetylate H3K56ac (19), our studies indicate that HDAC1 also specifically removes the acetyl group from acetylated H4K16 (Fig. 3). However, we found that H4K16ac is regulated by multiple HDACs, including HDAC3, HDAC6, and HDAC1, in nonpluripotent cells, such as HeLa and NIH 3T3 cells (Fig. 5). However, the levels of LSD1 and HDAC1 in the pluripotent ES and EC cells are highly elevated (Fig. 5), which may contribute to the preferential accumulation of acetylated H4K16 after the loss of either LSD1 or HDAC1 in ES/EC cells.
Our studies suggest that the acetylation of H4K16 serves as a key regulatory mechanism that mediates the selective growth-inhibitory effects of LSD1 inhibition in pluripotent ES/EC cells. Reduction of the acetylation of H4K16 after inactivation of MOF is sufficient to restore the growth of ES/EC cells even when LSD1 activity is inactivated (Fig. 11 to 14). Our studies thus revealed an important regulatory circuitry in ES/EC cells by which LSD1 regulates the pluripotency, cell cycle progression, and cellular differentiation of pluripotent ES and EC cells through HDAC1-mediated deacetylation of H4K16 in a coordinated manner through the LSD1-CoREST-HDAC1 protein complex (Fig. 14).
ACKNOWLEDGMENTS
This work was supported by grants from the Fong Shu Fook Tong Foundation and the Joyce M. Kuok Foundation, a Shenzhen SZSITIC grant (JC201104210125A), the National Natural Science Foundation of China (NSFC30971616 and 21133002), the National Institutes of Health (R01CA989550), and cancer research funds from S. W. Carper and J. A. Elegbede to the University of Nevada, Las Vegas.
We declare that no competing interests exist.
Footnotes
Published ahead of print 4 November 2013
REFERENCES
- 1.Shi Y, Lan F, Matson C, Mulligan P, Whetstine JR, Cole PA, Casero RA. 2004. Histone demethylation mediated by the nuclear amine oxidase homolog LSD1. Cell 119:941–953. 10.1016/j.cell.2004.12.012 [DOI] [PubMed] [Google Scholar]
- 2.Metzger E, Wissmann M, Yin N, Muller JM, Schneider R, Peters AH, Gunther T, Buettner R, Schule R. 2005. LSD1 demethylates repressive histone marks to promote androgen-receptor-dependent transcription. Nature 437:436–439. 10.1038/nature04020 [DOI] [PubMed] [Google Scholar]
- 3.Shi YJ, Matson C, Lan F, Iwase S, Baba T, Shi Y. 2005. Regulation of LSD1 histone demethylase activity by its associated factors. Mol. Cell 19:857–864. 10.1016/j.molcel.2005.08.027 [DOI] [PubMed] [Google Scholar]
- 4.Lee MG, Wynder C, Cooch N, Shiekhattar R. 2005. An essential role for CoREST in nucleosomal histone 3 lysine 4 demethylation. Nature 437:432–435. 10.1038/nature04021 [DOI] [PubMed] [Google Scholar]
- 5.Shi Y, Sawada J, Sui G, Affar el B, Whetstine JR, Lan F, Ogawa H, Luke MP, Nakatani Y. 2003. Coordinated histone modifications mediated by a CtBP co-repressor complex. Nature 422:735–738. 10.1038/nature01550 [DOI] [PubMed] [Google Scholar]
- 6.Wang Y, Zhang H, Chen Y, Sun Y, Yang F, Yu W, Liang J, Sun L, Yang X, Shi L, Li R, Li Y, Zhang Y, Li Q, Yi X, Shang Y. 2009. LSD1 is a subunit of the NuRD complex and targets the metastasis programs in breast cancer. Cell 138:660–672. 10.1016/j.cell.2009.05.050 [DOI] [PubMed] [Google Scholar]
- 7.Wang J, Hevi S, Kurash JK, Lei H, Gay F, Bajko J, Su H, Sun W, Chang H, Xu G, Gaudet F, Li E, Chen T. 2009. The lysine demethylase LSD1 (KDM1) is required for maintenance of global DNA methylation. Nat. Genet. 41:125–129. 10.1038/ng.268 [DOI] [PubMed] [Google Scholar]
- 8.Adamo A, Sese B, Boue S, Castano J, Paramonov I, Barrero MJ, Izpisua Belmonte JC. 2011. LSD1 regulates the balance between self-renewal and differentiation in human embryonic stem cells. Nat. Cell Biol. 13:652–659. 10.1038/ncb2246 [DOI] [PubMed] [Google Scholar]
- 9.Whyte WA, Bilodeau S, Orlando DA, Hoke HA, Frampton GM, Foster CT, Cowley SM, Young RA. 2012. Enhancer decommissioning by LSD1 during embryonic stem cell differentiation. Nature 482:221–225. 10.1038/nature10805 [DOI] [PMC free article] [PubMed] [Google Scholar]
- 10.Harris WJ, Huang X, Lynch JT, Spencer GJ, Hitchin JR, Li Y, Ciceri F, Blaser JG, Greystoke BF, Jordan AM, Miller CJ, Ogilvie DJ, Somervaille TC. 2012. The histone demethylase KDM1A sustains the oncogenic potential of MLL-AF9 leukemia stem cells. Cancer Cell 21:473–487. 10.1016/j.ccr.2012.03.014 [DOI] [PubMed] [Google Scholar]
- 11.Sun G, Alzayady K, Stewart R, Ye P, Yang S, Li W, Shi Y. 2010. Histone demethylase LSD1 regulates neural stem cell proliferation. Mol. Cell. Biol. 30:1997–2005. 10.1128/MCB.01116-09 [DOI] [PMC free article] [PubMed] [Google Scholar]
- 12.Lim S, Janzer A, Becker A, Zimmer A, Schule R, Buettner R, Kirfel J. 2010. Lysine-specific demethylase 1 (LSD1) is highly expressed in ER-negative breast cancers and a biomarker predicting aggressive biology. Carcinogenesis 31:512–520. 10.1093/carcin/bgp324 [DOI] [PubMed] [Google Scholar]
- 13.Schulte JH, Lim S, Schramm A, Friedrichs N, Koster J, Versteeg R, Ora I, Pajtler K, Klein-Hitpass L, Kuhfittig-Kulle S, Metzger E, Schule R, Eggert A, Buettner R, Kirfel J. 2009. Lysine-specific demethylase 1 is strongly expressed in poorly differentiated neuroblastoma: implications for therapy. Cancer Res. 69:2065–2071. 10.1158/0008-5472.CAN-08-1735 [DOI] [PubMed] [Google Scholar]
- 14.Bennani-Baiti IM, Machado I, Llombart-Bosch A, Kovar H. 2012. Lysine-specific demethylase 1 (LSD1/KDM1A/AOF2/BHC110) is expressed and is an epigenetic drug target in chondrosarcoma, Ewing's sarcoma, osteosarcoma, and rhabdomyosarcoma. Hum. Pathol. 43:1300–1307. 10.1016/j.humpath.2011.10.010. [DOI] [PubMed] [Google Scholar]
- 15.Kahl P, Gullotti L, Heukamp LC, Wolf S, Friedrichs N, Vorreuther R, Solleder G, Bastian PJ, Ellinger J, Metzger E, Schule R, Buettner R. 2006. Androgen receptor coactivators lysine-specific histone demethylase 1 and four and a half LIM domain protein 2 predict risk of prostate cancer recurrence. Cancer Res. 66:11341–11347. 10.1158/0008-5472.CAN-06-1570 [DOI] [PubMed] [Google Scholar]
- 16.Hayami S, Kelly JD, Cho HS, Yoshimatsu M, Unoki M, Tsunoda T, Field HI, Neal DE, Yamaue H, Ponder BA, Nakamura Y, Hamamoto R. 2011. Overexpression of LSD1 contributes to human carcinogenesis through chromatin regulation in various cancers. Int. J. Cancer 128:574–586. 10.1002/ijc.25349 [DOI] [PubMed] [Google Scholar]
- 17.Wang J, Lu F, Ren Q, Sun H, Xu Z, Lan R, Liu Y, Ward D, Quan J, Ye T, Zhang H. 2011. Novel histone demethylase LSD1 inhibitors selectively target cancer cells with pluripotent stem cell properties. Cancer Res. 71:7238–7249. 10.1158/0008-5472.CAN-11-0896 [DOI] [PMC free article] [PubMed] [Google Scholar]
- 18.Dovey OM, Foster CT, Cowley SM. 2010. Histone deacetylase 1 (HDAC1), but not HDAC2, controls embryonic stem cell differentiation. Proc. Natl. Acad. Sci. U. S. A. 107:8242–8247. 10.1073/pnas.1000478107 [DOI] [PMC free article] [PubMed] [Google Scholar]
- 19.Rajendran P, Ho E, Williams DE, Dashwood RH. 2011. Dietary phytochemicals, HDAC inhibition, and DNA damage/repair defects in cancer cells. Clin. Epigenetics 3:4. 10.1186/1868-7083-3-4 [DOI] [PMC free article] [PubMed] [Google Scholar]
- 20.Downs JA. 2008. Histone H3 K56 acetylation, chromatin assembly, and the DNA damage checkpoint. DNA Repair (Amst.) 7:2020–2024. 10.1016/j.dnarep.2008.08.016 [DOI] [PubMed] [Google Scholar]
- 21.Li Q, Zhou H, Wurtele H, Davies B, Horazdovsky B, Verreault A, Zhang Z. 2008. Acetylation of histone H3 lysine 56 regulates replication-coupled nucleosome assembly. Cell 134:244–255. 10.1016/j.cell.2008.06.018 [DOI] [PMC free article] [PubMed] [Google Scholar]
- 22.Maas NL, Miller KM, DeFazio LG, Toczyski DP. 2006. Cell cycle and checkpoint regulation of histone H3 K56 acetylation by Hst3 and Hst4. Mol. Cell 23:109–119. 10.1016/j.molcel.2006.06.006 [DOI] [PubMed] [Google Scholar]
- 23.Xie W, Song C, Young NL, Sperling AS, Xu F, Sridharan R, Conway AE, Garcia BA, Plath K, Clark AT, Grunstein M. 2009. Histone H3 lysine 56 acetylation is linked to the core transcriptional network in human embryonic stem cells. Mol. Cell 33:417–427. 10.1016/j.molcel.2009.02.004 [DOI] [PMC free article] [PubMed] [Google Scholar]
- 24.Yuan J, Pu M, Zhang Z, Lou Z. 2009. Histone H3-K56 acetylation is important for genomic stability in mammals. Cell Cycle 8:1747–1753. 10.4161/cc.8.11.8620 [DOI] [PMC free article] [PubMed] [Google Scholar]
- 25.Lagger G, O'Carroll D, Rembold M, Khier H, Tischler J, Weitzer G, Schuettengruber B, Hauser C, Brunmeir R, Jenuwein T, Seiser C. 2002. Essential function of histone deacetylase 1 in proliferation control and CDK inhibitor repression. EMBO J. 21:2672–2681. 10.1093/emboj/21.11.2672 [DOI] [PMC free article] [PubMed] [Google Scholar]
- 26.Glozak MA, Seto E. 2007. Histone deacetylases and cancer. Oncogene 26:5420–5432. 10.1038/sj.onc.1210610 [DOI] [PubMed] [Google Scholar]
- 27.Fournel M, Bonfils C, Hou Y, Yan PT, Trachy-Bourget MC, Kalita A, Liu J, Lu AH, Zhou NZ, Robert MF, Gillespie J, Wang JJ, Ste-Croix H, Rahil J, Lefebvre S, Moradei O, Delorme D, Macleod AR, Besterman JM, Li Z. 2008. MGCD0103, a novel isotype-selective histone deacetylase inhibitor, has broad spectrum antitumor activity in vitro and in vivo. Mol. Cancer Ther. 7:759–768. 10.1158/1535-7163.MCT-07-2026 [DOI] [PubMed] [Google Scholar]
- 28.Hayashi A, Horiuchi A, Kikuchi N, Hayashi T, Fuseya C, Suzuki A, Konishi I, Shiozawa T. 2010. Type-specific roles of histone deacetylase (HDAC) overexpression in ovarian carcinoma: HDAC1 enhances cell proliferation and HDAC3 stimulates cell migration with downregulation of E-cadherin. Int. J. Cancer 127:1332–1346. 10.1002/ijc.25151 [DOI] [PubMed] [Google Scholar]
- 29.Higashijima J, Kurita N, Miyatani T, Yoshikawa K, Morimoto S, Nishioka M, Iwata T, Shimada M. 2011. Expression of histone deacetylase 1 and metastasis-associated protein 1 as prognostic factors in colon cancer. Oncol. Rep. 26:343–348. 10.3892/or.2011.1312 [DOI] [PubMed] [Google Scholar]
- 30.Gao DJ, Xu M, Zhang YQ, Du YQ, Gao J, Gong YF, Man XH, Wu HY, Jin J, Xu GM, Li ZS. 2010. Upregulated histone deacetylase 1 expression in pancreatic ductal adenocarcinoma and specific siRNA inhibits the growth of cancer cells. Pancreas 39:994–1001. 10.1097/MPA.0b013e3181db0086 [DOI] [PubMed] [Google Scholar]
- 31.Minamiya Y, Ono T, Saito H, Takahashi N, Ito M, Mitsui M, Motoyama S, Ogawa J. 2011. Expression of histone deacetylase 1 correlates with a poor prognosis in patients with adenocarcinoma of the lung. Lung Cancer 74:300–304. 10.1016/j.lungcan.2011.02.019 [DOI] [PubMed] [Google Scholar]
- 32.Al-Janadi A, Chandana SR, Conley BA. 2008. Histone deacetylation: an attractive target for cancer therapy? Drugs R D 9:369–383. 10.2165/0126839-200809060-00003 [DOI] [PubMed] [Google Scholar]
- 33.Witt O, Deubzer HE, Milde T, Oehme I. 2009. HDAC family: what are the cancer relevant targets? Cancer Lett. 277:8–21. 10.1016/j.canlet.2008.08.016 [DOI] [PubMed] [Google Scholar]
- 34.Rea S, Xouri G, Akhtar A. 2007. Males absent on the first (MOF): from flies to humans. Oncogene 26:5385–5394. 10.1038/sj.onc.1210607 [DOI] [PubMed] [Google Scholar]
- 35.Conrad T, Cavalli FM, Holz H, Hallacli E, Kind J, Ilik I, Vaquerizas JM, Luscombe NM, Akhtar A. 2012. The MOF chromobarrel domain controls genome-wide H4K16 acetylation and spreading of the MSL complex. Dev. Cell 22:610–624. 10.1016/j.devcel.2011.12.016 [DOI] [PubMed] [Google Scholar]
- 36.Gelbart ME, Larschan E, Peng S, Park PJ, Kuroda MI. 2009. Drosophila MSL complex globally acetylates H4K16 on the male X chromosome for dosage compensation. Nat. Struct. Mol. Biol. 16:825–832. 10.1038/nsmb.1644 [DOI] [PMC free article] [PubMed] [Google Scholar]
- 37.Wells MB, Snyder MJ, Custer LM, Csankovszki G. 2012. Caenorhabditis elegans dosage compensation regulates histone H4 chromatin state on X chromosomes. Mol. Cell. Biol. 32:1710–1719. 10.1128/MCB.06546-11 [DOI] [PMC free article] [PubMed] [Google Scholar]
- 38.Li X, Li L, Pandey R, Byun JS, Gardner K, Qin Z, Dou Y. 2012. The histone acetyltransferase MOF is a key regulator of the embryonic stem cell core transcriptional network. Cell Stem Cell 11:163–178. 10.1016/j.stem.2012.04.023 [DOI] [PMC free article] [PubMed] [Google Scholar]
- 39.Pushpavalli SN, Sarkar A, Ramaiah MJ, Chowdhury DR, Bhadra U, Pal-Bhadra M. 2013. Drosophila MOF controls Checkpoint protein2 and regulates genomic stability during early embryogenesis. BMC Mol. Biol. 14:1. 10.1186/1471-2199-14-1 [DOI] [PMC free article] [PubMed] [Google Scholar]
- 40.Gupta A, Guerin-Peyrou TG, Sharma GG, Park C, Agarwal M, Ganju RK, Pandita S, Choi K, Sukumar S, Pandita RK, Ludwig T, Pandita TK. 2008. The mammalian ortholog of Drosophila MOF that acetylates histone H4 lysine 16 is essential for embryogenesis and oncogenesis. Mol. Cell. Biol. 28:397–409. 10.1128/MCB.01045-07 [DOI] [PMC free article] [PubMed] [Google Scholar]
- 41.Pfister S, Rea S, Taipale M, Mendrzyk F, Straub B, Ittrich C, Thuerigen O, Sinn HP, Akhtar A, Lichter P. 2008. The histone acetyltransferase hMOF is frequently downregulated in primary breast carcinoma and medulloblastoma and constitutes a biomarker for clinical outcome in medulloblastoma. Int. J. Cancer 122:1207–1213. 10.1002/ijc.23283 [DOI] [PubMed] [Google Scholar]
- 42.Wang Y, Zhang R, Wu D, Lu Z, Sun W, Cai Y, Wang C, Jin J. 2013. Epigenetic change in kidney tumor: downregulation of histone acetyltransferase MYST1 in human renal cell carcinoma. J. Exp. Clin. Cancer Res. 32:8. 10.1186/1756-9966-32-8 [DOI] [PMC free article] [PubMed] [Google Scholar]
- 43.Jin J, Arias EE, Chen J, Harper JW, Walter JC. 2006. A family of diverse Cul4-Ddb1-interacting proteins includes Cdt2, which is required for S phase destruction of the replication factor Cdt1. Mol. Cell 23:709–721. 10.1016/j.molcel.2006.08.010 [DOI] [PubMed] [Google Scholar]
- 44.Lan R, Lin G, Yin F, Xu J, Zhang X, Wang J, Wang Y, Gong J, Ding YH, Yang Z, Lu F, Zhang H. 2012. Dissecting the phenotypes of Plk1 inhibition in cancer cells using novel kinase inhibitory chemical CBB2001. Lab. Invest. 92:1503–1514. 10.1038/labinvest.2012.114 [DOI] [PubMed] [Google Scholar]
- 45.Shi Y. 2007. Histone lysine demethylases: emerging roles in development, physiology and disease. Nat. Rev. Genet. 8:829–833. 10.1038/nrg2218 [DOI] [PubMed] [Google Scholar]
- 46.Jurkin J, Zupkovitz G, Lagger S, Grausenburger R, Hagelkruys A, Kenner L, Seiser C. 2011. Distinct and redundant functions of histone deacetylases HDAC1 and HDAC2 in proliferation and tumorigenesis. Cell Cycle 10:406–412. 10.4161/cc.10.3.14712 [DOI] [PMC free article] [PubMed] [Google Scholar]
- 47.Haberland M, Johnson A, Mokalled MH, Montgomery RL, Olson EN. 2009. Genetic dissection of histone deacetylase requirement in tumor cells. Proc. Natl. Acad. Sci. U. S. A. 106:7751–7755. 10.1073/pnas.0903139106 [DOI] [PMC free article] [PubMed] [Google Scholar]
- 48.Vaquero A, Scher M, Lee D, Erdjument-Bromage H, Tempst P, Reinberg D. 2004. Human SirT1 interacts with histone H1 and promotes formation of facultative heterochromatin. Mol. Cell 16:93–105. 10.1016/j.molcel.2004.08.031 [DOI] [PubMed] [Google Scholar]
- 49.Dou Y, Milne TA, Tackett AJ, Smith ER, Fukuda A, Wysocka J, Allis CD, Chait BT, Hess JL, Roeder RG. 2005. Physical association and coordinate function of the H3 K4 methyltransferase MLL1 and the H4 K16 acetyltransferase MOF. Cell 121:873–885. 10.1016/j.cell.2005.04.031 [DOI] [PubMed] [Google Scholar]


