

Abstract
Our multicenter nationwide surveillance data indicated that erythromycin (ERY) resistance among group A Streptococcus (GAS) isolates in Taiwan declined from 53.1% in 1998 and 2000 to 14.6% in 2002 and 2004 and 10.7% in 2006 to 2010 (P < 0.01). The present study aimed to assess the epidemiology of GAS in Taiwan and identify factors associated with ERY resistance. All 127 ERY-resistant (ERYr) isolates and 128 randomly selected ERY-susceptible (ERYs) isolates recovered from 1998 to 2010 were emm typed. ERYr isolates were also characterized by ERY resistance phenotype and mechanisms and pulsed-field gel electrophoresis (PFGE). Multilocus sequence typing was performed on selected ERYr isolates. The predominant emm types in ERYr isolates were emm22 (n = 33, 26.0%), emm12 (n = 24, 18.9%), emm4 (n = 21, 16.5%), and emm106 (n = 15, 11.8%). In ERYs isolates, emm12 (n = 27, 21.9%), emm1 (n = 18, 14.1%), emm106 (n = 16, 12.5%), and emm11 (n = 9, 7.1%) predominated. The most common ERY resistance phenotype was the M phenotype (resistant to macrolides) (70.9%), with all but one isolate carrying mef(A), followed by the constitutive macrolide-lincosamide-streptogramin B resistance (cMLSB) phenotype (26.8%), with isolates carrying erm(B) or erm(TR). ERYr isolates of the emm12-sequence type 36 (ST36) lineage with the cMLSB phenotype were mostly present before 2004, while those of the emm22-ST46 lineage with the M phenotype predominated in later years. Recovery from respiratory (throat swab) specimens was an independent factor associated with ERY resistance. emm1 and emm11 GAS isolates were significantly associated with ERYs, while emm22 was detected only in ERYr GAS. In addition, emm106 isolates were prevalent among the abscess/pus isolates, whereas emm12 isolates were strongly associated with a respiratory (throat) origin. In addition to identifying factors associated with ERY resistance in GAS, our study provides helpful information on the changing GAS epidemiology in Taiwan.
INTRODUCTION
Streptococcus pyogenes (group A Streptococcus [GAS]) is an important Gram-positive pathogen responsible for a broad spectrum of infections ranging from pharyngitis and impetigo to invasive necrotizing fasciitis, streptococcal toxic shock syndrome, puerperal fever, pneumonia, and bacteremia (1, 2). Among the various virulence factors of GAS contributing to its successful host invasion, the cell surface M protein plays a key role in GAS resistance to phagocytosis (1). The hypervariable 5′ region of the M protein, which is encoded by the emm gene, serves as the basis for the study of the molecular epidemiology of GAS (emm typing) (3, 4). Over 200 emm types have been identified to date, and certain emm types are associated with more severe diseases, while some emm types are associated with antimicrobial resistance (4, 5). Since the distribution of emm types can vary from region to region, data on the predominant emm types in different populations provide helpful information in GAS vaccine formulation (4).
Penicillin has been the drug of choice for the treatment of GAS infections. For severe invasive GAS diseases, high-dose penicillin and clindamycin are recommended. In patients who are allergic to penicillin, macrolides and lincosamides are alternative treatment choices (6). Erythromycin (ERY) is an effective macrolide antibiotic for treating GAS respiratory tract infections. However, increasing ERY resistance in GAS isolates was noted in the 1990s, and in some countries, this resistance peaked in the early 2000s (5, 7, 8). The fluctuation in GAS macrolide resistance has been associated with changes in macrolide use (5, 8–11).
Several resistance genes, mef(A), erm(B), and erm(A) subtype erm(TR), are associated with ERY resistance in GAS (12, 13). mef(A) encodes an efflux pump which selectively removes 14- and 15-membered macrolides from the bacterial cell and is commonly associated with the M phenotype (resistant to macrolides but susceptible to lincosamides and streptogramin B). erm(B) and erm(TR) encode 23S rRNA methylases which mediate target site modification and result in resistance to macrolide, lincosamide, and streptogramin B (MLSB) antibiotics. Macrolide, lincosamide, and streptogramin B resistance can be either constitutive (cMLSB) or induced (iMLSB). erm(B) is commonly associated with the cMLSB phenotype, while erm(TR) is associated with the iMLSB phenotype. In addition, the ERY resistance genes often co-occur with the tetracycline (TCY) resistance genes tet(O) and tet(M), which encode proteins that interfere with the binding of TCY to its target 30S ribosome in bacteria, due to carriage of the resistance determinants on the same mobile genetic element (12).
In the 1990s, several reports indicated that antimicrobial resistance had become a serious problem in hospitals and the community in Taiwan (14, 15). In an effort to contain the increasing antimicrobial resistance, the Bureau of National Health Insurance (BNHI) in Taiwan implemented a policy to restrict antibiotic use for acute upper respiratory tract infections in ambulatory patients effective in 2001 (16). This resulted in reduced outpatient use of antimicrobials, including macrolides (8, 16). Subsequently, a reduction in macrolide resistance in GAS was noted in a study of 3 medical centers in Taiwan (8). However, longitudinal multicenter national data on GAS epidemiology have not been reported.
The Taiwan Surveillance of Antimicrobial Resistance (TSAR) is a national surveillance program that has been conducted biennially since 1998 (14, 17, 18). The present study investigated the epidemiology of GAS isolates in the TSAR collection recovered from 1998 to 2010. In addition to ERY resistance mechanisms and phenotypes, the GAS isolates were characterized by emm typing, pulsed-field gel electrophoresis (PFGE), and multilocus sequence typing (MLST). Factors associated with ERY resistance and emm types were also investigated.
MATERIALS AND METHODS
Bacterial isolates and culture condition.
GAS isolates were collected from hospitals participating in TSAR biennially between 1998 and 2010 (corresponding to TSAR round I [TSAR I] to TSAR VII). The collection protocols and participating hospitals for TSAR I and II have been described previously (14, 18). In TSAR III (2002) to TSAR VII (2010), isolates were collected between July and September from the same 26 hospitals, except for isolates in TSAR V (2006), in which 1 hospital did not participate (17). Briefly, each hospital first collected a fixed number of outpatient isolates (n = 50) and inpatient isolates (n = 150), after which an additional 20 (for the TSAR rounds from 2002 to 2006) to 50 (for the TSAR rounds in 2008 and 2010) isolates were collected from blood and sterile body sites. The isolates were collected sequentially without specifying the species. After completion of the above-described collection efforts, we asked the hospitals to further collect all GAS isolates during the collection months (for the TSAR rounds from 2002 to 2010). No special collection of GAS was made in TSAR I (1998) and II (2000). These hospitals comprised medical centers and regional hospitals located in all 4 regions of Taiwan, and 16 hospitals participated in all 7 rounds of TSAR. The isolates were stored at −80°C in bead-containing Microbank cryovials (Pro-Lab Diagnostics, Austin, TX). Confirmation of GAS was based on colony morphology, beta-hemolysis, bacitracin susceptibility (Taxo A discs), and the latex agglutination test (Oxoid, Basingstoke, Hampshire, United Kingdom). All reagents and media were purchased from BBL (Becton, Dickinson Microbiology Systems, Sparks, MD), unless specified otherwise.
Antimicrobial susceptibility tests.
MICs for all GAS isolates were determined by broth microdilution (BMD) using Sensititre standard panels (Trek Diagnostics, West Essex, England). Mueller-Hinton broth supplemented with 5% lysed horse blood was used, and the testing conditions followed the recommendations of the Clinical and Laboratory Standards Institute (19). The agents tested included ceftriaxone, cefotaxime, cefepime, erythromycin, levofloxacin, linezolid, penicillin, tetracycline, and vancomycin. Clindamycin and tigecycline were also tested by BMD for the TSAR VII (2010) isolates. In addition, the clindamycin, ERY, and TCY MICs of the ERY-resistant (ERYr) GAS isolates were further determined using in-house-prepared BMD panels at 0.12 to 256 μg/ml. Results were interpreted using the CLSI breakpoints for all drugs except tigecycline, for which the EUCAST breakpoints (for Streptococcus groups A, B, C, and G) were used (http://www.eucast.org/clinical_breakpoints).
Determination of macrolide resistance phenotypes and ERY and TCY resistance genes.
The clindamycin-susceptible ERYr isolates were classified as having the M or iMLSB phenotype by D test according to CLSI recommendations (19). Isolates that were resistant to both clindamycin and ERY were classified as having the cMLSB phenotype. The presence of mef(A), erm(B), and erm(TR) genes for ERY resistance was determined for the ERYr isolates. The presence of the tet(M) and tet(O) genes for TCY resistance was determined for all ERYr isolates and 128 ERY-susceptible (ERYs) isolates. The ERYs isolates were randomly selected to include 12 to 21 isolates from each year. Resistance genes were checked by PCR using published primers (12).
emm typing.
All ERYr GAS isolates (127 isolates) as well as the 128 ERYs isolates were studied for emm typing following the protocol published on the Centers for Disease Control and Prevention (CDC) International Streptococcal Reference Laboratory website (http://www.cdc.gov/ncidod/biotech/strep/protocol_emm-type.htm). The sequences of the emm genes were compared with those in the CDC database by BLAST analysis (http://www.cdc.gov/ncidod/biotech/strep/strepblast.htm).
PFGE.
Genomic DNAs of the ERYr isolates were prepared and digested with 30 U SmaI (New England BioLabs Inc., Ipswich, MA) at 25°C for 16 to 18 h following a previously published protocol with slight modifications (20). Because some isolates could not be digested by SmaI, all isolates were also digested by 18 U SgrAI at 37°C for 6 h (20). The enzyme-digested DNA fragments were separated in 0.5× Tris-borate-EDTA (TBE; pH 7.5) buffer at 14°C for 22 h at a voltage of 6 V/cm and a fixed angle of 120° with pulse times ranging from 5 to 40 s with a CHEF Mapper system (Bio-Rad Laboratories, Richmond, CA). The DNA bands were stained by ethidium bromide and photographed, and the DNA patterns were analyzed using BioNumerics software (version 5.1; Applied Maths, Saint-Martens-Latem, Belgium). Staphylococcus aureus NCTC8325 was used as a standard for DNA pattern normalization. Isolates having >80% similarity were assigned a PFGE cluster code if there were 3 or more isolates within the cluster.
MLST.
MLST was performed on selected ERYr isolates and included nearly every emm type and PFGE cluster. MLST was performed according to the protocol on the MLST website (http://spyogenes.mlst.net/misc/info.asp). The primers of 7 housekeeping genes, gki, gtr, muri, mutS, recP, xpt, and yiqL, were based on information from the MLST website (21). The allele and sequence type (ST) were assigned by using the MLST websites (http://spyogenes.mlst.net/sql/allelicprofile_choice.asp and http://spyogenes.mlst.net/sql/singlelocus.asp).
Statistical analysis.
Antimicrobial susceptibility data analyses were made using WHONET software (22). Univariate analysis was done using the chi-square test or Fisher's exact test (if the number was less than 10). Multivariable logistic regression analysis was performed to assess the relationship between predictor variables (study period, patient age group, and specimen type) among ERYr and ERYs GAS isolates. The variables included those identified in the univariate analysis as possibly being associated with the ERY resistance rate (P < 0.05). All analyses were performed using SPSS statistics (version 17.0) software (SPSS, Chicago, IL). A P value of <0.05 was considered statistically significant.
RESULTS
GAS isolates.
A total of 776 GAS isolates were collected between 1998 and 2010 biennially, including 42, 39, 70, 177, 186, 167, and 95 isolates in 1998, 2000, 2002, 2004, 2006, 2008, and 2010, respectively. The majority of the isolates were from abscess/pus (n = 359, 46.3%), followed by the respiratory tract (n = 257, 33.1%), of which most were throat swab (n = 208, 26.8% of the total) and blood (n = 136, 17.5%) specimens. The remaining 24 isolates (3.1%) were from other specimen sources. For the 715 isolates for which patient ages were known, the mean age of the patients was 38.2 ± 27.6 years, and 253 of the 715 isolates (35.3%) were from pediatric patients (age, ≤18 years). The majority of the pediatric isolates (205/253, 81%) were from respiratory specimens, but only 8.5% (43/508) of the adult isolates were. Most adult isolates were from abscess/pus (65.7%, 334/508) and blood (25.8%, 131/508).
Antimicrobial susceptibilities and factors associated with ERY resistance.
The overall in vitro activities of 7 agents tested against all 776 GAS isolates are shown in Table 1. The results for clindamycin and tigecycline tested on the 95 isolates in 2010 are also shown. No resistance to ceftriaxone, levofloxacin, linezolid, penicillin, tigecycline, or vancomycin was seen. There were 3 clindamycin-susceptible, erythromycin-resistant isolates in TSAR VII (2010), and none were D-test positive, so the overall rate of clindamycin resistance was 2.1%. Overall rates of resistance to erythromycin and tetracycline were 16.4% and 63.8%, respectively. However, the overall rate of tetracycline resistance was higher in ERYr isolates (90.6%, 115/127) than ERYs isolates (77.0%, 500/649) (P < 0.001).
TABLE 1.
Antimicrobial susceptibilities of GAS isolates from the TSAR program from periods I (1998) to VII (2010)
| Agent | 1998–2010 overall (n = 776) |
% resistant |
||||||
|---|---|---|---|---|---|---|---|---|
| No. of isolates | MIC (μg/ml) |
% susceptible | % resistant | 1998 and 2000 (n = 81) | 2002 and 2004 (n = 247) | 2006 to 2010 (n = 448) | ||
| 50% | 90% | |||||||
| Ceftraixonea | 776 | ≤0.06 | 0.12 | 100 | ||||
| Clindamycinb | 95 | ≤0.12 | ≤0.12 | 97.8 | 2.1 | |||
| Erythromycin | 776 | ≤0.25 | >2 | 83.3 | 16.5 | 53.1 | 14.6 | 10.7 |
| Levofloxacin | 776 | 1 | 1 | 100 | ||||
| Linezolid | 776 | 1 | 2 | 100 | ||||
| Penicillin | 776 | ≤0.03 | ≤0.03 | 100 | ||||
| Tetracycline | 776 | >8 | >8 | 36.1 | 63.6 | 60.5 | 65.6 | 63.4 |
| Tigecyclineb,c | 95 | 0.03 | 0.06 | 100 | ||||
| Vancomycin | 776 | ≤0.05 | ≤0.05 | 100 | ||||
Cefotaxime and cefepime were also tested, and all isolates were susceptible. Only ceftriaxone data are shown.
Clindamycin and tigecycline were not included in the panels used before TSAR VII (2010).
Breakpoints for tigecycline are based on EUCAST criteria: susceptible, MIC ≤ 0.25 μg/ml; resistant, MIC ≥ 0.5 μg/ml.
To identify factors associated with ERY resistance in GAS, we grouped the isolates into three time points, those recovered in 1998 and 2000, 2002 and 2004, and 2006 to 2010, to represent isolates from the period before 2001, isolates from the periods after 2001, and contemporary isolates, respectively. The rate of ERY resistance was 53.1% in 1998 and 2000, but it declined to 14.6% in 2002 and 2004 and 10.7% in 2006 to 2010 (P < 0.01). Although significant decreases occurred in all specimen types, they were more pronounced in nonrespiratory isolates (1998 and 2000, 57.6% [19/33]; 2002 and 2004, 11.1% [19/171]; 2006 and 2010, 6.3% [19/315]) than respiratory isolates (1998 and 2000, 50% [24/48]; 2002 and 2004, 22.4% [17/76]; 2006 and 2010, 21.8% [29/133]; P < 0.01). Univariate analysis indicated that study period, age, and specimen types were possible factors associated with ERYr GAS (P < 0.01). Multivariate analysis revealed that isolation from the respiratory tract (P < 0.05) and recovery before 2001 (P < 0.001) remained independent factors associated with ERY resistance (Table 2).
TABLE 2.
Factors associated with ERYr GAS in Taiwan
| Factor (no. of isolates) | % of isolatesa |
Pb | ORc | 95% CId | Pe | |
|---|---|---|---|---|---|---|
| ERYs | ERYr | |||||
| Study periodf | ||||||
| 1998 and 2000 (81) | 38 (46.9) | 43 (53.1) | <0.001i | Reference | ||
| 2002 and 2004 (247) | 211 (85.4) | 36 (14.6) | 0.357 | 0.206 | 0.115–0.372 | <0.001 |
| 2006 to 2010 (448) | 400 (89.3) | 48 (10.7) | <0.001 | 0.138 | 0.08–0.241 | <0.001 |
| Ageg | ||||||
| Adult (508) | 444 (87.4) | 64 (12.6) | <0.001 | Reference | ||
| Pediatric (253) | 191 (75.5) | 62 (24.5) | <0.001 | 1.053 | 0.573–1.935 | 0.867 |
| Specimen type | ||||||
| Abscess/pus (359) | 315 (87.7) | 44 (12.3) | 0.004 | Reference | ||
| Blood (136) | 126 (92.6) | 10 (7.4) | 0.002 | 0.570 | 0.273–1.193 | 0.136 |
| Respiratory (257)h | 187 (72.8) | 70 (27.2) | <0.001 | 2.092 | 1.129–3.876 | 0.019 |
The percentages shown are the rates of susceptibility or resistance for isolates in the subgroup.
P value by the chi-square test.
OR, odds ratio.
CI, confidence interval.
P value by multivariate logistic regression analysis.
The periods correspond to 7 rounds of TSAR conducted biennially from 1998 to 2010.
The age group of 17 patients was unknown.
Including 208 throat swab specimens.
Boldface indicates a statistically significant difference.
Phenotype and resistance determinants of ERYr GAS.
The resistance phenotypes, ERY and TCY resistance genes, and emm types are shown in Table 3. Among the 127 ERYr GAS isolates, 93 were clindamycin susceptible, and 90 of those isolates (70.9%) had the M phenotype and only 3 (2.4%) had the iMLSB phenotype. The other 34 (26.8%) isolates were cMLSB. These cMLSB isolates had the highest ERY MIC (MIC50 and MIC90, ≥256 μg/ml) when they were compared to the M-phenotype isolates (MIC50 and MIC90, 8 μg/ml), while the 3 iMLSB isolates had lower ERY MICs (2 to 4 μg/ml). All cMLSB isolates had clindamycin MICs of ≥256 μg/ml. The clindamycin MICs of all the M-phenotype and iMLSB isolates were ≤0.12 μg/ml. All but one of the M-phenotype isolates carried mef(A) (98.9%, 89/90), while erm(B) was the major ERY resistance gene in the cMLSB group (73.5%, 25/34), and all 3 iMLSB isolates had the erm(TR) gene (Table 3). The erm(TR) gene was also detected in the remaining 9 cMLSB group isolates. One isolate of the M phenotype was negative for mef(A), erm(B), and erm(TR). The tetracycline resistance genes tet(M) and tet(O) were detected in 75 (59.1%) and 40 (31.5%) of the ERYr isolates, respectively.
TABLE 3.
Genotype (ERY and TCY resistance genes and emm type) and phenotype of ERYr GAS from three study periods of TSAR
| Genotype | Phenotype (na) | 1998 and 2000 (n = 43) |
2002 and 2004 (n = 36) |
2006 to 2010 (n = 48) |
Total for 1998–2010 (n = 127) |
||||
|---|---|---|---|---|---|---|---|---|---|
| % of isolates | emm type(s) (n) | % of isolates | emm type(s) (n) | % of isolates | emm type(s) (n) | % of isolates | emm type(s) (n) | ||
| mef(A) tet(M) | M (51) | 23.3 | 53 (2), 58 (1), 81 (1), 103 (3), NTb (3) | 41.7 | 22 (5), 90 (1), 106 (8), NT (1) | 54.2 | 22 (22), 76 (1), 106 (3) | 40.2 | 22 (27), 53 (2), 58 (1), 76 (1), 81 (1), 90 (1), 103 (3), 106 (11), NT (4) |
| mef(A) tet(O) | M (29) | 37.2 | 4 (9), 22 (1), 82 (5), 89 (1) | 19.4 | 4 (8) | 10.4 | 4 (4), NT (1) | 22.8 | 4 (21), 22 (1), 82 (5), 89 (1), NT (1) |
| mef(A) erm(B) tet(M) | M (1) | 0 | 0 | 2.1 | 1 (1) | 0.8 | 1 (1) | ||
| mef(A) | M (8) | 11.6 | 12 (5) | 5.6 | 12 (2) | 2.1 | 57 (1) | 6.3 | 12 (7), 57 (1) |
| tet(M) | M (1) | 2.3 | 80 (1)c | 0 | 0 | 0.8 | 80 (1) | ||
| M phenotype total (90) | 74.4 | 69.4 | 68.8 | 70.9 | |||||
| erm(B) tet(M) | cMLSB (11) | 0 | 0 | 20.8 | 1 (2), 12 (4), 22 (4), 102 (1) | 8.7 | 1 (2), 12 (4), 22 (4), 102 (1) | ||
| erm(B) tet(O) | cMLSB (11) | 20.9 | 12 (9) | 5.6 | 12 (2) | 0 | 8.7 | 12 (11) | |
| erm(TR) tet(M) | cMLSB (8) | 2.3 | 27G (1) | 16.7 | 76 (1), 99 (1), 106 (4) | 2.1 | 28 (1) | 6.3 | 27G (1), 28 (1), 76 (1), 99 (1), 106 (4) |
| erm(B) | cMLSB (3) | 2.3 | 12 (1) | 2.8 | 12 (1) | 2.1 | 89 (1) | 2.4 | 12 (2), 89 (1) |
| erm(TR) | cMLSB (1) | 0 | 2.8 | 22 (1) | 0 | 0.8 | 22 (1) | ||
| cMLSB phenotype total (34) | 25.6 | 27.9 | 27.1 | 26.8 | |||||
| erm(TR) tet(M) | iMLSB (3) | 2.8 | 99 (1) | 4.2 | 75 (1), NT (1) | 2.4 | 75 (1), 99 (1), NT (1) | ||
n, number of isolates.
NT, non-emm typeable.
The isolate was negative for erm(B), erm(TR), and mef(A). Its ERY MIC was 2 μg/ml, and it is possible that the isolate carried one of the mef subclass genes (36), which were not evaluated in the present study.
The distribution of the M-phenotype and cMLSB isolates remained similar over the study years, with 74.4%, 69.4%, and 68.8% of the ERYr isolates from 1998 and 2000, 2002 and 2004, and 2006 to 2010, respectively, having the M phenotype, while isolates of the cMLSB phenotype comprised about 25% of the isolates from each time period (Table 3). A total of 115 (90.6%) of the 127 ERYr isolates were TCY resistant (TCYr), and these comprised 90.0% (80/89), 88.8% (22/25), and 100% (12/12) of mef(A)-, erm(B)-, and erm(TR)-positive GAS isolates, respectively. Among these 115 ERYr and TCYr isolates, 40 carried tet(O), 73 carried tet(M), and 2 were negative for tet(O) and tet(M). However, tet(O) isolates predominated in 1998 and 2000 (58.1%, 25/43) but decreased to 27.8% (10/36) in 2002 and 2004 and 10.4% (5/48) in 2006 to 2010 (P < 0.001). Conversely, the proportions of isolates carrying tet(M) increased from 27.9% (12/43) in 1998 and 2000 to 61.1% (22/36) in 2002 and 2004 and 85.4% (41/48) in 2006 to 2010 (Table 3).
emm types in ERYr and ERYs GAS.
To determine if certain emm types predominated in ERYr and ERYs isolates or in isolates from a particular source, emm typing was performed on all 127 ERYr isolates and 128 randomly selected ERYs isolates. These 255 GAS isolates included 109 (42.7%) from the respiratory tract, 80 (31.4%) from abscess/pus, 54 (21.2%) from blood, and 12 (4.7%) from other specimen sources. There were 20 emm types among the ERYr GAS isolates (Table 3) and 22 emm types among the ERYs GAS isolates (data not shown). The predominant emm types in ERYr isolates were emm22 (n = 33, 26.0%), emm12 (n = 24, 18.9%), emm4 (n = 21, 16.5%), and emm106 (n = 15, 11.8%). In ERYs isolates, emm12 (n = 27, 21.9%), emm1 (n = 18, 14.1%), emm106 (n = 16, 12.5%), and emm11 (n = 9, 7.1%) predominated, followed by emm types 4, 49, 81, and 132 (each with 6 isolates, 4.7%). Together, emm12 (n = 51, 20%), emm22 (n = 33, 12.9%), emm106 (n = 31, 12.2%), emm4 (n = 27, 10.5%), emm1 (n = 21, 8.2%), and emm11 (n = 9, 3.5%) accounted for 67.3% of total isolates.
The emm1 and emm11 isolates were significantly associated with ERYs GAS and being from respiratory samples (P < 0.05), while emm4 and emm22 were significantly associated with ERYr GAS, with emm22 being found only in ERYr isolates (Table 3 and Fig. 1). Among the ERYr isolates, emm4, emm22, and emm106 mostly had the M phenotype, while the cMLSB phenotype predominated in emm12 GAS (Table 3). Although the emm12 and emm106 types were each found in similarly high percentages of the ERYs and ERYr isolates (Fig. 1), emm12 was strongly associated with isolates from the respiratory tract (P < 0.001) (the majority of which were from throat swab specimens), while emm106 was highly associated with abscess/pus isolates (P < 0.001) (Fig. 2).
FIG 1.
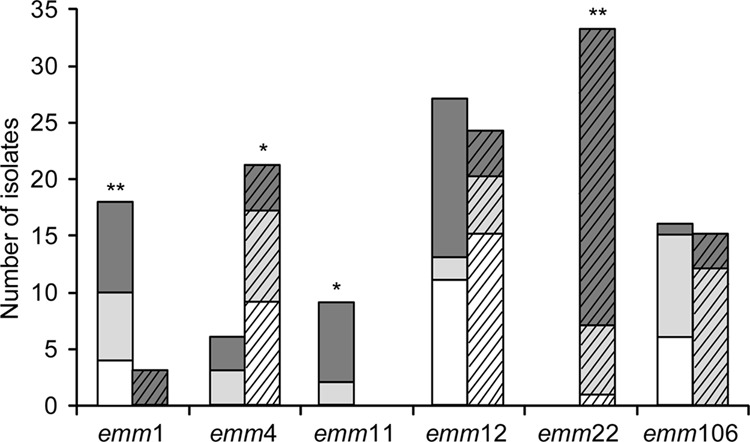
Distribution of the 6 most prevalent emm types among ERYs (n = 76; bars without angled lines) and ERYr (n = 96; bars with angled lines) GAS isolates by collection period. White bars, 1998 and 2000; light gray bars, 2002 and 2004; dark gray bars, 2006 to 2010. Significant differences between the proportions of ERYs and ERYr isolates within each emm type are indicated (χ2 analysis; *, P < 0.01; **, P < 0.001).
FIG 2.
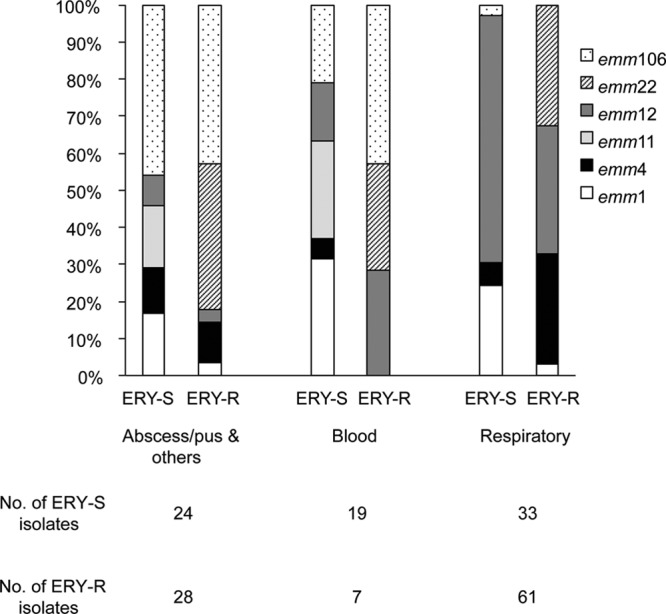
Proportions of the 6 most prevalent emm types in GAS by specimen source.
PFGE, emm, and MLST of ERYr GAS.
PFGE was first performed on all 127 ERYr GAS isolates using SmaI. However, 24 isolates could not be digested by SmaI but could be digested using SgrAI. Therefore, all isolates were digested using SgrAI for subsequent comparison. Most (n = 102) of the 127 SgrAI-digested ERYr GAS isolates could be assigned to 9 PFGE clusters (A [32 isolates, 25.2%], B [12 isolates, 9.4%], C [20 isolates, 15.7%], D [13 isolates, 10.2%], E [5 isolates, 3.9%], F [3 isolates, 2.3%], G [8 isolates, 6.3%], H [5 isolates, 3.9%], and I [4 isolates, 3.1%]) (Fig. 3). Most of the 24 SmaI-indigestible SgrAI-digested isolates were either PFGE cluster D (13 isolates) or G (6 isolates). MLST was performed on nearly all emm types and representative isolates from each PFGE cluster. A total of 52 GAS isolates were selected for MLST. Most GAS isolates within the same PFGE cluster had the same emm type and ST or its single-locus variants (SLVs). The genotype (emm-ST) of the predominant PFGE cluster A isolates was emm22-ST46, while cluster C isolates were emm4-ST39 or its SLV, ST423. The predominant genotypes of clusters D and E were emm106-ST674 and emm82-ST665 or its SVL, ST666, respectively. Cluster H isolates comprised the emm76-ST673 and emm106-ST673 genotypes. Isolates of the same genotype mostly fell within the same PFGE cluster, except emm12-ST36 (or its SLV669), which belonged to distinct clusters, B, G, and I (Fig. 3).
FIG 3.

Dendrogram showing PFGE of ERYr GAS isolates digested by SgrAI. Their corresponding erythromycin resistance phenotype, emm type, isolation year, and STs are also listed. a, isolates having >80% similarity were assigned to a PFGE cluster (A to I) if there were 3 or more isolates within the cluster, and O (other) indicates that no cluster code was assigned; (n), number of isolates having the same PFGE pattern; b, number of isolates from different study periods (I, 1998 and 2000; II, 2002 and 2004; III, 2006 and 2010); c, NT, non-emm typeable; d, MLST, multilocus sequence typing; (n), number of isolates on which MLST was performed; SLV, single-locus variant.
The emm22-ST46 lineage (PFGE cluster A) was rarely found before 2000 but became the most prevalent emm type from 2006 to 2010. The emm12-ST36 isolates from earlier years (1998 to 2004) belonged to PFGE clusters B and G but shifted to cluster I from 2006 to 2010. The emm4-ST39 (PFGE cluster C) isolates were present mostly in earlier years (1998 to 2004). The majority of emm106 isolates (PFGE clusters D and H) were present in 2004 and 2006, and those that could not be digested by SmaI (PFGE cluster D) had a new sequence type, ST674. In addition to ST674, two new sequence types, ST672 and ST673, were identified in emm106 (PFGE cluster H). These results suggest that changes in emm type distribution and the emergence of new genotypes occurred over the years.
DISCUSSION
Before 2000, ERY was widely used for treating upper respiratory tract infections, which resulted in remarkably high rates of ERY resistance in GAS in Taiwan (8, 23). In an effort to contain antimicrobial resistance, the government implemented a policy in 2001 to restrict antibiotic use for acute upper respiratory tract infections in outpatients (16). The effect of this policy on resistance in GAS has been reported in studies on isolates from different regions of Taiwan (8). However, multicenter longitudinal data are lacking.
Data from our Taiwan Surveillance of Antimicrobial Resistance (TSAR) conducted biennially between 1998 and 2010 showed that ERY resistance declined from 53.1% in 1998 and 2000 to 14.6% in 2002 and 2004 and 10.7% from 2006 to 2010, indicating that the rate of ERY resistance in GAS remained stable after 2001. Using isolates from the TSAR collection, we first determined the ERY resistance phenotype and genes of the ERYr isolates and found that isolates of the mef(A)-carrying M phenotype predominated, followed by erm(B)-carrying cMLSB isolates. In an earlier study of ERYr GAS from a medical center in southern Taiwan, cMLSB was the prevalent phenotype in isolates recovered from 1992 to 1995, but the M phenotype became predominant after 1997 (23). The predominance of the M phenotype in the present study is consistent with the decreasing rate of ERY resistance among GAS isolates in Taiwan after 1998.
Based on emm typing, PFGE, and MLST data, we found diverse genotypes of ERYr GAS circulating in Taiwan, with four major clones predominating: emm22-ST46 (PFGE cluster A), emm12-ST36 (PFGE clusters B, G, and I), emm4-ST39 (PFGE cluster C), and emm106-ST674 (PFGE cluster D). The emm4-ST39 isolates were mostly found in early years (1998 to 2004), and isolates of this lineage were replaced by emm22-ST46 isolates from 2006 onward. The emm12-ST36 isolates belonging to the PFGE B and G clusters were mostly found from 1998 to 2004, but the PFGE cluster changed to cluster I during the period from 2006 to 2010, although the predominate phenotype in these isolates remained cMLSB. The emm106-ST673 isolates present in 2004 and 2006 belonged to PFGE cluster H, but a few changed to emm106-ST674, which belonged to PFGE cluster D, in later years. The emm106-ST674 isolates are unique in Taiwan since ST674 is a new sequence type. Taken together, these results suggest that emm type changes in ERYr GAS occurred over the years. We also found not only that the PFGE cluster correlated well with the emm and sequence types but also that the same emm type can have distinct PFGE clusters, so PFGE provides better genotype distinctions. The higher discriminatory power of PFGE has been reported previously (20).
Globally, the distribution and rank order of emm types in GAS varied by region and between countries. For example, emm1, emm12, emm28, emm3, and emm4 predominated in Western countries, but only two of those emm types, emm12 and emm1, were among the top 6 emm types in Africa (4). The predominant emm types in our study were emm12, emm22, emm106, emm4, emm1, and emm11, but their distribution differed by year, specimen type, and ERY susceptibility. Studies in Canada and Portugal on GAS from pharyngitis patients found that emm1, emm4, and emm12 predominated, although the rank order differed (5, 24). Three studies on invasive GAS, one from France, one from 11 European countries, and the other from the United States, also found emm1 to be the leading emm type among invasive GAS isolates (25–27). Previous studies from Taiwan have also found emm1, emm4, emm12, and emm11 to be among the prevalent emm types, but their proportions varied in different disease entities and populations (28–30). However, emm28, a leading emm type in Western countries associated with ERY-resistant GAS (5, 25, 26, 31), was detected in only one of the ERYr isolates in the present study.
Our study found that emm1 and emm11 isolates are associated with ERY susceptibility in GAS. A higher degree of association of emm1 with ERY-susceptible GAS has been reported in Greece and Portugal (5, 32). We also found a strong association of emm22 isolates with ERY resistance. The emm22 type has been reported in only a few countries and at a much lower prevalence (5, 27, 31, 32). The reason for the lower prevalence of emm22 in other regions might be because emm22 is usually associated with ERY resistance (5, 32, 33). Of note, emm22 was detected only in ERYr isolates in the present study. Its prevalence also increased in 2002 and 2004, and it became the predominant emm type of ERYr isolates from 2006 to 2010. An increased incidence of ERYr emm22 infections from 2005 to 2008 was also noted in Hong Kong (33), indicating a possible increasing regional prevalence of this emm type.
Another prevalent emm type in our collection was emm106. Other than one study which reported that emm106 was one of the prevalent emm types in invasive GAS in New Caledonia (34), this emm type has not been reported in other countries. However, two studies in Taiwan found emm106 to be highly associated with invasive skin and soft tissue infections (28, 30). Although we do not have information on the disease manifestations, we did find a strong association of emm106 with abscess/pus isolates. Also noteworthy is that the emm106 ERYr isolates belonged to three new sequence types, ST672, ST673, and ST674. ST672 is a single-locus variant of ST46 and a four-locus variant of ST673, but ST674 is a distinct new sequence type. ST672 and ST673 shared the same PFGE cluster. One characteristic of the emm106-ST674 isolates is that they could be digested only by SgrAI for PFGE typing, and these isolates shared an indistinguishable PFGE pattern. The clinical prevalence and epidemiology of this emm type in Taiwan warrant further study.
Univariate analysis revealed that isolates recovered before 2001, from pediatric patients, and from respiratory specimens were significantly associated with ERY resistance. Because the majority (>85%) of the pediatric isolates were from the respiratory tract, this accounted for the higher rate of ERY resistance in pediatric patients. Multivariate analysis revealed that recovery from earlier years and a respiratory origin of the isolates remained independent factors associated with ERY resistance. The lowered ERY resistance of GAS after 2000 likely resulted from the decreased macrolide use in outpatients (8, 16). Since most respiratory specimens were throat swab samples, this implied that pharyngitis isolates have higher rates of ERY resistance. In an earlier study, Seppala et al. also found younger age and isolation from the throat to be predictors for ERY resistance in GAS (35). The reason for the higher prevalence of ERY resistance in respiratory (throat swab) isolates is likely contributed by emm4 and emm22 isolates, since these lineages are associated with ERY resistance and comprised the largest proportions of respiratory isolates.
In conclusion, a significant decrease in the incidence of ERY resistance in GAS isolates occurred after 2000 in Taiwan and was accompanied by changes in the genotypes of ERYr GAS. Isolates of emm12-ST36 having the cMLSB phenotype decreased, while emm22-ST46 isolates having the M phenotype have become predominant in recent years. The association of certain emm types with ERY susceptibility (emm1 and emm11) and resistance (emm22) was observed. In addition, certain emm types were associated with specimen origin, including emm12 with respiratory (throat swab) specimens and emm106 with abscess/pus, indicating possible tissue tropism. We also detected new sequence types in ERYr GAS, emm106-ST673 and emm106-674. These results indicate the need for periodic monitoring of GAS epidemiology in each region to detect changes in distribution and the emergence of new sequence types.
ACKNOWLEDGMENTS
We thank the following hospitals (in alphabetical order) for participating in the Taiwan Surveillance of Antimicrobial Resistance (TSAR) program: in the northern region, Cathay General Hospital (TSAR I to VII), Cheng Hsin General Hospital (TSAR I), Far Eastern Memorial Hospital (TSAR III to VII), Keelung Chang Gung Memorial Hospital of the Chang Gung Medical Foundation (TSAR I), Koo Foundation Sun Yat-sen Cancer Center (TSAR I), Linkou Chang Gung Memorial Hospital of the Chang Gung Medical Foundation (TSAR I and II), Lo-Hsu Foundation Inc.-Lo-Tung Poh-Ai Hospital (TSAR I to VII), Min-Sheng Healthcare (TSAR I to VII), National Taiwan University Hospital (TSAR I), National Taiwan University Hospital Hsin-Chu Branch (TSAR I), Saint Mary's Hospital Luodong (TSAR I and III to VII), Taipei City Hospital Heping Fuyou Branch (TSAR II to VII), Taipei City Hospital Yangming Branch (TSAR I), Taipei City Hospital Zhongxiao Branch (TSAR I to VII), Taipei City Hospital Zhongxing Branch (TSAR I), Taipei Hospital-Ministry of Health and Welfare (TSAR I), Taipei Medical University Hospital (TSAR I and II), Taipei Medical University-Municipal Wan Fang Hospital (TSAR I), Taiwan Adventist Hospital (TSAR I), Tao Yuan General Hospital-Ministry of Health and Welfare (TSAR I), Tri-Service General Hospital (TSAR I to IV, VI, and VII), and Tri-Service General Hospital Songshan Branch (TSAR I); in the central region, Chang-Hwa Christian Hospital (TSAR I to VII), Cheng Ching Hospital (TSAR I and III to VII), China Medical University Hospital (TSAR I), Chung Shan Medical University Hospital (TSAR I to VII), Kuan-Tien General Hospital (TSAR I to VII), Shalu Tung's Memorial Hospital (TSAR I and III to VII), Show Chwan Memorial Hospital (TSAR I and III to VII), Taichung Hospital-Ministry of Health and Welfare (TSAR II), Taichung Veterans General Hospital (TSAR I to VII), and Zen Ai General Hospital (TSAR I and III to VII); in the southern region, Chi Mei Medical Center (TSAR I), Ditmanson Medical Foundation Chia-Yi Christian Hospital (TSAR I to VII), God's Help Hospital (TSAR I), Jen Ai General Hospital (TSAR I), Kaohsiung Armed Forces General Hospital (TSAR I to VII), Kaohsiung Chang Gung Memorial Hospital of the Chang Gung Medical Foundation (TSAR I to VII), Kaohsiung Medical University Chung-Ho Memorial Hospital (TSAR I to VII), Kaohsiung Veterans General Hospital (TSAR I to VII), National Cheng Kung University Hospital (TSAR III to VII), Sin-Lau Medical Foundation-the Presbyterian Church in Taiwan (TSAR II to VII), St. Martin De Porres Hospital (TSAR I), Tainan Municipal Hospital (TSAR I), and Yuan's General Hospital (TSAR I); and in the eastern region, Hualien Hospital-Ministry of Health and Welfare (TSAR I to VII), Hualien Tzu Chi Hospital-Buddhist Tzu Chi Medical Foundation (TSAR I and III to VII), Mackay Memorial Hospital Taitung Branch (TSAR I), and Mennonite Church Hospital (TSAR I to VII).
This project was supported by intramural grants from the National Health Research Institutes (NHRI; IV-102-PP-01 and IV-101-SP-11).
Footnotes
Published ahead of print 4 December 2013
REFERENCES
- 1.Bisno AL, Brito MO, Collins CM. 2003. Molecular basis of group A streptococcal virulence. Lancet Infect. Dis. 3:191–200. 10.1016/S1473-3099(03)00576-0 [DOI] [PubMed] [Google Scholar]
- 2.Carapetis JR, Steer AC, Mulholland EK, Weber M. 2005. The global burden of group A streptococcal diseases. Lancet Infect. Dis. 5:685–694. 10.1016/S1473-3099(05)70267-X [DOI] [PubMed] [Google Scholar]
- 3.Beall B, Facklam R, Thompson T. 1996. Sequencing emm-specific PCR products for routine and accurate typing of group A streptococci. J. Clin. Microbiol. 34:953–958 [DOI] [PMC free article] [PubMed] [Google Scholar]
- 4.Steer AC, Law I, Matatolu L, Beall BW, Carapetis JR. 2009. Global emm type distribution of group A streptococci: systematic review and implications for vaccine development. Lancet Infect. Dis. 9:611–616. 10.1016/S1473-3099(09)70178-1 [DOI] [PubMed] [Google Scholar]
- 5.Silva-Costa C, Friães A, Ramirez M, Melo-Cristino J, Portuguese Group for the Study of Streptococcal Infections 2012. Differences between macrolide-resistant and -susceptible Streptococcus pyogenes: importance of clonal properties in addition to antibiotic consumption. Antimicrob. Agents Chemother. 56:5661–5666. 10.1128/AAC.01133-12 [DOI] [PMC free article] [PubMed] [Google Scholar]
- 6.Shulman ST, Bisno AL, Clegg HW, Gerber MA, Kaplan EL, Lee G, Martin JM, Van Beneden C. 2012. Clinical practice guideline for the diagnosis and management of group A streptococcal pharyngitis: 2012 update by the Infectious Diseases Society of America. Clin. Infect. Dis. 55:1279–1282. 10.1093/cid/cis847 [DOI] [PubMed] [Google Scholar]
- 7.Bingen E, Bidet P, Mihaila-Amrouche L, Doit C, Forcet S, Brahimi N, Bouvet A, Cohen R. 2004. Emergence of macrolide-resistant Streptococcus pyogenes strains in French children. Antimicrob. Agents Chemother. 48:3559-3562. 10.1128/AAC.48.9.3559-3562.2004 [DOI] [PMC free article] [PubMed] [Google Scholar]
- 8.Hsueh PR, Shyr JM, Wu JJ. 2005. Decreased erythromycin use after antimicrobial reimbursement restriction for undocumented bacterial upper respiratory tract infections significantly reduced erythromycin resistance in Streptococcus pyogenes in Taiwan. Clin. Infect. Dis. 40:903–905. 10.1086/427946 [DOI] [PubMed] [Google Scholar]
- 9.Bergman M, Huikko S, Pihlajamaki M, Laippala P, Palva E, Huovinen P, Seppala H. 2004. Effect of macrolide consumption on erythromycin resistance in Streptococcus pyogenes in Finland in 1997-2001. Clin. Infect. Dis. 38:1251–1256. 10.1086/383309 [DOI] [PubMed] [Google Scholar]
- 10.d'Humieres C, Cohen R, Levy C, Bidet P, Thollot F, Wollner A, Bingen E. 2012. Decline in macrolide-resistant Streptococcus pyogenes isolates from French children. Int. J. Med. Microbiol. 302:300–303. 10.1016/j.ijmm.2012.09.001 [DOI] [PubMed] [Google Scholar]
- 11.Van Heirstraeten L, Coenen S, Lammens C, Hens N, Goossens H, Malhotra-Kumar S. 2012. Antimicrobial drug use and macrolide-resistant Streptococcus pyogenes, Belgium. Emerg. Infect. Dis. 18:1515–1518. 10.3201/eid1809.120049 [DOI] [PMC free article] [PubMed] [Google Scholar]
- 12.Giovanetti E, Brenciani A, Lupidi R, Roberts MC, Varaldo PE. 2003. Presence of the tet(O) gene in erythromycin- and tetracycline-resistant strains of Streptococcus pyogenes and linkage with either the mef(A) or the erm(A) gene. Antimicrob. Agents Chemother. 47:2844–2849. 10.1128/AAC.47.9.2844-2849.2003 [DOI] [PMC free article] [PubMed] [Google Scholar]
- 13.Seppala H, Skurnik M, Soini H, Roberts MC, Huovinen P. 1998. A novel erythromycin resistance methylase gene (ermTR) in Streptococcus pyogenes. Antimicrob. Agents Chemother. 42:257–262. 10.1093/jac/42.2.257 [DOI] [PMC free article] [PubMed] [Google Scholar]
- 14.Ho M, McDonald LC, Lauderdale TL, Yeh LL, Chen PC, Shiau YR. 1999. Surveillance of antibiotic resistance in Taiwan, 1998. J. Microbiol. Immunol. Infect. 32:239–249 [PubMed] [Google Scholar]
- 15.Hsueh PR, Chen HM, Huang AH, Wu JJ. 1995. Decreased activity of erythromycin against Streptococcus pyogenes in Taiwan. Antimicrob. Agents Chemother. 39:2239–2242. 10.1128/AAC.39.10.2239 [DOI] [PMC free article] [PubMed] [Google Scholar]
- 16.Ho M, Hsiung CA, Yu HT, Chi CL, Chang HJ. 2004. Changes before and after a policy to restrict antimicrobial usage in upper respiratory infections in Taiwan. Int. J. Antimicrob. Agents 23:438–445. 10.1016/j.ijantimicag.2003.10.013 [DOI] [PubMed] [Google Scholar]
- 17.Chen FJ, Huang IW, Wang CH, Chen PC, Wang HY, Lai JF, Shiau YR, Lauderdale TL. 2012. mecA-positive Staphylococcus aureus with low-level oxacillin MIC in Taiwan. J. Clin. Microbiol. 50:1679–1683. 10.1128/JCM.06711-11 [DOI] [PMC free article] [PubMed] [Google Scholar]
- 18.McDonald LC, Lauderdale TL, Shiau YR, Chen PC, Lai JF, Wang HY, Ho M. 2004. The status of antimicrobial resistance in Taiwan among Gram-positive pathogens: the Taiwan Surveillance of Antimicrobial Resistance (TSAR) programme, 2000. Int. J. Antimicrob. Agents 23:362–370. 10.1016/j.ijantimicag.2003.09.021 [DOI] [PubMed] [Google Scholar]
- 19.Clinical and Laboratory Standards Institute 2012. Performance standards for antimicrobial susceptibility testing: 22nd informational supplement M100-S22. Clinical and Laboratory Standards Institute, Wayne, PA [Google Scholar]
- 20.Chiou CS, Liao TL, Wang TH, Chang HL, Liao JC, Li CC. 2004. Epidemiology and molecular characterization of Streptococcus pyogenes recovered from scarlet fever patients in central Taiwan from 1996 to 1999. J. Clin. Microbiol. 42:3998–4006. 10.1128/JCM.42.9.3998-4006.2004 [DOI] [PMC free article] [PubMed] [Google Scholar]
- 21.Enright MC, Spratt BG, Kalia A, Cross JH, Bessen DE. 2001. Multilocus sequence typing of Streptococcus pyogenes and the relationships between emm type and clone. Infect. Immun. 69:2416–2427. 10.1128/IAI.69.4.2416-2427.2001 [DOI] [PMC free article] [PubMed] [Google Scholar]
- 22.O'Brien TF, Stelling J. 2011. Integrated multilevel surveillance of the world's infecting microbes and their resistance to antimicrobial agents. Clin. Microbiol. Rev. 24:281–295. 10.1128/CMR.00021-10 [DOI] [PMC free article] [PubMed] [Google Scholar]
- 23.Yan JJ, Wu HM, Huang AH, Fu HM, Lee CT, Wu JJ. 2000. Prevalence of polyclonal mefA-containing isolates among erythromycin-resistant group A streptococci in southern Taiwan. J. Clin. Microbiol. 38:2475–2479 [DOI] [PMC free article] [PubMed] [Google Scholar]
- 24.Shea PR, Ewbank AL, Gonzalez-Lugo JH, Martagon-Rosado AJ, Martinez-Gutierrez JC, Rehman HA, Serrano-Gonzalez M, Fittipaldi N, Beres SB, Flores AR, Low DE, Willey BM, Musser JM. 2011. Group A Streptococcus emm gene types in pharyngeal isolates, Ontario, Canada, 2002-2010. Emerg. Infect. Dis. 17:2010–2017. 10.3201/eid1711.110159 [DOI] [PMC free article] [PubMed] [Google Scholar]
- 25.Lepoutre A, Doloy A, Bidet P, Leblond A, Perrocheau A, Bingen E, Trieu-Cuot P, Bouvet A, Poyart C, Levy-Bruhl D. 2011. Epidemiology of invasive Streptococcus pyogenes infections in France in 2007. J. Clin. Microbiol. 49:4094–4100. 10.1128/JCM.00070-11 [DOI] [PMC free article] [PubMed] [Google Scholar]
- 26.Luca-Harari B, Darenberg J, Neal S, Siljander T, Strakova L, Tanna A, Creti R, Ekelund K, Koliou M, Tassios PT, van der Linden M, Straut M, Vuopio-Varkila J, Bouvet A, Efstratiou A, Schalen C, Henriques-Normark B, Jasir A. 2009. Clinical and microbiological characteristics of severe Streptococcus pyogenes disease in Europe. J. Clin. Microbiol. 47:1155–1165. 10.1128/JCM.02155-08 [DOI] [PMC free article] [PubMed] [Google Scholar]
- 27.O'Loughlin RE, Roberson A, Cieslak PR, Lynfield R, Gershman K, Craig A, Albanese BA, Farley MM, Barrett NL, Spina NL, Beall B, Harrison LH, Reingold A, Van Beneden C. 2007. The epidemiology of invasive group A streptococcal infection and potential vaccine implications: United States, 2000-2004. Clin. Infect. Dis. 45:853–862. 10.1086/521264 [DOI] [PubMed] [Google Scholar]
- 28.Chiang-Ni C, Wu AB, Liu CC, Chen KT, Lin YS, Chuang WJ, Fang HY, Wu JJ. 2011. Emergence of uncommon emm types of Streptococcus pyogenes among adult patients in southern Taiwan. J. Microbiol. Immunol. Infect. 44:424–429. 10.1016/j.jmii.2011.04.005 [DOI] [PubMed] [Google Scholar]
- 29.Chiou C-S, Wang Y-W, Chen P-L, Wang W-L, Wu P-F, Wei H-L. 2009. Association of the shuffling of Streptococcus pyogenes clones and the fluctuation of scarlet fever cases between 2000 and 2006 in central Taiwan. BMC Microbiol. 9:115. 10.1186/1471-2180-9-115 [DOI] [PMC free article] [PubMed] [Google Scholar]
- 30.Lin JN, Chang LL, Lai CH, Lin HH, Chen YH. 2011. Clinical and molecular characteristics of invasive and noninvasive skin and soft tissue infections caused by group A Streptococcus. J. Clin. Microbiol. 49:3632–3637. 10.1128/JCM.00531-11 [DOI] [PMC free article] [PubMed] [Google Scholar]
- 31.Ardanuy C, Domenech A, Rolo D, Calatayud L, Tubau F, Ayats J, Martin R, Linares J. 2010. Molecular characterization of macrolide- and multidrug-resistant Streptococcus pyogenes isolated from adult patients in Barcelona, Spain (1993-2008). J. Antimicrob. Chemother. 65:634–643. 10.1093/jac/dkq006 [DOI] [PubMed] [Google Scholar]
- 32.Michos AG, Bakoula CG, Braoudaki M, Koutouzi FI, Roma ES, Pangalis A, Nikolopoulou G, Kirikou E, Syriopoulou VP. 2009. Macrolide resistance in Streptococcus pyogenes: prevalence, resistance determinants, and emm types. Diagn. Microbiol. Infect. Dis. 64:295–299. 10.1016/j.diagmicrobio.2009.03.004 [DOI] [PubMed] [Google Scholar]
- 33.Chan JC, Chu YW, Chu MY, Cheung TK, Lo JY. 2009. Epidemiological analysis of Streptococcus pyogenes infections in Hong Kong. Pathology 41:681–686. 10.3109/00313020903257723 [DOI] [PubMed] [Google Scholar]
- 34.Le Hello S, Doloy A, Baumann F, Roques N, Coudene P, Rouchon B, Lacassin F, Bouvet A. 2010. Clinical and microbial characteristics of invasive Streptococcus pyogenes disease in New Caledonia, a region in Oceania with a high incidence of acute rheumatic fever. J. Clin. Microbiol. 48:526–530. 10.1128/JCM.01205-09 [DOI] [PMC free article] [PubMed] [Google Scholar]
- 35.Seppala H, Klaukka T, Lehtonen R, Nenonen E, Huovinen P. 1997. Erythromycin resistance of group A streptococci from throat samples is related to age. Pediatr. Infect. Dis. J. 16:651–656. 10.1097/00006454-199707000-00006 [DOI] [PubMed] [Google Scholar]
- 36.Blackman Northwood J, Del Grosso M, Cossins LR, Coley MD, Creti R, Pantosti A, Farrell DJ. 2009. Characterization of macrolide efflux pump mef subclasses detected in clinical isolates of Streptococcus pyogenes isolated between 1999 and 2005. Antimicrob. Agents Chemother. 53:1921–1925. 10.1128/AAC.01065-08 [DOI] [PMC free article] [PubMed] [Google Scholar]