

Abstract
Colorimetric phenotypic tests recently gained interest because traditional primary drug susceptibility testing of Mycobacterium tuberculosis isolates takes a long time. We used meta-analysis techniques to review the reliability and accuracy of the nitrate reductase assay (NRA), which is one of the most popular colorimetric methods to detect resistance to first-line drugs. Medline, PubMed, ISI Web, Web of Science, and Google Scholar were used to search for studies enrolled in the meta-analysis. The analysis included 35 studies for isoniazid (INH), 38 for rifampin (RIF), and 22 for ethambutol (EMB) and streptomycin (STR). Summary receiver operating characteristic (SROC) curves were applied to summarize diagnostic accuracy. The meta-analyses were performed by the use of Meta-DiSc software (version 1.4) and were focused on sensitivity and specificity values for measurements of accuracy. The pooled sensitivities were 96% for INH, 97% for RIF, 90% for EMB, and 82% for STR. The pooled specificities for INH, RIF, EMB, and STR were 99%, 100%, 98%, and 96%, respectively. The times required to obtain results were between 5 and 28 days by the direct NRA and between 5 and 14 days by the indirect test. In conclusion, the present meta-analysis showed that the NRA is a reliable low-cost rapid colorimetric susceptibility test that can be used for the detection of multidrug-resistant (MDR) tuberculosis, including detection of EMB resistance. However, the test appears to have a relatively low sensitivity for STR and needs further improvement.
INTRODUCTION
Tuberculosis (TB) is still an important cause of morbidity and mortality in developing countries (1). Recently, increasing incidences of multidrug-resistant (MDR) and extensively drug-resistant (XDR) isolates have highlighted the importance of early diagnosis and treatment for control precautions (2). The treatment of patients infected with MDR and XDR isolates requires prolonged use of secondary antituberculosis drugs. It is important to diagnose and treat patients with MDR- and XDR-TB infections to prevent the spread of drug-resistant isolates (2, 3).
The proportion method (PM) is a conventional reference method that is used for the determination of primary antituberculosis drug susceptibility. The CLSI recommends that this method be performed on Middlebrook 7H10 and 7H11 agars; however, it is commonly performed on Löwenstein-Jensen (LJ) medium (4, 5). The PM requires approximately 21 to 28 days for results to be obtained. Therefore, the long period for detection of resistant isolates leads to failure in the management of patients infected with MDR- and XDR-TB. Reference automated systems (Bactec 460 TB and Bactec MGIT 960 [Becton, Dickinson Diagnostic Systems, Sparks, MD]) are available for overcoming this problem; however, the high costs and special requirements for these devices impede their usage for early diagnosis of resistance, especially in countries with limited resources (6). This issue has increased the interest in colorimetric methods, which are rapid, reliable, inexpensive, and easily performed and interpreted. Among these phenotypic methods, the nitrate reductase assay (NRA) is one that has gained the most interest. The NRA can be used as a direct test on smear-positive sputum specimens or as an indirect test on Mycobacterium tuberculosis isolates grown from conventional solid culture. The NRA is a technique based on the capacity of M. tuberculosis to reduce nitrate to nitrite, which is detected by adding the Griess reagent to the medium. In addition, this method is among the noncommercial drug susceptibility methods recommended by the WHO (3, 7).
We aimed to assess the accuracy of the NRA by a new systematic review and meta-analysis, complementary to the previous ones published (1, 3), for the determination of resistance to primary antituberculosis drugs, including isoniazid (INH), rifampin (RIF), ethambutol (EMB), and streptomycin (STR), among M. tuberculosis isolated from both clinical specimens and sputum samples.
MATERIALS AND METHODS
Literature search.
Medline, PubMed, ISI Web, Web of Science, and Google Scholar were used to search for studies enrolled into the meta-analysis. The keywords used in our search were “nitrate reductase,” “Griess,” “nitrate test,” “colorimetric,” “Mycobacterium tuberculosis,” “tuberculosis,” “drug susceptibility,” “drug resistance,” “isoniazid,” “rifampin,” “ethambutol,” and “streptomycin.” Studies obtained from searching were enrolled in the analysis if they met inclusion criteria; no language limitations were placed on the studies included.
Study selection.
We included studies that compared the NRA with a reference standard method (including the proportion method on LJ medium or agar, Bactec 460-TB, or Bactec MGIT960), studies that detected INH, RIF, EMB, and STR resistance, and studies that reported data on false-positive, true-positive, false-negative, and true-negative results. The heterogeneity of the data was addressed by performing a subgroup analysis with the NRA performed directly on sputum samples or indirectly on clinical isolates, in either solid or liquid medium.
Data extraction.
Studies obtained by searches using defined keywords were assessed by two independent reviewers. Disagreements between reviewers were resolved by consensus. Titles and abstracts of studies were read, and eligible ones were considered for data extraction. If study data were found to be inconsistent by two independent reviewers, the study was excluded from the meta-analysis. After that, data of the included studies were entered into the datasheet of Microsoft Excel software by one reviewer. Data extracted from the eligible studies included first author and year of publication of the study, country in which the study was performed, reference method used in the study, number of samples (direct or indirect test), sensitivity, specificity, and time for obtaining results. All extracted data were checked by a second independent reviewer. Sensitivity was defined as the proportion of isolates correctly determined as resistant by use of the NRA compared with the reference method. Specificity was defined as the proportion of isolates correctly determined susceptible by use of the NRA compared with the reference method.
Meta-analysis.
Meta-analyses were performed by using Meta-DiSc software (version 1.4) (8) and were focused on the sensitivity and specificity values for measurements of diagnostic accuracy. We created forest plots to estimate the accuracy of each test and receiver operating characteristic (ROC) curves that indicated the relationship between the true-positive results (TPR) and the false-positive results (FPR) of the test. The Q* index values represent a summarization of the test performance, in which sensitivity and specificity are equal. The heterogeneity among studies was analyzed by using the χ2 and I2 tests for heterogeneity (interpreted as the percentage of the total variability due to true heterogeneity in a set of effect sizes) included in the Meta-DiSc program.
Quality assessment.
The quality of individual studies was assessed using criteria based on the Quality Assessment of Diagnostic Accuracy Studies (QUADAS) tools (9).
RESULTS
Data presentation.
Cumulative data of all studies, including numbers of true-positive, false-positive, false-negative, and true-negative results, the AUC, and the Q* index values, are summarized in Table 1. Studies in which the NRA was used for the determination of drug resistance, including INH, RIF, EMB, and STR resistance, are summarized regarding country in which the study was performed, reference method used, number and type of samples, sensitivity and specificity values, and time for obtaining result in Tables S1 to S4 in the supplemental material. One study (10) had been performed in 5 different centers, and the results had been evaluated individually in tables.
TABLE 1.
Cumulative data of all studies; numbers of true-positive, false-positive, false-negative, true-negative, AUC, and Q* values
| Anti-TB drug | No. of studies (D/I)a | No. of NRA studies (D/I) with the indicated resultb |
AUC | Q* | ||||
|---|---|---|---|---|---|---|---|---|
| TP | FP | FN | TN | Total | ||||
| INH | 8/23 | 340/1027 | 11/12 | 10/46 | 667/1742 | 1028/2827 | 0.9933 | 0.9672 |
| RIF | 10/24 | 298/948 | 6/5 | 10/30 | 1101/1865 | 1415/2848 | 0.9960 | 0.9759 |
| EMB | 3/16 | 59/431 | 2/26 | 17/40 | 188/1597 | 266/2094 | 0.9820 | 0.9411 |
| STR | 3/16 | 84/645 | 9/55 | 8/153 | 165/1293 | 266/2146 | 0.9788 | 0.9349 |
D, direct test; I, indirect test.
TP, true positive; FP, false positive; FN, false negative; TN, true negative.
Detection of INH resistance.
Thirty-five studies were retrieved and included in the analysis. Positive sputum samples had been evaluated by direct test in 8 studies, whereas bacterial isolates had been evaluated by indirect test in the remaining 27 studies. Different reference methods had been used. The PM on LJ medium was used in 28 studies, the Bactec 460 TB in 3 studies, both PM and Bactec MGIT 960, PM and Bactec 460 TB, or Bactec 460 TB and Bactec MGIT 960 in 1 study, and PM on 7H10 agar in 1 study.
Figures 1 and 2 illustrate the forest plots that we used to estimate the sensitivities and specificities of the NRA based on results of the 35 included studies. Sensitivities (Fig. 1; see also Table S1 in the supplemental material) were 100% in 14 studies and >90% in 19 studies. A sensitivity of 85% was found in one study and 87% in another one. Specificities (Fig. 2; see also Table S1) had been determined as 100% in 21 studies and >93% in the remaining studies. The SROC curve shows an AUC of 0.99 and a Q* index of 0.96, indicating a high level of overall accuracy (Table 1; see also Fig. S1).
FIG 1.
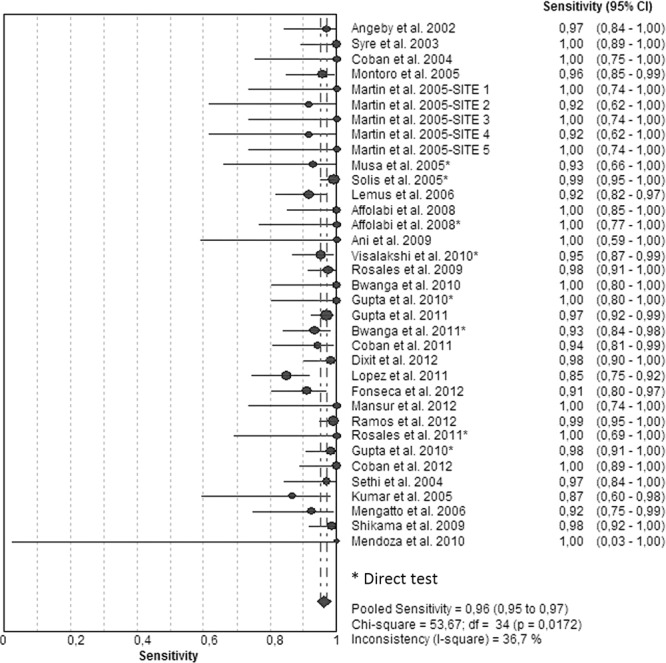
Forest plot of the sensitivities for INH assays. The point estimates of sensitivities from each study are shown as circles. Error bars indicate 95% confidence intervals.
FIG 2.
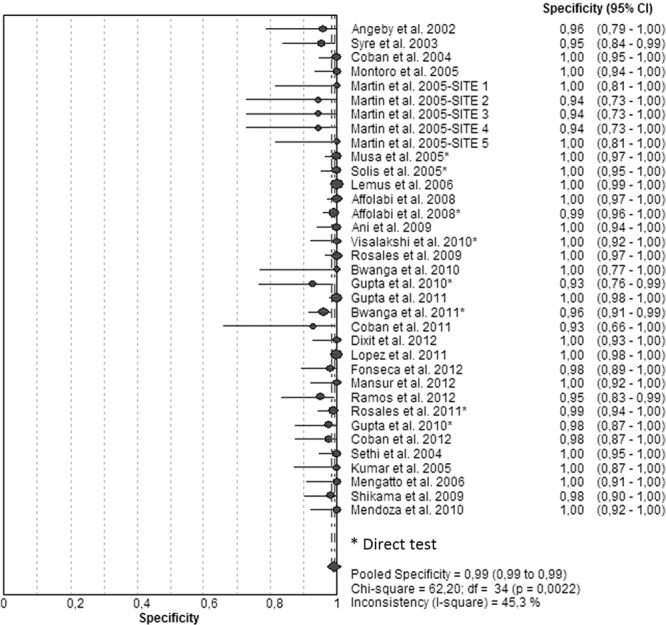
Forest plot of the specificities for INH assays. The point estimates of specificities from each study are shown as circles. Error bars indicate 95% confidence intervals.
Detection of RIF resistance.
Thirty-eight studies were included for RIF resistance. Positive sputum samples had been tested by direct test in 10 studies and by indirect test in 28 studies. The reference method used was PM on LJ medium in 30 studies, Bactec 460 TB in 3 studies, both PM and Bactec MGIT 960 or Bactec 460 TB and Bactec MGIT 960 in 1 study, both PM and Bactec 460 TB in 2 studies, both Bactec MGIT 960 and Bactec 460 TB in 1 study, and PM on 7H10 agar in 1 study.
Figures 3 and 4 illustrate the forest plots and Fig. S2 in the supplemental material illustrates the SROC of the 38 included studies. Sensitivities were 100% in 21 studies (Fig. 3; see also Table S2 in the supplemental material) and >90% in 14 studies and ranged between 80 and 88% in 4 studies. Specificities had been determined as 100% in the majority of the studies (Fig. 4; see also Table S2). The SROC curve shows an AUC of 0.99 and a Q* index of 0.97, indicating a high level of overall accuracy (Table 1; see also Fig. S2).
FIG 3.
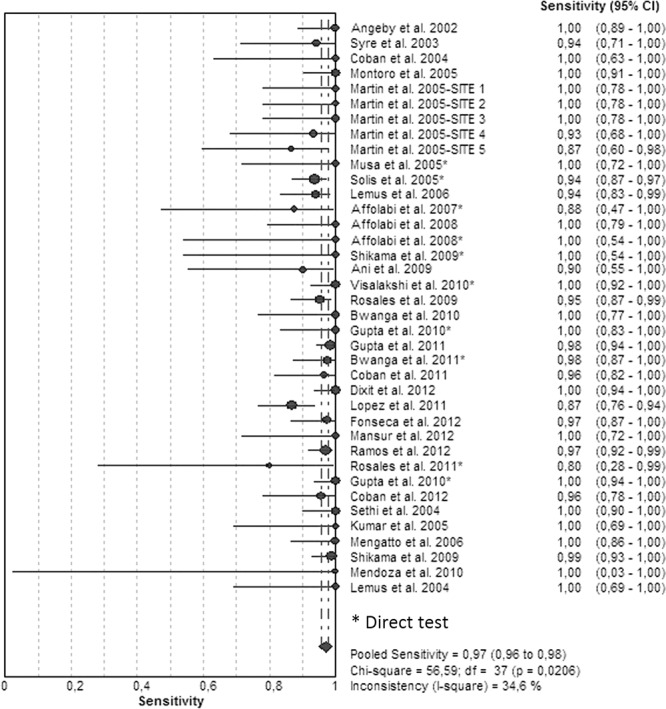
Forest plot of the sensitivities for RIF analyses. The point estimates of sensitivities from each study are shown as circles. Error bars indicate 95% confidence intervals.
FIG 4.
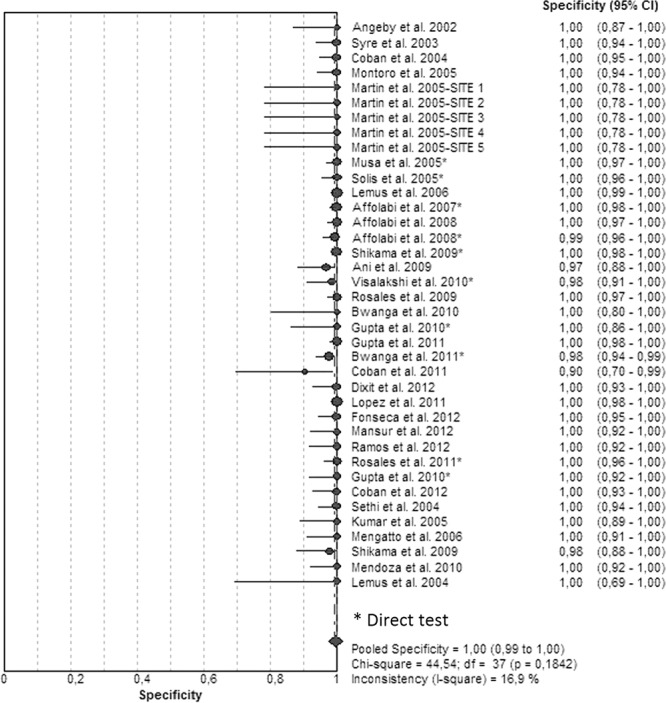
Forest plot of the specificities for RIF analyses. The point estimates of specificities from each study are shown as circles. Error bars indicate 95% confidence intervals.
Detection of EMB resistance.
Twenty-two studies were analyzed for EMB resistance. Positive sputum samples had been evaluated by direct test in only 3 studies. The reference tests were PM in 18 studies, Bactec 460 TB in 2 studies, both PM and Bactec MGIT 960 in 1 study, and PM on 7H10 agar in 1 study.
Figures 5 and 6 illustrate the forest plots and Fig. S3 in the supplemental material shows the SROC curve of the same data. Sensitivities (Fig. 5; see also Table S3 in the supplemental material) were 100% in 8 studies and ranged between 88 and 98% in 8 other studies. For 6 studies, the sensitivities ranged between 55 and 75%. Specificities (Fig. 6) were 100% in 9 studies and >90% in 12 studies; only 1 study had a specificity of 75%. The SROC curve shows an AUC of 0.98 and a Q* index of 0.94, indicating a good level of overall accuracy (Table 1; see also Fig. S3).
FIG 5.
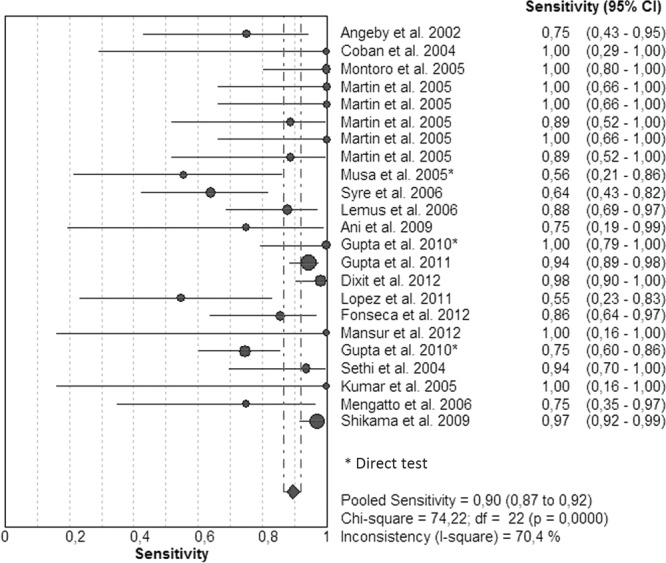
Forest plot of the sensitivities for EMB. The point estimates of sensitivities from each study are shown as circles. Error bars indicate 95% confidence intervals.
FIG 6.
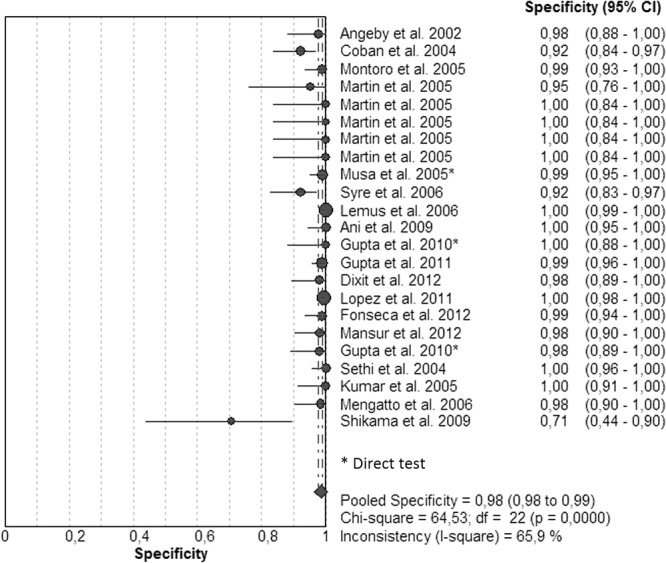
Forest plot of the specificities for EMB. The point estimates of specificities from each study are shown as circles. Error bars indicate 95% confidence intervals.
Detection of STR resistance.
Twenty-two studies were also included for STR resistance (see Table S4 in the supplemental material), and positive sputum samples had also been evaluated by direct test in only 3 studies. The reference tests were PM in 19 studies, Bactec 460 TB in 2 studies, and both PM and Bactec MGIT 960 in 1 study.
Figures 7 and 8 illustrate forest plots. There was considerable heterogeneity within studies, and sensitivities were very variable between studies. Eleven studies had sensitivities that ranged between 92 and 100%, and 6 had sensitivities that ranged between 73 and 89% (Fig. 7). However, 6 studies had specificities that ranged between 12 and 67%. Specificities (Fig. 8) had been determined as 100% in 8 studies and ranged between 78 and 99% for the other studies. The SROC curve shows an AUC of 0.97 and a Q* index of 0.93, still indicating acceptable overall accuracy (Table 1; see also Fig. S4 in the supplemental material).
FIG 7.
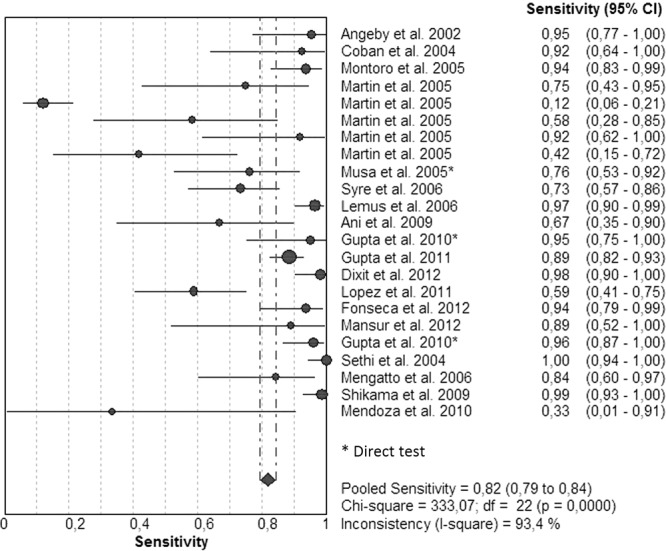
Forest plot of the sensitivities for STR. The point estimates of sensitivities from each study are shown as circles. Error bars indicate 95% confidence intervals.
FIG 8.
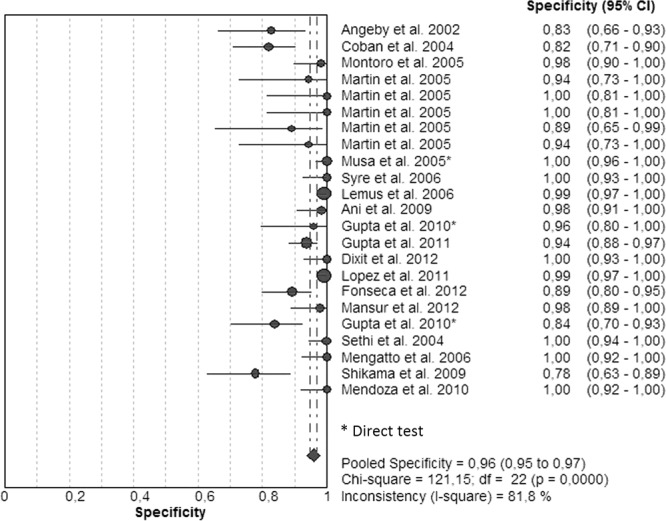
Forest plot of the specificities for STR. The point estimates of specificities from each study are shown as circles. Error bars indicate 95% confidence intervals.
Time for obtaining test results.
The times required to obtain test results for all drugs were between 5 and 28 days for direct NRA and between 5 and 14 days for indirect tests.
DISCUSSION
The aim of this study was to perform a meta-analysis of the NRA for the detection of primary antituberculosis drug resistance. In the literature there are two meta-analysis studies in which the NRA was analyzed. The first one, performed in 2008, focused on the determination of INH and RIF resistance and included 13 studies for INH and 14 studies for RIF (3). The second meta-analysis evaluated the performance of four direct-testing methods, including the NRA, with analyses of only 4 studies for the determination of RIF and INH susceptibility (1). The present meta-analysis, in addition to the 2 meta-analyses reviewed previously, is the first one in which all primary antituberculosis drugs were analyzed, including INH, RIF, EMB, and STR, and it included 35 studies. Overall, the included studies achieved good performance according to the analysis done with the QUADAS tool. Statistical tests, such as funnel plots, are not recommended for the detection of potential publication bias in meta-analyses of diagnostic data (11). However, publication bias is possible in our meta-analysis because studies with poor performance are usually not published.
NRA had high sensitivity and specificity, especially for determination of INH and RIF resistance, as shown in the previously published meta-analyses (1, 3). Sensitivities and specificities had been determined to be between 84.9 and 100% and 93 and 100% for INH and between 80 and 100% and 96.4 and 100% for RIF, respectively. Both sensitivity and specificity values had been determined to be lower for EMB and STR. AUC and Q* index values for EMB and STR were calculated by use of SROC curve analyses and were 0.98 and 0.90 for EMB and 0.97 and 0.90 for STR. For RIF, the NRA had been performed directly in bacillus-positive sputum samples in 10 studies, and results were obtained in 5 to 28 days. The advantage of the direct test is that the results can be obtained in a shorter time because it does not require time for bacterial isolation, which takes up to 2 to 4 weeks.
The NRA was usually performed in conventional LJ medium; it had also been performed in liquid media (7H9-S) in 5 studies (12–16). The times required to obtain results were relatively shorter in these studies compared with those in studies performed on LJ medium. Also, susceptibilities of INH and RIF were tested on blood agar media, and it has been suggested that blood agar can be used for the NRA (17). NRA results are negative for M. tuberculosis isolates which do not have nitrate reductase enzymes; however, such isolates are rare.
The WHO published a report, “Noncommercial culture and drug susceptibility testing methods for screening patients at risk for multidrug-resistant tuberculosis.” This document indicates that the NRA can be used but it is not faster than other conventional phenotypic tests performed in liquid media (7). However, there is a gain of 2 to 4 weeks in direct susceptibility testing. If drug resistance is quickly detected, patients with MDR-TB will receive an effective drug therapy regimen and thus will be less contagious to the community. The reduction in the time necessary to obtain susceptibility results is of fundamental importance.
The present study demonstrates that NRA is reliable for susceptibility testing of INH and RIF, the two most important drugs for the treatment of tuberculosis, and the performance of this test continues to be good over time. It is well known that for the two drugs EMB and STR, susceptibility is difficult to test even by conventional methods. Especially for STR susceptibility testing, NRA performance was low. The cost of processing a sample using the Griess method is $4.80 (not including labor or capital costs) compared with $10.00 for conventional DST (18). Also, reagents are usually easy to procure and distribute. The NRA direct method significantly shortened the time required to obtain test results, and we believe that direct NRA has a strong potential for the direct detection of first-line drugs in resource-limited settings.
Adequate infrastructure for DST capacity under biosafety conditions is required. The advantage of the direct NRA is that without the need to handle cultured isolates, drug susceptibility can be done with low biohazard risks.
In conclusion, the present meta-analysis showed that the NRA has acceptable and reliable sensitivity and specificity for determination of primary antituberculosis drug resistance, with lower values for EMB and STR. It also revealed that the NRA significantly shortened the time required for obtaining susceptibility test results. However, additional studies are required to better establish the accuracy of NRA applied to sputum, but preliminary studies included in this meta-analysis suggest that NRA may be useful for first-line resistance detection in sputum samples. Another important feature of the NRA is that it yields the test results almost within the same period of time as expensive rapid commercial tests.
Supplementary Material
ACKNOWLEDGMENT
We have no funding or conflicts of interest to declare.
Footnotes
Published ahead of print 16 October 2013
Supplemental material for this article may be found at http://dx.doi.org/110.1128/JCM.01990-13.
REFERENCES
- 1.Bwanga F, Hoffner S, Haile M, Joloba ML. 2009. Direct susceptibility testing for multidrug resistant tuberculosis: a meta-analysis. BMC Infect. Dis. 9:67. 10.1186/1471-2334-9-67 [DOI] [PMC free article] [PubMed] [Google Scholar]
- 2.Minion J, Leung E, Menzies D, Pai M. 2010. Microscopic-observation drug susceptibility and thin layer agar assay for the detection of drug resistant tuberculosis: a systematic review and meta-analysis. Lancet Infect. Dis. 10:688–698. 10.1016/S1473-3099(10)70165-1 [DOI] [PubMed] [Google Scholar]
- 3.Martin A, Panaiotov S, Portaels F, Hoffner S, Palomino JC, Angeby K. 2008. The nitrate reductase assay for the rapid detection of isoniazid and rifampicin resistance in Mycobacterium tuberculosis: a systematic review and meta-analysis. J. Antimicrob. Chemother. 62:56–64. 10.1093/jac/dkn139 [DOI] [PubMed] [Google Scholar]
- 4.Clinical and Laboratory Standards Institute (CLSI) 2011. Susceptibility testing of Mycobacteria, Nocardia, and other aerobic actinomycetes. Approved standard M24-A2, 2nd ed. Clinical and Laboratory Standards Institute, Wayne, PA: [PubMed] [Google Scholar]
- 5.Canetti G, Fox W, Khomenko A, Mahler HT, Menon NK, Mitchison DA, Rist N, Smelev NA. 1969. Advances in techniques of testing mycobacterial drug sensitivity and the use of sensitivity tests in tuberculosis control programs. Bull. World Health Org. 41:21–43 [PMC free article] [PubMed] [Google Scholar]
- 6.Martin A, Portaels F, Palomino JC. 2007. Colorimetric redox-indicator methods for the rapid detection of multidrug resistance in Mycobacterium tuberculosis: a systematic review and meta-analysis. J. Antimicrob. Chemother. 59:175–183. 10.1093/jac/dkl477 [DOI] [PubMed] [Google Scholar]
- 7.World Health Organization 2011. Noncommercial culture and drug-susceptibility testing methods for screening patients at risk for multidrug-resistant tuberculosis. World Health Organization, Geneva, Switzerland: http://whqlibdoc.who.int/publications/2011/9789241501620_eng.pdf [PubMed] [Google Scholar]
- 8.Zamora J, Abraira V, Muriel A, Khan K, Coomarasamy A. 2006. Meta-DiSc: a software for meta-analysis of test accuracy data. BMC Med. Res. Methodol. 6:31. 10.1186/1471-2288-6-31 [DOI] [PMC free article] [PubMed] [Google Scholar]
- 9.Whiting P, Rutjes AWS, Reitsma JB, Bossuyt PM, Kleijnen J. 2003. The development of QUADAS: a tool for the quality assessment of studies of diagnostic accuracy included in systematic reviews. BMC Med. Res. Methodol. 3:25. 10.1186/1471-2288-3-25 [DOI] [PMC free article] [PubMed] [Google Scholar]
- 10.Martin A, Montoro E, Lemus D, Simboli N, Morcillo N, Velasco M, Chauca J, Barrera L, Ritacco V, Portaels F, Palomino JC. 2005. Multicenter evaluation of the nitrate reductase assay for drug resistance detection of Mycobacterium tuberculosis. J. Microbiol. Methods 63:145–150. 10.1016/j.mimet.2005.03.004 [DOI] [PubMed] [Google Scholar]
- 11.Flores LL, Steingart KR, Dendukuri N, Schiller I, Minion J, Pai M, Ramsay A, Henry M, Laal S. 2011. Systematic review and meta-analysis of antigen detection tests for the diagnosis of tuberculosis. Clin. Vaccine Immunol. 18:1616–1627. 10.1128/CVI.05205-11 [DOI] [PMC free article] [PubMed] [Google Scholar]
- 12.Syre H, Phyu S, Sandven P, Bjorvatn B, Grewal HM. 2003. Rapid colorimetric method for testing susceptibility of Mycobacterium tuberculosis to isoniazid and rifampin in liquid cultures. J. Clin. Microbiol. 41:5173–5177. 10.1128/JCM.41.11.5173-5177.2003 [DOI] [PMC free article] [PubMed] [Google Scholar]
- 13.Syre H, Valvatne H, Sandven P, Grewal HM. 2006. Evaluation of the nitrate-based colorimetric method for testing the susceptibility of Mycobacterium tuberculosis to streptomycin and ethambutol in liquid cultures. J. Antimicrob. Chemother. 57:987–991. 10.1093/jac/dkl054 [DOI] [PubMed] [Google Scholar]
- 14.Affolabi D, Odoun M, Sanoussi N, Martin A, Palomino JC, Kestens L, Anagonou S, Portaels F. 2008. Rapid and inexpensive detection of multidrug-resistant Mycobacterium tuberculosis with the nitrate reductase assay using liquid medium and direct application to sputum samples. J. Clin. Microbiol. 46:3243–3245. 10.1128/JCM.00083-08 [DOI] [PMC free article] [PubMed] [Google Scholar]
- 15.Coban AY, Uzun M, Akgunes A, Durupinar B. 2012. Comparative evaluation of the microplate nitrate reductase assay and the resazurin microtitre assay for the rapid detection of multidrug resistant Mycobacterium tuberculosis clinical isolates. Mem. Inst. Oswaldo Cruz 107:578–581. 10.1590/S0074-02762012000500002 [DOI] [PubMed] [Google Scholar]
- 16.Kumar M, Khan IA, Verma V, Kalyan N, Qazi GN. 2005. Rapid, inexpensive MIC determination of Mycobacterium tuberculosis isolates by using microplate nitrate reductase assay. Diagn. Microbiol. Infect. Dis. 53:121–124. 10.1016/j.diagmicrobio.2005.05.011 [DOI] [PubMed] [Google Scholar]
- 17.Coban AY, Tanriverdi Cayci Y, Deveci A, Akgunes A, Uzun M, Durupinar B. 2011. A rapid detection of multidrug-resistant Mycobacterium tuberculosis by a nitrate reductase assay on blood agar. Mem. Inst. Oswaldo Cruz 106:378–380. 10.1590/S0074-02762011000300022 [DOI] [PubMed] [Google Scholar]
- 18.Asencios L, Yale G, Yagui M, Quispe N, Taylor A, Blaya J, Contreras C, Cegielski P, Bayona J, Bonilla C, Shin S. 2008. Programmatic implementation of rapid DST for Mycobacterium tuberculosis in Peru. Int. J. Tuberc. Lung Dis. 12:743–749 [PMC free article] [PubMed] [Google Scholar]
Associated Data
This section collects any data citations, data availability statements, or supplementary materials included in this article.