

Abstract
Methicillin-resistant Staphylococcus aureus (MRSA) usually harbors a vancomycin-susceptible phenotype (VSSA) but can exhibit reduced vancomycin susceptibility phenotypes that can be heterogeneous-intermediate (hVISA), intermediate (VISA), or fully resistant (VRSA). Current detection techniques (e.g., Etest and population analysis profiles [PAPs]) are slow and time-consuming. We investigated the potential of microcalorimetry to detect reduced susceptibilities to vancomycin in MRSA strains. Representative MSSA, VSSA, hVISA, VISA, and VRSA reference strains, as well as clinical isolates, were used. PAPs were performed by standard methods. Microcalorimetry was performed by inoculating 5 × 10⁷ CFU of overnight cultures into 3-ml vials of brain heart infusion broth supplemented with increasing concentrations of vancomycin, and growth-related heat production was measured at 37°C. For the reference strains, no heat production was detected in the VSSA isolates at vancomycin concentrations of >3 μg/ml during the 72 h of incubation. The hVISA and VISA strains showed heat production with concentration-proportional delays of up to 6 μg/ml in 48 h and up to 12 μg/ml in 72 h, respectively. The VRSA strain showed heat production at concentrations up to 16 μg/ml in 12 h. The testing of clinical strains indicated an excellent negative predictive value, allowing us to rule out a decreased vancomycin susceptibility phenotype in <8 h of incubation. Sequential isolates from a patient undergoing vancomycin therapy showed evolving microcalorimetric profiles up to a VISA phenotype. Microcalorimetry was able to detect strains with reduced susceptibilities to vancomycin in <8 h. The measurement of bacterial heat production might represent a simple and rapid method for the detection of reduced susceptibilities to vancomycin in MRSA strains.
INTRODUCTION
Vancomycin remains one of the first-line treatment options for severe infections caused by methicillin-resistant Staphylococcus aureus (MRSA). In the last decade, MRSA with reduced susceptibility or resistance to vancomycin has emerged. Vancomycin-resistant S. aureus (VRSA) strains have developed resistance by the acquisition of the vanA operon from enterococci, and they have expressed high-level resistance to vancomycin with MIC values of ≥16 μg/ml. The first VRSA strain was described in 2002 (1), and to date, more than 30 VRSA cases have been described worldwide (2–4). On the other hand, a larger number of S. aureus strains have also acquired lower, albeit clinically significant levels of reduced vancomycin susceptibility, the mechanisms of which are not yet fully characterized (2). Depending on their phenotypes, these strains are labeled either as heterogeneous vancomycin-intermediate S. aureus (hVISA) or homogeneous vancomycin-intermediate S. aureus (VISA). Whereas in VISA, nearly the whole bacterial population exhibits an increased vancomycin MIC, in hVISA, only a subset of the population, typically at a frequency of 10−4 to 10−6, exhibits an increased vancomycin MIC.
The first detection of hVISA and VISA strains was reported in Japan in 1997 (5, 6). A number of studies have shown that infections with hVISA and VISA strains have poorer clinical outcomes when vancomycin is used, but their exact prevalence is unclear, essentially because of a lack of standardized detection methods and changes in clinical breakpoints over the years (2, 7, 8). Within MRSA, the prevalences of hVISA and VISA have been estimated to range from 0 to 10% (2). In that context, the clinical breakpoints for vancomycin established by the European Committee on Antimicrobial Susceptibility Testing (EUCAST) or the Clinical and Laboratory Standards Institute (CLSI) have recently been lowered in order to achieve a better detection of these isolates (9–11). Therefore, it is of the utmost importance that S. aureus strains exhibiting decreased susceptibilities to glycopeptides be identified in a timely manner in order for the patient to benefit from the use of alternative anti-MRSA agents.
Due to their high vancomycin MICs, the detection of VISA (MIC, 4 to 8 μg/ml) or VRSA (MIC, ≥16 μg/ml) is relatively straightforward using conventional microbiological techniques, such as Etest strips or disk diffusion testing. In contrast, the detection of hVISA can be challenging due to its low-level vancomycin resistance and the presence of resistance in only a fraction of the population (12, 13). Various methods have been described to increase the sensitivity of detection, such as vancomycin agar screening plates or Etest sensitivity testing using a high inoculum. All these methods demonstrate sensitivities ranging from 30% to 90%, with wide variations in specificity (see reference 2 for a review of the detection methods). The current gold standard is the population analysis profile (PAP), often performed in conjunction with an area under the curve (AUC) analysis (14), but this technique is time- and labor-consuming and therefore not suitable for routine use in clinical microbiology laboratories. Moreover, all these techniques often require 48 h of incubation to obtain reliable results. Isothermal microcalorimetry is based on the detection of heat produced by active biological processes, such as bacterial metabolism and replication (15–17). In the present study, we developed a microcalorimetry-based approach to rapidly discriminate vancomycin-susceptible from -nonsusceptible phenotypes in MRSA strains.
MATERIALS AND METHODS
Bacterial strains, growth conditions, and antibiotics.
The S. aureus strains used in this study are described in Table 1. Bacteria were grown on either brain heart infusion (BHI) agar or BHI broth (Oxoid, Basingstoke, United Kingdom) at 37°C. Bacterial stocks were kept at −80°C in BHI broth supplemented with 10% (vol/vol) glycerol. Bacterial suspensions were freshly prepared from colonies harvested on BHI agar plates. Vancomycin powder was purchased from Eli Lilly (Geneva, Switzerland).
TABLE 1.
Staphylococcus aureus strains used in this study
| S. aureus strain | Vancomycin phenotypea | Vancomycin MIC (μg/ml)b | Reference no./source |
|---|---|---|---|
| ATCC 29213 | VSSA | 1 | American Type Culture Collection |
| ATCC 43300 | VSSA | 1 | American Type Culture Collection |
| Mu3 | hVISA | 2 | 5 |
| PC1 | hVISA | 2 | 25 |
| Mu50 | VISA | 8 | 6 |
| PC3 | VISA | 8 | 25 |
| SA510 | VRSA | 32 | 26 |
| Clinical strain (n = 20) | VSSA | 0.5–1 | National Reference Center for Staphylococci |
| Clinical strain (n = 9)b | hVISA (n = 4), VISA (n = 5) | 2–5 | National Reference Center for Staphylococci |
| MRSA 1 | VSSA | 0.75 | This work |
| MRSA 2 | VSSA | 1 | This work |
| MRSA 3 | VISA | 4 | This work |
| MRSA 4 | VISA | 6 | This work |
VSSA, vancomycin-susceptible S. aureus; hVISA, heterogeneous vancomycin-intermediate S. aureus; VISA, vancomycin-intermediate S. aureus; VRSA, vancomycin-resistant S. aureus.
MICs as determined by standard Etest (0.5 McFarland standard inoculum).
Conventional vancomycin susceptibility testing.
The vancomycin MICs were determined by the Etest method (bioMérieux, Marcy l'Etoile, France) with a 0.5 McFarland standard inoculum. The MIC clinical breakpoints were defined according to the CLSI guidelines (susceptible, ≤2 μg/ml; intermediate, 4 to 8 μg/ml; and resistant, ≥16 μg/ml) (9).
Microcalorimetric vancomycin susceptibility testing.
A 48-channel isothermal microcalorimeter (TAM III; TA Instruments, New Castle, DE, USA) was used to measure bacterial heat flow at 37°C. The detection limit of heat production of the instrument is 0.2 μW (corresponding to 103 to 104 bacterial cells) with an absolute accuracy of 0.02°C. Microcalorimetric glass ampoules (volume, 4 ml) were filled with 3 ml of BHI broth containing increasing concentrations of vancomycin (arithmetic progression from 0 to 8, 12, and 16 μg/ml). Each ampoule was subsequently inoculated with 100 μl of a bacterial suspension diluted in normal saline to McFarland 2.0 standard (corresponding to approximately 5 × 10⁸ CFU/ml). The ampoules were sealed and introduced into the microcalorimeter. The heat flow was recorded at 37°C for up to 72 h. Positive growth was defined as a heat flow of >20 μW from baseline, and the time from inoculation to growth positivity detection was determined using the manufacturer's software (TAM Assistant; TA Instruments). All experiments were performed at least in triplicate.
Population analysis profiles.
PAPs were carried out by spreading serial dilutions (10−2 to 10−7) of an overnight culture (∼109 CFU/ml) of the test strains on agar plates containing arithmetic progressions of vancomycin concentrations from 1 to 8 μg/ml. The colonies were counted after 48 h of incubation at 37°C. Population analysis curves were drawn by plotting the number of colonies growing on the plates (expressed as log10 CFU/ml) against the concentrations of vancomycin on the plates using GraphPad Prism (GraphPad, San Diego, CA, USA). The area under the curve (AUC) of the population analysis graph was calculated, and a ratio of the PAP/AUC of the tested isolates to that of the hVISA reference strain Mu3 was calculated (14). PAP/AUC ratios of 0.9 to 1.3 and >1.3 were considered to be positive for hVISA and VISA, respectively (2).
Genotyping.
For genotyping, amplified fragment length polymorphism analysis was performed as previously described (18).
RESULTS
Determination of vancomycin susceptibility profiles of reference strains by microcalorimetry.
The typical heat flow curves obtained for the VSSA, hVISA, VISA, and VRSA reference strains grown in the presence of increasing concentrations of vancomycin are shown in Fig. 1. The times to detection of the corresponding cultures are shown in Table 2. Typical cumulated heat curves are provided in Fig. S2 in the supplemental material.
FIG 1.

Typical time-heat flow curves for the seven tested S. aureus reference strains in the presence of increasing concentrations of vancomycin (0 to 8, 12, and 16 μg/ml) recorded for up to 72 h of incubation. Shown are the vancomycin-susceptible strains S. aureus ATCC 29213 (MSSA) and S. aureus ATCC 43300 (MRSA) (A), vancomycin heterogeneous-intermediate strains S. aureus Mu3 and S. aureus PC1 (B), vancomycin homogeneous-intermediate strains S. aureus Mu50 and S. aureus PC3 (C), and vancomycin-resistant strain S. aureus SA510 (D).
TABLE 2.
Mean time to detection and range of bacterial growth for the 7 tested Staphylococcus aureus reference strains in the presence of increasing concentrations of vancomycina
| Vancomycin phenotype | S. aureus strain | Mean (range) no. of hours to detection of heat production at indicated vancomycin concn (µg/ml) |
||||||||||
|---|---|---|---|---|---|---|---|---|---|---|---|---|
| 0 | 1 | 2 | 3 | 4 | 5 | 6 | 7 | 8 | 12 | 16 | ||
| VSSA | ATCC 29213 | <1 | <1 | 16.0 (14.5–15.7) | 59.6 (48.2–70.2) | |||||||
| VSSA | ATCC 43300 | <1 | <1 | 28.4 (25.1–34.3) | ||||||||
| hVISA | Mu3 | <1 | <1 | 4.4 (1.3–7.7) | 9.5 (6.7–12.4) | 19.9 (16.3–23.2) | 33.9 (16.8–45.1) | 43.4 (16.6–57.1) | ||||
| hVISA | PC1 | <1 | <1 | <1 | 5.2 (4.3–7.0) | 30.1 (13–51.6) | 56.2 (43.5–66.3) | |||||
| VISA | Mu50 | <1 | <1 | 1.1 (1.0–1.3) | 1.2 (1.0–1.4) | 3.3 (1.0–5.0) | 5.7 (4.5–6.7) | 8.3 (6.4–10.8) | 18.7 (15–25.5) | 29.9 (22.1–35.8) | 65.9 (58.5–72.0) | |
| VISA | PC3 | <1 | <1 | 1.1 (1.0–1.2) | 1.2 (1.0–1.5) | 1.2 (1.0–1.5) | 1.4 (1.0–2.3) | 1.8 (1.0–3.5) | 3.6 (3.0–4.4) | 4.7 (4.2–5.5) | 15.8 (7.3–26.5) | |
| VRSA | SA510 | <1 | <1 | <1 | 2.4 (1.0–3.1) | 3.5 (1.0–5.3) | 4.7 (1.4–6.5) | 5.6 (2.1–7.5) | 6.1 (2.1–8.3) | 6.5 (2.1–8.8) | 9.9 (8.5–10.9) | 11.4 (10.0–12.7) |
Empty cells represent vancomycin concentrations at which no growth was recorded during the 72 h of incubation.
Heat flow curve profiles were clearly distinctive between the S. aureus strains exhibiting different levels of susceptibility to vancomycin. Whereas no difference in growth between all strains was seen in controls without antibiotic or with a vancomycin concentration of 1 μg/ml, VSSA strains ATCC 29213 and ATCC 43300 exhibited growth only at 2 μg/ml, with an important delay (Fig. 1A). With the exception of a late positive signal of S. aureus ATCC 29213 at 3 μg/ml after ca. 60 h, no further growth was observed at higher concentrations during the 72 h of incubation for either strain.
On the other hand, both hVISA strains (Mu3 and PC1) were able to grow at vancomycin concentrations up to 6 μg/ml and 5 μg/ml within 48 h, respectively (Fig. 1B). Both VISA strains (Mu50 and PC3) grew at concentrations up to 8 μg/ml in <24 h (Fig. 1C). The VRSA strain SA510 grew at concentrations up to 16 μg/m in less than 12 h (Fig. 1D). Taken together, the time to detection results with a 20-μW heat flow signal as a threshold allow for the establishment of cutoff values to rapidly segregate these reference strains into vancomycin-susceptible or -nonsusceptible phenotypes (Table 2). Since the longest detection time at a concentration of 2 μg/ml ever obtained for hVISA was 7.7 h, if no positive growth signal at 2 μg/ml occurred in the first 8 h of incubation, strains can be considered sensitive to vancomycin. In contrast, when a positive signal was detected at 2 μg/ml, strains exhibited a vancomycin-nonsusceptible phenotype (i.e., hVISA, VISA, or VRSA). A strain that grew at concentrations up to 4 μg/ml of vancomycin in the first 8 h of incubation was indicative of a VISA or VRSA phenotype since the longest detection time at 4 μg/ml ever obtained for VISA or VRSA was 5.0 h. Strains showing positive growth at 2 μg/ml but not at 4 μg/ml in the first 8 h of incubation indicated an hVISA phenotype.
Interestingly, microcalorimetric heat curves show that even though the MICs of VISA Mu50 and VISA PC3 as determined by routine conventional methods are the same at 8 μg/ml, the characteristics of their antibiotic susceptibility profiles toward vancomycin are different. Indeed, Fig. 1C shows that PC3 exhibits a more homogenous resistance profile toward vancomycin than Mu50. In comparison to the growth control without antibiotic, only a slight lag in time to detection was observed for PC3 at 7 μg/ml and 8 μg/ml, whereas a delay was already noticed from 4 μg/ml and upwards of 4 μg/ml for Mu50. This parallels the results obtained by PAP, which indicate that almost the whole PC3 population was able to grow at 8 μg/ml, whereas only subpopulations of the Mu50 strain are able to grow at 7 and 8 μg/ml of vancomycin (19).
Screening of clinical isolates.
Using the aforementioned criteria established with the reference strains, we analyzed clinical isolates of MRSA with either a vancomycin-susceptible phenotype or a decreased susceptibility to vancomycin, as determined by the PAPs. The mean times to detection are shown in Table S1 in the supplemental material.
In the vancomycin-susceptible group, 19/20 (95%) isolates were correctly identified as VSSA by the microcalorimetry method and 1/20 (5%) isolates was misclassified as harboring decreased susceptibility to vancomycin. Indeed, for this isolate (LY 8), positive growth at 2 μg/ml of vancomycin was detected after 6.2 h of incubation, even though this strain was classified as VSSA by the PAP. This might be due to the fact that in liquid medium, this isolate might exhibit better growth in the presence of an antibiotic than on the solid medium used for PAP determinations. In the group with decreased susceptibilities to vancomycin (4 hVISA and 5 VISA strains), 9/9 (100%) of the isolates were correctly detected by the microcalorimetry method.
Detection of sequential development of vancomycin-intermediate resistance leading to the first VISA isolate in Switzerland.
A 63-year-old male patient was admitted to the intensive care unit (ICU) of our institution in June 2008 for myocardial infarction with refractory cardiogenic shock. Eight weeks later, a biventricular assist device (VAD) was implanted and the patient was put on the waiting list for heart transplantation. At that time, the patient was colonized on the skin by a MRSA (Fig. 2, MRSA 1) strain that was susceptible to vancomycin (AUC ratio of 0.6). Of note, among the other treatments, implantation of the VAD was done under vancomycin prophylaxis.
FIG 2.
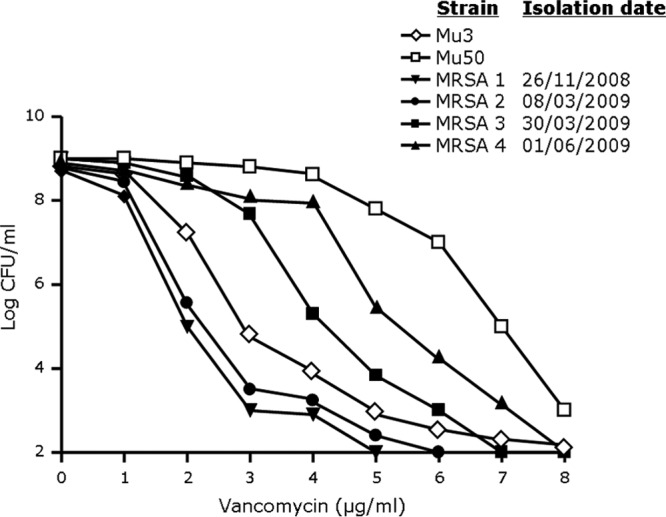
Population analysis profiles of four representative invasive MRSA strains isolated from a patient with persistent MRSA colonization and invasive bacteremia episodes (see the text for details on the case report). S. aureus Mu3 and Mu50 are shown as reference hVISA and VISA strains, respectively.
In February 2009, the patient received 2 weeks of vancomycin therapy for a MRSA urinary tract infection (the susceptibility profile was similar to MRSA 1). Two weeks after the discontinuation of vancomycin (March 2009), the patient developed a fever with chills and confusion. Purulent discharge was observed around the external line of the VAD, but imaging did not reveal the presence of an abscess around the VAD. Blood cultures, as well as the culture of the purulent discharge, were positive for a vancomycin-susceptible MRSA strain (MRSA 2; AUC ratio of 0.7). Vancomycin was started with a target trough plasma level of 15 μg/ml. Sequential blood cultures were positive for MRSA until 12 days after the first positive blood culture. Rifampin was then added to the vancomycin therapy. A MRSA strain was isolated that showed vancomycin-intermediate resistance by PAP (MRSA 3; AUC ratio of 1.32). After 4 weeks of vancomycin and rifampin, therapy was switched to oral cotrimoxazole, which was planned to continue until heart transplantation.
In June 2009, while the patient was on cotrimoxazole, a control swab of nonpurulent discharge from the external line of the VAD grew a VISA strain with further reduced vancomycin susceptibility (MRSA 4; AUC ratio of 1.59). Since the patient had no fever and the characteristics of the discharge had not changed over the previous few weeks, no treatment was started, as the isolate was considered to be a colonizer.
Hence, because of persistent colonization of the biventricular assist device by MRSA, and the serial exposure to various antibiotic treatments (including vancomycin for MRSA bacteremic episodes), the original vancomycin-susceptible MRSA strain (MRSA 1) gradually evolved toward a VISA phenotype (MRSA 4). Of note, the amplified fragment length polymorphism analysis results indicated that all the MRSA isolates were clonal (data not shown). Relative to other countries, the MRSA prevalence in Switzerland is relatively low, and to the best of our knowledge, our results represent the identification of the first invasive clinical vancomycin-intermediate MRSA strain in Switzerland.
In addition to the PAPs (Fig. 2), we performed microcalorimetric studies (Fig. 3) on the various MRSA isolates from this patient. The results clearly show that in parallel to the evolution of decreased vancomycin susceptibility detected by PAP, microcalorimetric heat flow curve profiles showed decreased susceptibilities to vancomycin. Interestingly, as can be seen from the heat flow curves without antibiotics (Fig. 3), these 4 MRSA isolates exhibited a significantly slower growth phenotype than the other MRSA isolates tested in this study. Accordingly, even though MRSA 3 and MRSA 4 were classified as VISA by PAP, and the microcalorimetric detection times at 2 μg/ml of vancomycin were <8 h, as expected (7.9 h and 5.9 h for the MRSA 3 and 4 strains, respectively), the detection times at 4 μg/ml of vancomycin were above the values obtained for all the other VISA isolates presented in Table 1 (16.5 h and 10.3 h for the MRSA 3 and 4 strains, respectively). Thus, depending on the growth rate in liquid medium, the time-to-detection criteria might need to be adapted for strains exhibiting exceptionally slowly growing phenotypes.
FIG 3.

Typical time-heat flow curves of four representative invasive MRSA strains isolated from a patient with persistent MRSA colonization and invasive bacteremia episodes (see the text for details on the case report) in the presence of an increasing concentration of vancomycin (0 to 8 μg/ml) recorded for up to 48 h of incubation.
Of note, compared to the measurements of bacterial growth by optical density at 600 nm (OD600) using a spectrophotometer, the typical results showed that the growth curves performed in the presence of vancomycin concentrations of 2 μg/ml did not appreciably change from baseline within 8 h (see Fig. S1 and materials and methods in the supplemental material), whereas the growth detection by microcalorimetry was achieved under these conditions within 8 h. Thus, the calorimetric method provides a more rapid differentiation of MRSA from VISA than standard spectrophotometry.
DISCUSSION
Microcalorimetry has recently been used to differentiate methicillin-susceptible S. aureus (MSSA) from MRSA (20) and to determine antibiotic susceptibility profiles (21). The results presented in our study indicate that microcalorimetry can be used to rapidly detect vancomycin–nonsusceptible MRSA and might allow for faster antibiotic therapeutic adaptations for MRSA infections that do not respond well to standard vancomycin therapy.
Indeed, the current routine methods are either unsatisfactory or too time-consuming to provide information to clinicians in a timely manner. Because it is unrealistic to test all MRSA isolates found in a clinical microbiology laboratory by the current gold standard, PAP, laboratory algorithms, such as the one available on the CDC website (see http://www.cdc.gov/HAI/settings/lab/visa_vrsa_algorithm.html), have been developed for this purpose. Typically, 48 to 72 h is often required to provide results, and the expertise of a specialized laboratory might be necessary.
Our results show a reproducible differentiation between VSSA, hVISA, and VISA phenotypes on well-characterized reference strains. Since none of the hVISA, VISA, or VRSA strains studied was misclassified as VSSA, the microcalorimetry method was used to rule out a decreased vancomycin susceptibility phenotype in <8 h. Whether or not this method might also be useful to assess the susceptibility of MRSA to other antibiotics (e.g., daptomycin or linezolid) remains to be determined with specific resistant strains. For instance, a reduced susceptibility to daptomycin was detected in strains with a high vancomycin MIC, such as strain Mu50 (22), whereas no resistance to linezolid was detected (data not shown).
New technologies that have been introduced into clinical microbiology laboratories, such as matrix-assisted laser desorption ionization–time of flight mass spectrometry for bacterial identification (23) or innovative methods for antibiotic susceptibility testing (24), are aimed at reducing the delay that occurs in providing clinicians with useful information for patient care. Currently, the acquisition costs of multichannel microcalorimeters are high and these devices are therefore not suitable for routine diagnostic laboratories. However, with further developments that might reduce manufacturing costs, the introduction of microcalorimetry-based antibiotic susceptibility determination might also be useful to rapidly adapt antimicrobial treatments and follow the development of resistance in clinical strains from patients, especially when undergoing long-lasting antibiotic treatments.
Supplementary Material
ACKNOWLEDGMENTS
This study was supported by an unrestricted educational grant, the Antibacterial Europe ASPIRE research awards 2010, from Pfizer International Operations (to A.B.) and in part by a research grant from the European Society of Clinical Microbiology and Infectious Diseases (ESCMID) (to A.B.).
We thank Alexander Tomasz (Rockefeller University, USA), Keiichi Hiramatsu (Juntendo University, Japan), Peter C. Appelbaum (Hershey Medical Center, USA), and Jacques Bille (University Hospital Lausanne, Switzerland) for providing some of the S. aureus strains, and Andrej Trampuz (University of Berlin, Germany) for his helpful comments. We are grateful to Delphine Morisset for technical help with the AFLP experiments.
Footnotes
Published ahead of print 6 November 2013
Supplemental material for this article may be found at http://dx.doi.org/10.1128/JCM.01820-13.
REFERENCES
- 1.Sievert DM, Boulton ML, Stoltman G, Johnson D, Stobierski MG, Downes FP, Somsel PA, Rudrik JT, Brown W, Hafeez W, Lundstrom T, Flanagan E, Johnson R, Mitchell J, Chang S. 2002. Staphylococcus aureus resistant to vancomycin–United States, 2002. MMWR Morb. Mortal. Wkly. Rep. 51:565–567 [PubMed] [Google Scholar]
- 2.Howden BP, Davies JK, Johnson PD, Stinear TP, Grayson ML. 2010. Reduced vancomycin susceptibility in Staphylococcus aureus, including vancomycin-intermediate and heterogeneous vancomycin-intermediate strains: resistance mechanisms, laboratory detection, and clinical implications. Clin. Microbiol. Rev. 23:99–139. 10.1128/CMR.00042-09 [DOI] [PMC free article] [PubMed] [Google Scholar]
- 3.Moravvej Z, Estaji F, Askari E, Solhjou K, Naderi Nasab M, Saadat S. 2013. Update on the global number of vancomycin-resistant Staphylococcus aureus (VRSA) strains. Int. J. Antimicrob. Agents 42:370–371. 10.1016/j.ijantimicag.2013.06.004 [DOI] [PubMed] [Google Scholar]
- 4.Périchon B, Courvalin P. 2009. VanA-type vancomycin-resistant Staphylococcus aureus. Antimicrob. Agents Chemother. 53:4580–4587. 10.1128/AAC.00346-09 [DOI] [PMC free article] [PubMed] [Google Scholar]
- 5.Hiramatsu K, Aritaka N, Hanaki H, Kawasaki S, Hosoda Y, Hori S, Fukuchi Y, Kobayashi I. 1997. Dissemination in Japanese hospitals of strains of Staphylococcus aureus heterogeneously resistant to vancomycin. Lancet 350:1670–1673. 10.1016/S0140-6736(97)07324-8 [DOI] [PubMed] [Google Scholar]
- 6.Hiramatsu K, Hanaki H, Ino T, Yabuta K, Oguri T, Tenover FC. 1997. Methicillin-resistant Staphylococcus aureus clinical strain with reduced vancomycin susceptibility. J. Antimicrob. Chemother. 40:135–136. 10.1093/jac/40.1.135 [DOI] [PubMed] [Google Scholar]
- 7.Charles PG, Ward PB, Johnson PD, Howden BP, Grayson ML. 2004. Clinical features associated with bacteremia due to heterogeneous vancomycin-intermediate Staphylococcus aureus. Clin. Infect. Dis. 38:448–451. 10.1086/381093 [DOI] [PubMed] [Google Scholar]
- 8.Maor Y, Hagin M, Belausov N, Keller N, Ben-David D, Rahav G. 2009. Clinical features of heteroresistant vancomycin-intermediate Staphylococcus aureus bacteremia versus those of methicillin-resistant S. aureus bacteremia. J. Infect. Dis. 199:619–624. 10.1086/596629 [DOI] [PubMed] [Google Scholar]
- 9.CLSI 2009. Performance standards for antimicrobial susceptibility testing; 19th informational supplement. CLSI M100-S19 Clinical and Laboratory Standards Institute, Wayne, PA [Google Scholar]
- 10.EUCAST 2013. Breakpoint tables for interpretation of MICs and zone diameters, version 3.1. European Committee on Antimicrobial Susceptibility Testing, Basel Switzerland: http://www.eucast.org/fileadmin/src/media/PDFs/EUCAST_files/Breakpoint_tables/Breakpoint_table_v_3.1.pdf [Google Scholar]
- 11.Tenover FC, Moellering RC., Jr 2007. The rationale for revising the Clinical and Laboratory Standards Institute vancomycin minimal inhibitory concentration interpretive criteria for Staphylococcus aureus. Clin. Infect. Dis. 44:1208–1215. 10.1086/513203 [DOI] [PubMed] [Google Scholar]
- 12.Swenson JM, Anderson KF, Lonsway DR, Thompson A, McAllister SK, Limbago BM, Carey RB, Tenover FC, Patel JB. 2009. Accuracy of commercial and reference susceptibility testing methods for detecting vancomycin-intermediate Staphylococcus aureus. J. Clin. Microbiol. 47:2013–2017. 10.1128/JCM.00221-09 [DOI] [PMC free article] [PubMed] [Google Scholar]
- 13.Wootton M, MacGowan AP, Walsh TR, Howe RA. 2007. A multicenter study evaluating the current strategies for isolating Staphylococcus aureus strains with reduced susceptibility to glycopeptides. J. Clin. Microbiol. 45:329–332. 10.1128/JCM.01508-06 [DOI] [PMC free article] [PubMed] [Google Scholar]
- 14.Wootton M, Howe RA, Hillman R, Walsh TR, Bennett PM, MacGowan AP. 2001. A modified population analysis profile (PAP) method to detect hetero-resistance to vancomycin in Staphylococcus aureus in a UK hospital. J. Antimicrob. Chemother. 47:399–403. 10.1093/jac/47.4.399 [DOI] [PubMed] [Google Scholar]
- 15.Braissant O, Bonkat G, Wirz D, Bachmann A. 2013. Microbial growth and isothermal microcalorimetry: growth models and their application to microcalorimetric data. Thermochimica Acta 555:64–71. 10.1016/j.tca.2012.12.005 [DOI] [Google Scholar]
- 16.Braissant O, Wirz D, Göpfert B, Daniels AU. 2010. Use of isothermal microcalorimetry to monitor microbial activities. FEMS Microbiol. Lett. 303:1–8. 10.1111/j.1574-6968.2009.01819.x [DOI] [PubMed] [Google Scholar]
- 17.López D, Viñas M, Lorén JG, Bermúdez J. 1987. Analysis of microcalorimetric curves for bacterial identification. Can. J. Microbiol. 33:6–11. 10.1139/m87-002 [DOI] [PubMed] [Google Scholar]
- 18.Sakwinska O, Kuhn G, Balmelli C, Francioli P, Giddey M, Perreten V, Riesen A, Zysset F, Blanc DS, Moreillon P. 2009. Genetic diversity and ecological success of Staphylococcus aureus strains colonizing humans. Appl. Environ. Microbiol. 75:175–183. 10.1128/AEM.01860-08 [DOI] [PMC free article] [PubMed] [Google Scholar]
- 19.Entenza JM, Veloso TR, Vouillamoz J, Giddey M, Majcherczyk P, Moreillon P. 2011. In vivo synergism of ceftobiprole and vancomycin against experimental endocarditis due to vancomycin-intermediate Staphylococcus aureus. Antimicrob. Agents Chemother. 55:3977–3984. 10.1128/AAC.00402-11 [DOI] [PMC free article] [PubMed] [Google Scholar]
- 20.Baldoni D, Hermann H, Frei R, Trampuz A, Steinhuber A. 2009. Performance of microcalorimetry for early detection of methicillin resistance in clinical isolates of Staphylococcus aureus. J. Clin. Microbiol. 47:774–776. 10.1128/JCM.02374-08 [DOI] [PMC free article] [PubMed] [Google Scholar]
- 21.von Ah U, Wirz D, Daniels AU. 2009. Isothermal micro calorimetry–a new method for MIC determinations: results for 12 antibiotics and reference strains of E. coli and S. aureus. BMC Microbiol. 9:106. 10.1186/1471-2180-9-106 [DOI] [PMC free article] [PubMed] [Google Scholar]
- 22.Cui L, Tominaga E, Neoh HM, Hiramatsu K. 2006. Correlation between reduced daptomycin susceptibility and vancomycin resistance in vancomycin-intermediate Staphylococcus aureus. Antimicrob. Agents Chemother. 50:1079–1082. 10.1128/AAC.50.3.1079-1082.2006 [DOI] [PMC free article] [PubMed] [Google Scholar]
- 23.Bizzini A, Greub G. 2010. Matrix-assisted laser desorption ionization time-of-flight mass spectrometry, a revolution in clinical microbial identification. Clin. Microbiol. Infect. 16:1614–1619. 10.1111/j.1469-0691.2010.03311.x [DOI] [PubMed] [Google Scholar]
- 24.van Belkum A, Dunne WM., Jr 2013. Next-generation antimicrobial susceptibility testing. J. Clin. Microbiol. 51:2018–2024. 10.1128/JCM.00313-13 [DOI] [PMC free article] [PubMed] [Google Scholar]
- 25.Sieradzki K, Roberts RB, Haber SW, Tomasz A. 1999. The development of vancomycin resistance in a patient with methicillin-resistant Staphylococcus aureus infection. N. Engl. J. Med. 340:517–523. 10.1056/NEJM199902183400704 [DOI] [PubMed] [Google Scholar]
- 26.Tenover FC, Weigel LM, Appelbaum PC, McDougal LK, Chaitram J, McAllister S, Clark N, Killgore G, O'Hara CM, Jevitt L, Patel JB, Bozdogan B. 2004. Vancomycin-resistant Staphylococcus aureus isolate from a patient in Pennsylvania. Antimicrob. Agents Chemother. 48:275–280. 10.1128/AAC.48.1.275-280.2004 [DOI] [PMC free article] [PubMed] [Google Scholar]
Associated Data
This section collects any data citations, data availability statements, or supplementary materials included in this article.