

ABSTRACT
Engineered alphavirus vectors expressing reporters of infection have been used for a number of years due to their relatively low costs for analysis of virus replication and the capacity to utilize imaging systems for longitudinal measurements of growth within single animals. In general, these vectors have been derived from Old World alphaviruses using a second viral subgenomic promoter to express the transgenes, placed either immediately after the nonstructural proteins or at the 3′ end of the viral coding sequences. However, the relevance of these vectors to natural infections is questionable, as they have not been rigorously tested for virulence in vivo in comparison with parental viruses or for the retention of the reporter during replication. Here, we report construction of new expression vectors for two Old World arthritogenic alphaviruses (Sindbis and Chikungunya viruses) and two New World encephalitic alphaviruses (eastern and Venezuelan equine encephalitis viruses) based upon either fusion of the reporter protein in frame within nonstructural protein 3 (nsP3) or insertion of the reporter as a cleavable element between the capsid and PE2 structural proteins. We have compared these with a traditional 3′ double subgenomic promoter virus expressing either a large, firefly luciferase (fLuc; 1,650 nucleotides), or small, NanoLuc (nLuc; 513 nucleotides), luminescent reporter protein. Results indicate that the nLuc is substantially more stable than fLuc during repeated rounds of infection regardless of the transgene location. However, the capsid-PE2 insertion and nsP3 fusion viruses exhibit the most authentic mimicking of parental virus infection regardless of expressed protein.
IMPORTANCEin vivoin vivoin vivo
INTRODUCTION
Viruses expressing reporters of infection or heterologous immunogens have been used for a number of years to track the replication of viruses in vitro and in animals and to elicit antigen-specific immune responses (1). With RNA viruses, these types of vectors exhibit two major deficiencies: the potential for rapid transgene loss and attenuation of virus replication, particularly in vivo, due to effects of insertion of the heterologous gene upon virus replication and host response (2; K. D. Ryman and W. M. Klimstra, unpublished data). These factors affect both vaccine vectors and infection-tracking viruses, as both require quantitative and longitudinal association of transgene expression with virus replication and full replication competence of the reporter virus for authentic tissue targeting and antigen expression. With vaccine vectors it is preferable to confer attenuation through insertion of known attenuating mutations as opposed to the poorly defined attenuating effects of the design of the expression vector.
Multiple strategies have been utilized to express heterologous genetic elements from alphavirus propagative virus and nonpropagative replicon vectors. Such vectors have been used as vaccines, indicators of therapeutic treatment efficacy, and reporters for virus replication in vivo (for examples, see references 2 to 9). The most common strategy for propagative viruses is a reiterated subgenomic promoter, located either immediately upstream (5′ 26S [2, 9–11]) of the authentic subgenomic promoter or, more commonly, downstream of the E1 protein (3′ DP [2, 9, 10, 12]) (Fig. 1). This approach yields protein expression with the timing and extent of the structural protein genes that are produced later in infection and to high levels (1). Another approach, thought to be more stable, is fusion of the reporter in the poorly conserved carboxy-terminal half of nonstructural protein 3 (nsP3) (7, 13, 14). This placement detects translation of the incoming genomic RNA as well as translated full-length progeny genomes (1). However, both the nsP3 fusion and 5′ DP strategies express transgenes at lower levels than the 3′ DP (2, 15; Ryman and Klimstra, unpublished), and the 5′ 26S promoter vectors are less effective vaccine vectors than 3′ DP vectors, likely due to the expression difference (2, 15). However, each of these strategies suffers from a possible loss of expression of the transgene (2, 9, 11) and potential attenuation of the vector (Ryman and Klimstra, unpublished) such that infection with the reporter viruses may not accurately model the replication and disease characteristics of the parental, unmodified viruses. Furthermore, the relative virulence of these viruses and transgene stability have not been examined as a function of transgene length and genome placement.
FIG 1.

Diagram of virus and expression vector genomes. (A) Genome structure and genes of unmodified parental alphaviruses. (B) 3′ DP expression virus. (C) nsP3 fusion expression virus. (D) TaV expression virus. (E) Amino acid sequences and restriction enzyme cleavage site positions in the nsP3 protein for reporter insertion in each alphavirus. (F) Structure of reporter insertion site for TaV viruses. Amino acid sequences in the area of the capsid autoprotease site and the sequence of the Thosea asigna virus 2A-like protease are shown. The TaV 2A-like protease “cleaves” nascent proteins by preventing formation of a phosphodiester bond between the carboxy-terminal glycine and proline in the protease sequence (18).
Here, we report novel modifications of cDNA clones of two encephalitic New World alphaviruses, wild-type (WT) eastern equine encephalitis (EEEV) and Venezuelan equine encephalitis (VEEV) viruses, and two arthritogenic Old World alphaviruses, wild-type Sindbis (SINV) and Chikungunya (CHIKV) viruses, to express firefly luciferase (fLuc; 1,650 nucleotides [nt]) or a new, shorter luminescent protein, NanoLuc (nLuc; 513 nt), recently developed by Promega Corporation (16). These were inserted either into a traditional 3′ DP vector, as an nsP3 fusion into the region described for SINV (14), or between the capsid and PE2 proteins, as an autocleaving element as described previously (17), but improved by using the highly efficient Thosea asigna virus (TaV) 2A-like protease (18). Transgene expression, stability, and virulence of the vectors in animals were then compared.
Using nLuc and fLuc as model reporters expressed from SINV, in vitro serial-passage studies showed that the TaV and 3′ DP virus expression of nLuc was highly stable. However, expression of the fLuc gene was rapidly lost from both sites at similar rates. nLuc expression was also more stable than fLuc expression as a fusion with nsP3. Relative light units (RLUs) expressed by nLuc vectors were approximately 2 orders of magnitude higher than those expressed by fLuc vectors, which was expected due to the differences in light emitted per molecule (16). Regardless of the expressed protein, expression from the 3′ DP was attenuating for all viruses versus unmodified versions in a mouse model of disease. However, infection of mice with the nsP3 and TaV expression constructs for nLuc resulted in rates of mortality and survival times similar to those of unmodified viruses, while fLuc was attenuating in all circumstances. Virulence testing of the green fluorescent protein (GFP) gene (758 nt)-expressing TaV and 3′ DP viruses revealed similar results. This suggests that with reporter genes of ∼750 nt or less, expression as a cleavable component of the subgenomic polyprotein can be used to closely mimic infection and disease caused by unmodified viruses. Therefore, the TaV and nsP3 expression systems have potential for use in study of viral pathogenesis, as an indicator of antiviral drug efficacy or as efficiently replicating vaccine vectors in vivo.
MATERIALS AND METHODS
Viruses.
Construction of cDNA clones for the wild-type EEEV strain FL93-939 (19), VEEV strain ZPC738 (20), CHIKV strain La Réunion (LR) (9), and SINV strain TR339 (21) have been described previously. FL93-939 and ZPC738 cDNA clones were generously provided for these studies by Scott Weaver (University of Texas Medical Branch, Galveston, TX). The SINV DP reporter virus (SINV 3′ DP-fLuc), derived from TR339 and expressing fLuc from a second copy of the subgenomic promoter, was described previously (22). The SINV 3′DP-nLuc virus plasmid was constructed by replacement of the corresponding fLuc region of the SINV 3′DP-fLuc with a Flag-tagged nLuc gene (nLuc-Flag). Capsid fusion reporter alphaviruses expressing reporter proteins (enhanced GFP [eGFP], mCherry, fLuc, or nLuc) as a cleavable in-frame fusion between the capsid and E3 proteins were constructed essentially as described previously (17), except that the QuikChange II XL mutagenesis kit (Agilent) was used to insert a PCR fragment at the capsid/E3 junction that encoded the first five amino acids of E3 fused in frame to reporter genes followed by the TaV 2A-like protease. The nsP3 fusion reporter alphaviruses, with the exception of EEEV, were created by introducing a unique restriction enzyme FseI site at the corresponding positions in the nsP3 protein using QuikChange mutagenesis and inserting the reporter genes (eGFP, mCherry, fLuc, or nLuc) using the unique enzyme. The EEEV nsP3 fusion nLuc virus was constructed by inserting the PCR fragment of the nLuc gene with two AgeI sites into the nonconserved nsP3 region of the FL93-939 backbone cDNA clone by QuikChange mutagenesis. All of the newly made reporter virus plasmids were verified by DNA sequencing.
Infectious viral RNAs were generated by in vitro transcription (mMessage mMachine; Ambion) from cDNA plasmid templates, linearized with either XhoI or NotI as appropriate, and electroporated into BHK-21 cells. Virus particles were harvested from the supernatant 18 to 24 h after electroporation when cytopathic effect (CPE) was evident, clarified of cell debris by centrifugation, and stored at −80°C in single-use aliquots. Virus stock titers were determined by standard BHK-21 cell plaque assay, and titers were expressed as PFU/ml.
Virus growth curves, transgene stability, and luciferase expression.
BHK-21 cells were infected at a multiplicity of infection (MOI) of 0.1 PFU/cell (low MOI) or 5 PFU/cell (high MOI). After 1 h of incubation, cells were washed with Dulbecco's phosphate-buffered saline (DPBS)–1% donor bovine serum (DBS), and appropriate medium was replaced before cells were incubated (37°C and 5% CO2). At time zero and subsequent times postinfection (p.i.), the supernatant was harvested for titration by plaque assay, infected cells were washed with DPBS, and cell lysates were harvested with 1× passive lysis buffer for fLuc or nLuc activity assays using a luciferase assay system or Nano-Glo luciferase assay, respectively, as recommended by the manufacturer (Promega).
BHK-21 cells were infected with viral stocks of SINV reporter viruses at an MOI of 0.1 PFU/cell, and a passage 1 (P1) viral stock was harvested 18 h p.i. The viral stocks were then serially passaged after a 1:1,000 dilution for infection of fresh cells. At 18 h p.i., virus-containing supernatants from P1 through P10 were harvested for titration by plaque assay, and cell lysates were harvested with 1× passive lysis buffer for activity assay. In parallel, protein lysates were harvested with whole-cell extract lysis buffer containing protease and phosphatase inhibitor cocktails for Western blot analysis (as in reference 23). For assays of luminescence/100 PFU, stock or passage virus or supernatants of tissue homogenates were diluted to 100 PFU and BHK cells were infected. Eight hours p.i., a luciferase activity assay was performed on the BHK cell lysates.
Western blotting.
For whole-cell extract lysates from each virus, equal quantities (μg of total protein) were resolved by 10% SDS-PAGE, transferred to a polyvinylidene difluoride (PVDF) membrane, and stained with appropriate primary and horseradish peroxidase (HRP)-conjugated secondary antibodies (against either fLuc [Promega] or Flag [LifeTein]). The membrane was imaged using Amersham ECL Prime Western blotting detection reagents, followed by exposure to Amersham Hyperfilm ECL (GE Healthcare).
Mouse infections and in vivo imaging.
Five-day-old outbred CD-1 mice were infected with 1,000 PFU of SINV vectors subcutaneously in the ventral thorax region. Six- to 8-week-old CD-1 mice were infected with 1,000 PFU of EEEV vectors subcutaneously in the right rear footpad. All viruses were “stock,” derived from virus production reactions and unpassaged. Mice were monitored for mortality and morbidity for at least 10 days. Groups of mice were sacrificed at various intervals for tissue luciferase activity assays. All tissues were initially homogenized in 1× passive lysis buffer (Promega) followed by freezing at −80°C and analysis. Adult C57BL/6 IFNAR1−/− mice (3 per group) were infected in both hind limb footpads with 1,000 PFU of either TR339 fLuc-TaV or TR339 nLuc-TaV and imaged at 6, 24, or 48 h postinfection using an IVIS Spectrum CT instrument (PerkinElmer). Either of the luciferase substrates d-luciferin (fLuc; 3 mg/mouse) and furimazine (nLuc; 10 μg/mouse) (Promega) was administered intravenously in the tail vein. Mice were imaged for 2 s within 2 min of substrate administration, and photon flux (photons/second) was quantitated using Living Image software (Perkin-Elmer). All animal experiments were performed using University of Pittsburgh-approved protocols in compliance with guidelines of the Association for Accreditation and Assessment of Laboratory Animal Care (AAALAC).
Statistical analyses.
Statistical significance of differences in mortality curves was determined by Mantel-Cox log rank test, and for other experiments, Student's t test with two-sample equal variance was used (GraphPad PRISM software). All experiments were conducted at least twice, with similar results.
RESULTS
Growth and luminescence of luciferase expression vectors in vitro and stability of the transgene.
Virus constructs compared in the current studies are listed in Table 1 and the genomic structures are represented in Fig. 1. Stock titers, which can indicate effects of particular virus genome changes upon replication competence, were not distinctly (e.g., 100-fold) lower or higher than for unmodified parental viruses (Table 1).
TABLE 1.
Stock titers of viruses and reporters
| Reporter virusa | Expressed reporter | Parental virus | Stock titer (PFU/ml) |
|---|---|---|---|
| SINV | SINV TR339 | 3.00 × 10⁶ | |
| SINV nsP3-fLuc | Firefly luciferase | SINV TR339 | 1.20 × 10⁶ |
| SINV nsP3-nLuc | NanoLuc-Flag | SINV TR339 | 2.50 × 10⁶ |
| SINV 3′ DP-fLuc | Firefly luciferase | SINV TR339 | 2.70 × 10⁶ |
| SINV 3′ DP-nLuc | NanoLuc-Flag | SINV TR339 | 1.03 × 10⁷ |
| SINV TaV-fLuc | Firefly luciferase | SINV TR339 | 2.28 × 10⁷ |
| SINV TaV-nLuc | NanoLuc-Flag | SINV TR339 | 7.50 × 10⁶ |
| SINV TaV-GFP | GFP | SINV TR339 | 2.25 × 10⁷ |
| SINV TaV-cherry | mCherry | SINV TR339 | 3.00 × 10⁷ |
| CHIKV | CHIKV La Réunion | 1.18 × 10⁸ | |
| CHIKV nsP3-nLuc | NanoLuc | CHIKV La Réunion | 1.55 × 10⁸ |
| CHIKV TaV-nLuc | NanoLuc | CHIKV La Réunion | 1.13 × 10⁸ |
| CHIKV TaV-GFP | GFP | CHIKV La Réunion | 2.13 × 10⁸ |
| CHIKV TaV-cherry | mCherry | CHIKV La Réunion | 2.93 × 10⁸ |
| EEEV | EEEV FL93-939 | 1.90 × 10⁹ | |
| EEEV nsP3-fLuc | Firefly luciferase | EEEV FL93-939 | 3.00 × 10⁷ |
| EEEV nsP3-nLuc | NanoLuc | EEEV FL93-939 | 3.00 × 10⁸ |
| EEEV DP-fLuc | Firefly luciferase | EEEV FL93-939 | 2.35 × 10⁷ |
| EEEV DP-nLuc | NanoLuc | EEEV FL93-939 | 1.28 × 10⁸ |
| EEEV TaV-fLuc | Firefly luciferase | EEEV FL93-939 | 2.60 × 10⁸ |
| EEEV TaV-nLuc | NanoLuc | EEEV FL93-939 | 2.70 × 10⁸ |
| EEEV TaV-GFP | GFP | EEEV FL93-939 | 1.45 × 10⁹ |
| EEEV TaV-cherry | mCherry | EEEV FL93-939 | 2.30 × 10⁹ |
| VEEV | VEEV ZPC738 | 2.58 × 10⁷ | |
| VEEV nsP3-nLuc | NanoLuc | VEEV ZPC738 | 2.25 × 10⁶ |
| VEEV TaV-nLuc | NanoLuc | VEEV ZPC738 | 1.03 × 10⁷ |
| VEEV TaV-GFP | GFP | VEEV ZPC738 | 1.50 × 10⁷ |
| VEEV TaV-cherry | mCherry | VEEV ZPC738 | 1.83 × 10⁷ |
nsP3, fusion of reporter in frame in nsP3; 3′ DP, reiterated reporter-expressing subgenomic promoter after E1; TaV, fusion as cleavable element between capsid and PE2.
To examine detailed kinetics of luminescent signal expression from each virus, we chose to use SINV vectors due to the ease of production and experimentation at biosafety level 2 (BSL2). We infected BHK cells with equal MOIs of each virus harvested directly from the virus production electroporation reaction and equivalent to the beginning stock in the passage series (described below). Titration of virus at an MOI of 0.1 showed a distinct lag in the replication of the 3′ DP-fLuc virus at 12 h p.i. (P < 0.01); at 24 h p.i., the DP- and TAV-nLuc virus and the TaV-mCherry virus titers were not significantly different from that of wild-type TR339 (P > 0.05 [Fig. 2A]). The three fLuc-expressing viruses replicated to the lowest titers at 24 h p.i. Luminescence from these viruses reflected the titer, as well as effects of gene location and luminescence per molecule (Fig. 2B). Regarding nLuc expression, the TaV and DP viruses exhibited similar luminescence levels over the course of replication. Luminescence from the nsP3 nLuc virus was approximately 1 to 1.5 logs lower, as would be expected from the lower abundance of the genomic mRNA. Luminescence from fLuc-expressing viruses was similarly lower than from nLuc-expressing counterparts, which was expected from the activity differences of the two proteins on their respective substrates (16). As with titer, the luminescence from 3′ DP-fLuc virus was significantly lower than that from TaV-fLuc virus at all but the earliest times (P < 0.01 [Fig. 2B]). Using an MOI of 5 to eliminate spread from consideration, nLuc was clearly more sensitive than fLuc in all expression settings, with luminescence values for paired viruses differing 5- to 10-fold at 1 to 2 h p.i. (Fig. 2C). Moreover, nLuc was readily detectable from all viruses even 1 h p.i.
FIG 2.
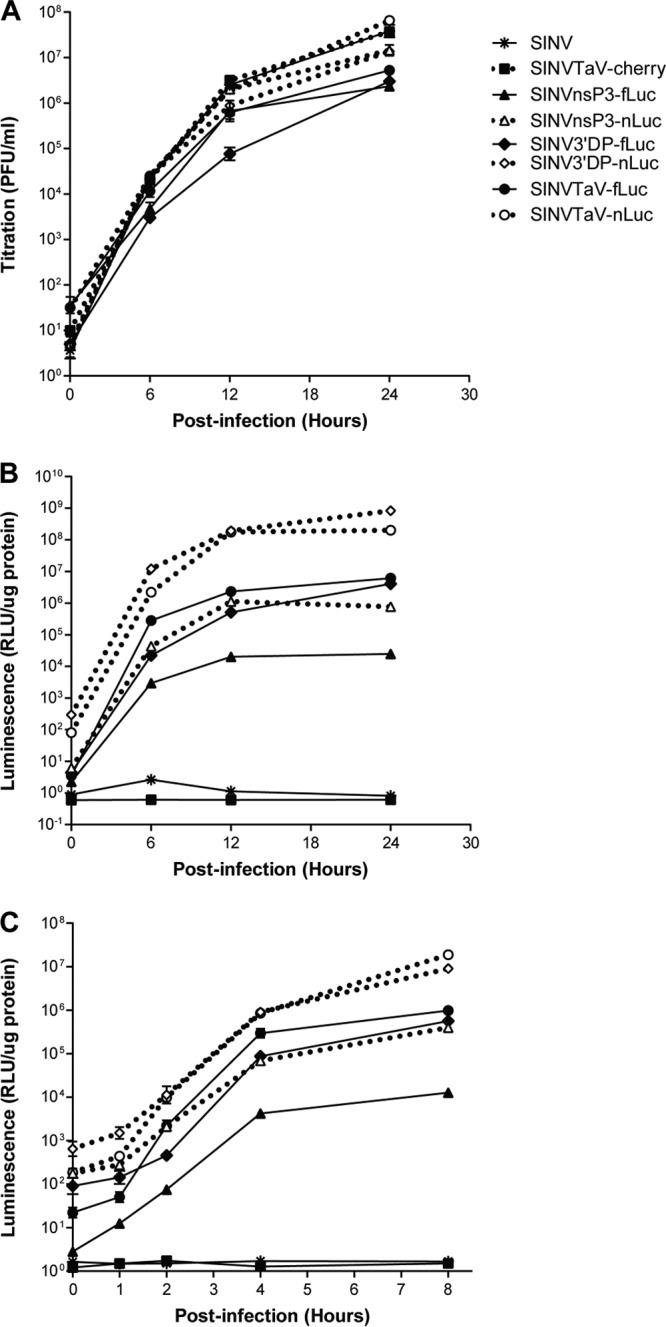
In vitro growth rates and luminescence expression for SINV expression viruses. BHK-21 cells were infected for 1 h with each indicated virus at an MOI of 0.1 (A and B) or 5 (C) BHK PFU/cell, and supernatants (A) or lysates (B and C) were harvested at the indicated times for plaque titration or in vitro luciferase assay as described in Materials and Methods. Error bars indicate standard deviations.
To examine the in vitro stability and expression of the two luciferase proteins in the different expression contexts, we passaged serially 10 times each SINV fLuc- and nLuc-expressing virus on BHK-21 cells. We began with an MOI of 0.1 and then diluted supernatants 1:1,000 between infections and examined the virus titer and luciferase expression after each passage. This was done to avoid accumulation of defective interfering particles and to model changes that might occur in vivo where MOI is uncontrolled. Titers for all viruses increased between 1 and 3 orders of magnitude across the passage series, due in part to the previously documented acquisition of heparan sulfate (HS)-binding mutations in the TR339 strain and the concomitant increase in particle infectivity for the indicator BHK-21 cells that occurs across the first several passages in this type of series (21) (Fig. 3).
FIG 3.

Titration of virus replication and luminescence expression for SINV expression viruses over 10 passages in BHK-21 cells. BHK-21 cells were infected with an MOI of 0.1 PFU/cell (P1) and then incubated for 18 h. Supernatants were then harvested and diluted 1:1,000, followed by infection of fresh cells. This was continued for 10 passages (P1 to P10). During each passage, infected cells or supernatants were harvested for plaque titration (right y axis) or in vitro luciferase assay (left y axis) as described in Materials and Methods. (A) TaV-fLuc; (B) nsP3-fLuc; (C) DP-fLuc; (D) TaV-nLuc; (E) nsP3-nLuc; (F) DP-nLuc. Error bars indicate standard deviations.
Luciferase luminescence levels exhibited a very different profile. Upon passage, all viruses containing fLuc rapidly lost expression of the transgene (Fig. 3A to C). By P6 (nsP3-fLuc) to P8 (3′ DP-fLuc and TaV-fLuc), luciferase expression from these viruses had dropped to near background for unmodified TR339 (between 1 and 10 RLU/μg). However, plaque titers for these viruses remained as high as or higher than for the TR339 stock by these passages. Remarkably, luminescence values for the nLuc viruses were changed <2-fold across the passage series, with the exception of the 3′ DP-nLuc at P10 (Fig. 3D to F). As expected, the luminescence observed in nLuc-expressing virus-infected cells after the first passage was ∼100-fold higher than derived from fLuc-expressing virus-infected cells, consistent with the higher activity of the nLuc protein (16), and nsP3 virus values were multiple logs lower than those driven from a subgenomic promoter (Fig. 3). The 3′ DP-nLuc virus luminescence values were slightly and not always significantly (P < 0.05) higher than those from the TaV-nLuc virus (Fig. 3D and F). These phenotypes were recapitulated in Western blot analyses of transgene and virus proteins for each of the passages, although fLuc expression was undetectable by this assay after P4 (Fig. 4). Transgene expression was not detectable from either of the nsP3 viruses by Western blotting, likely due to disruption of conformation of the fusion proteins (data not shown).
FIG 4.
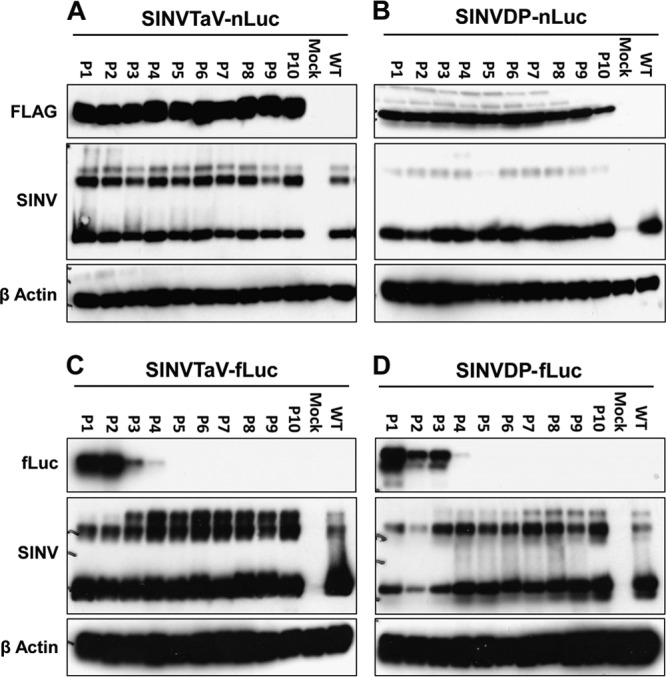
Western blot of luciferase production from SINV expression viruses over 10 passages in BHK-21 cells. BHK-21 cells were infected and 10 passages completed as for Fig. 3, but lysates were used for an anti-Flag (A and B) or an anti-fLuc (C and D) Western blots as described in Materials and Methods.
Given the high stability and expression level of protein from the TaV-nLuc virus, we compared the kinetics of expression of nLuc by the P1 versus the P10 virus over the first 8 h p.i. at different MOIs (Fig. 5A). At multiple MOIs below 1, both viruses initiated infection, indicating that the plaque assay conditions were less sensitive to infectious viruses than infection. At the lowest MOI, the P1 virus did not appear to infect the cells, most likely due to the non-HS-binding phenotype of minimally passaged TR339. In contrast, the P10 virus, which had likely acquired an efficient HS-binding phenotype (21) and may have acquired other mutations improving replication in BHK cells, infected cells and produced luminescence. As the MOI increased, expression from the P1 viruses became more similar to that from the P10 strain, reflecting the infection of a higher percentage of cells and limited viral spread to uninfected cells. At the highest MOI (50), kinetics of expression between the P10 and P1 viruses were very similar, although the passaged virus was still higher at 2 and 4 h p.i. (P < 0.01). Together, these data suggest that the early kinetics of luciferase expression from the TaV-nLuc viruses are very similar to that with stock viruses even after 10 passages in BHK cells. We directly measured this phenotype by assessing the luciferase signal from 100 PFU of stock virus and passage 10 virus (Fig. 5B). Consistent with the growth curve and Western blot data, the luciferase expression/plaque ratios remained unchanged for the nLuc viruses over the 10 passages (P > 0.05), but the three fLuc viruses were, by passage 10, all at the level of detection of the assay, representing a 4.5- to 6-log reduction in luminescence expression over the 10 passages.
FIG 5.
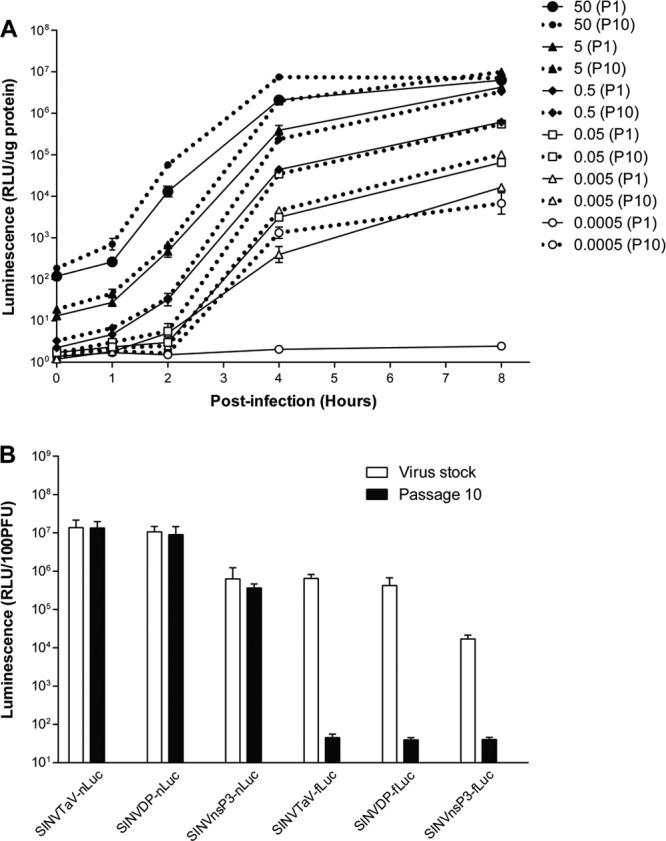
Luminescence expression after infection of BHK cells with P1 and P10 viruses. (A) BHK-21 cells were infected for 1 h with the indicated MOI of the TAV-nLuc virus derived from BHK P1 or from P10. Cells were harvested for in vitro luciferase assay at 1-h intervals through 8 h p.i. (B) For the indicated viruses, BHK-21 cells were infected with dilutions of either stock (open bars) or P10 viruses (solid bars) and the luminescence derived from 100 BHK PFU was measured at 8 h p.i. The limit of detection of the assay was between 1 and10 RLU/μg of protein. Error bars indicate standard deviations.
Finally, we compared expression of nLuc from the TaV and nsP3 vectors derived from wild-type strains of SINV, CHIKV, EEEV, and VEEV in a one-step growth curve to determine if the levels of expression from the viruses were similar (Fig. 6). The extent and kinetics of nLuc expression were very similar for all the viruses, although TaV-nLuc-expressing SINV and EEEV produced higher luminescence values than the other viruses at 1 or 2 h p.i. (P < 0.05). Notably, for all viruses, expression was significantly above background immediately following the 1-h infection period (0 h p.i.). This suggests that virus replication at very early times p.i. can be measured by tracking nLuc expression. Differences between genome locations of the inserts were evident, as the nsP3-nLuc luminescence values were ∼2 logs lower than those of TaV-nLuc for all viruses at 8 h p.i.
FIG 6.
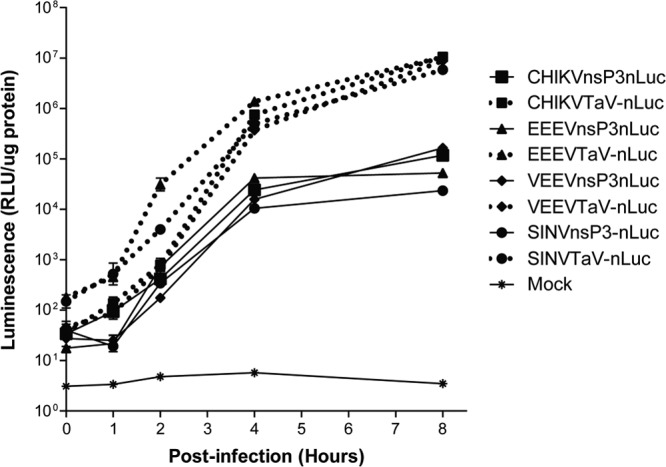
Luminescence expression from different alphaviruses. BHK-21 cells were infected with the indicated viruses and lysates collected at 1-h intervals through 8 h p.i. for in vitro luciferase analysis. Error bars indicate standard deviations.
Virulence of viruses in vivo.
We chose SINV as a representative of Old World arthritogenic viruses and EEEV as a representative of New World encephalitic viruses for mouse virulence testing. In these studies, we compared wild-type versions of each virus with fLuc- and nLuc-expressing versions of the nsP3, DP, and TaV viruses. The subcutaneous route was chosen, as this mimicked the natural infection route and provided a stringent test for virulence. For SINV infection of 5-day-old mice (the oldest mice for which subcutaneous inoculation with TR339 causes 100% mortality [24]), all animals infected with unmodified parental TR339 reached euthanasia criteria by 9 days p.i. (Table 2). Like TR339, the TaV-nLuc-expressing SINV caused 100% mortality rate, while the nsP3-nLuc-expressing SINV was the next most virulent, causing 75% mortality. However, the average survival times (ASTs) for both groups of animals were significantly longer. The 3′ DP-nLuc virus and all viruses expressing fLuc caused less than 100% mortality. The 3′ DP viruses expressing either protein were the most attenuated, causing mortality rates of 0 to 30%.
TABLE 2.
Virulence data for SINV and EEEV reporters in CD-1 mice
| Reporter virus | No. of animalsa | AST (days), mean ± SD | % mortality | AST difference with parental virusb |
|---|---|---|---|---|
| SINV | 20 | 5.5 ± 1.7 | 100 | |
| SINV nsP3-fLuc | 20 | 10.8 ± 5.5 | 30 | Y; P < 0.001 |
| SINV nsP3-nLuc | 20 | 6.6 ± 1.3 | 75 | Y; P < 0.001 |
| SINV 3′ DP-fLuc | 20 | 8.0 ± 1.2 | 25 | Y; P < 0.001 |
| SINV 3′ DP-nLuc | 20 | 0 | Y; P < 0.001 | |
| SINV TaV-fLuc | 20 | 0 | Y; P < 0.001 | |
| SINV TaV-nLuc | 20 | 7.8 ± 1.4 | 100 | Y; P < 0.001 |
| EEEV | 5 | 4.9 ± 0.4 | 100 | |
| EEEV nsP3-fLuc | 5 | 7.0 ± 0.0 | 20 | Y; P < 0.01 |
| EEEV nsP3-nLuc | 5 | 4.7 ± 0.6 | 100 | N; P > 0.05 |
| EEEV DP-fLuc | 5 | 6.0 ± 0.9 | 60 | Y; P < 0.01 |
| EEEV DP-nLuc | 5 | 7.2 ± 0.3 | 60 | Y; P < 0.01 |
| EEEV TaV-fLuc | 5 | 6.4 ± 1.3 | 80 | Y; P < 0.05 |
| EEEV TaV-nLuc | 5 | 4.7 ± 1.0 | 100 | N; P > 0.05 |
| EEEV DP-eGFP | 5 | 6.8 ± 1.8 | 40 | Y; P < 0.01 |
| EEEV TaV-eGFP | 5 | 5.6 ± 0.5 | 100 | Y; P < 0.05 |
For SINV vectors, 5-day-old CD-1 mice; for EEEV vectors, 6-week-old CD-1 mice.
Y, yes; N, no. Significance value from Mantel/Cox log rank test.
With EEEV, the pattern was similar, as the nsP3 and DP viruses expressing nLuc caused 100% mortality, with an AST not significantly different from that of the WT (Table 2). DP- and TaV-eGFP-expressing viruses were included in these experiments to test a slightly larger expression cassette expressing the commonly used GFP reporter. As with nLuc, the DP-eGFP virus caused less than 100% mortality and exhibited an extended AST, but the TaV-eGFP virus was uniformly lethal, with only a slightly extended AST versus that of parental unmodified EEEV.
Replication of viruses and luciferase expression in vivo.
To evaluate reporter expression and retention of expressed genes after replication in vivo, we harvested spleen and brain from mice infected with SINV expression vectors at 1 and 6 days p.i. or footpad and brain from EEEV expression vector-infected mice at 1 and 4 days p.i., representing early and late stages of disease for each virus. The virus titer and luminescence signal were determined for each tissue (Fig. 7) in a series of in vitro assays.
FIG 7.

Luminescence values for tissues harvested from SINV- or EEEV-infected mice. Mice were infected with 1,000 BHK PFU of each indicated virus either in the ventral thorax region (SINV) or in the right rear footpad (EEEV). With SINV, aliquots of spleen (A and B) or brain (C and D) were subjected to plaque titration (A and C) or in vitro luciferase assay (B and D) at either 1 day (open bars) or 6 days (solid bars) p.i. (dpi). With EEEV, aliquots of tissue from the injection site (E and F) or brain (G and H) were subjected to plaque titration (E and G) or in vitro luciferase assay (F and H) at either 1 day (open bars) or 4 days (solid bars) p.i. Error bars indicate standard deviations.
With SINV in spleen, titers of the TaV-nLuc and nsP3-nLuc viruses were equal to or above those of TR339 at both 1 and 6 days p.i. (Fig. 7A). All other luciferase-expressing viruses exhibited significantly lower titers than TR339 at 1 day p.i. (P < 0.01). The TR339 titer was below the limit of detection at 6 days p.i. The luciferase signal from the TaV-nLuc virus was the highest of all viruses at 1 day p.i., decreasing ∼10-fold by 6 days p.i. All other viruses were significantly lower at 1 day p.i. (P < 0.001 [Fig. 7B]). This was expected for the nsP3 viruses, reflecting the abundance of the encoding RNA in the genomic versus the subgenomic RNA. A very low luciferase signal was detected from the DP-fLuc and nsP3 fLuc viruses (∼1,000 RLU) at 1 day p.i., and the signal at 6 d p.i. was at background (equivalent to that of the unmodified parental TR339). In general, the luciferase signal did not appear to covary with virus titer over time, often remaining high as viral titers fell. This is not unexpected, as the luciferase signal indicates viral gene expression within infected cells or tissues, whereas plaque assay measures released infectious viral particles.
A similar pattern was observed in the brain, with the exception that virus titers decreased less between 1 and 6 days p.i. than in the spleen (Fig. 7C). Again, the plaque titers of the TaV-nLuc and nsP3-nLuc viruses were similar to those of the unmodified parental TR339, while those of all other viruses were significantly lower (P < 0.05). The nLuc-expressing viruses produced the highest luminescence on both days, with the TaV-fLuc virus producing a moderate signal and the DP- and nsP3-fLuc viruses producing signal near or below the limit of detection of the assay (Fig. 7D). For the TaV-nLuc and DP-fLuc viruses, this represents almost a 4-log difference in signal at 1 day p.i. and a 6-log difference at 6 days p.i.
Infection of mice with the EEEV vectors showed a similar pattern. In this case, the footpad was chosen as the early site of replication, as the virus does not replicate well in lymphoid tissues (4). Titers of the TaV-nLuc and nsP3-nLuc viruses were similar to those of unmodified EEEV (P > 0.05) and decreased from 1 to 4 days p.i., which is the latest time the majority of the mice had not reached euthanasia criteria (Fig. 7E). The titers of TaV-fLuc, DP-fLuc, and nsP3-fLuc viruses were significantly lower on both days (P < 0.05), while the DP-nLuc titer was similar to that of parental virus at 4 days p.i. (P > 0.05). Luminescence values were the highest for TaV-nLuc virus at 1 day p.i., falling to the level of DP-nLuc virus by 4 days p.i. (Fig. 7F). Levels of expression from the nsP3-nLuc virus were similar at both times p.i. and, as expected, 1 to 2 logs lower than for the viruses expressing luciferase from a subgenomic promoter. The TaV-fLuc virus was similar to the nsP3-nLuc virus at 4 days p.i., while the DP- and nsP3-fLuc viruses were near the background level of the unmodified FL93-939 (15 RLU/g). For the highest-expressing viruses, luminescence values and plaque titer were fairly consistent between 1 and 4 days p.i.
Plaque titration in brain demonstrated that the TaV-nluc, DP-nLuc, nsP3-nLuc, and parental viruses were similar, at ∼1 × 10⁴ PFU/g, at 1 day p.i. (P > 0.1 [Fig. 7G]). However, the nsP3-fLuc virus titer was slightly, but not significantly, lower (P > 0.05), and the TaV-fLuc and DP-fLuc viruses were not detectable. At 4 days p.i., TaV-nLuc and nsP3-nLuc virus titers were similar to that of the parent (P > 0.05), while TaV-fLuc virus replication was slightly lower (P < 0.05). The DP-nLuc, DP-fLuc, and nsP3-fLuc virus titers were all at least 1.5 logs lower and that of the DP-fLuc virus was >3 logs lower than that of the parental virus. As with SINV, luminescence values were highest for the Tav-nLuc and DP-nLuc viruses on both days, with the nsP3-nLuc virus reduced as expected considering genome placement (all P < 0.001 versus other viruses at 4 days p.i. [Fig. 7F]). Values for TaV-fLuc, DP-fLuc, and nsp3-fLuc viruses were significantly lower than those of their nLuc counterparts (P < 0.05), and all were comparable to that of unmodified parental virus at 1 day p.i., with DP-fLuc virus also below the limit of detection at 4 days p.i.
Finally, we considered retention of the transgene in vivo by performing a similar analysis of luminescence/100 PFU as described above for the in vitro passage using samples from brain, as this virus would have been subjected to multiple rounds of replication and dissemination in the mice (Fig. 8). With SINV, TaV- and DP-nLuc viruses exhibited the highest RLU/100 PFU: these and the nsP3-nLuc viruses were not significantly lower than the unpassaged stock virus at any time (P < 0.001), demonstrating that expression is very stable even after multiple replication rounds and dissemination in vivo (Fig. 8A). TaV-fLuc virus expression was similar to that of the stock at 1 day p.i. (P > 0.05) but dropped significantly by 6 days p.i. (P < 0.01). DP-fLuc and nsp3-fluc viruses were significantly lower than the stock at 1 (P < 0.05) and 6 (P < 0.001) days p.i. The pattern was similar with EEEV, as the TaV-nLuc and DP-nLuc brain-harvested viruses exhibited the greatest luminescence at 1 and 4 days p.i. (Fig. 8B), although the luminescence of the brain-harvested DP-nLuc virus was significantly lower than that of the stock virus at 1 (P < 0.01) and 4 (P < 0.05) days p.i. The TaV- and nsP3-nluc-expressing brain-harvested viruses were not significantly different from the stock at 4 days p.i. (P > 0.05). Of the fLuc-expressing viruses, none produced detectable PFU in samples at 1 day p.i. and all were significantly lower than the stock virus at 4 d p.i. (P < 0.05), with the DP- and nsP3-fLuc viruses >100-fold lower.
FIG 8.
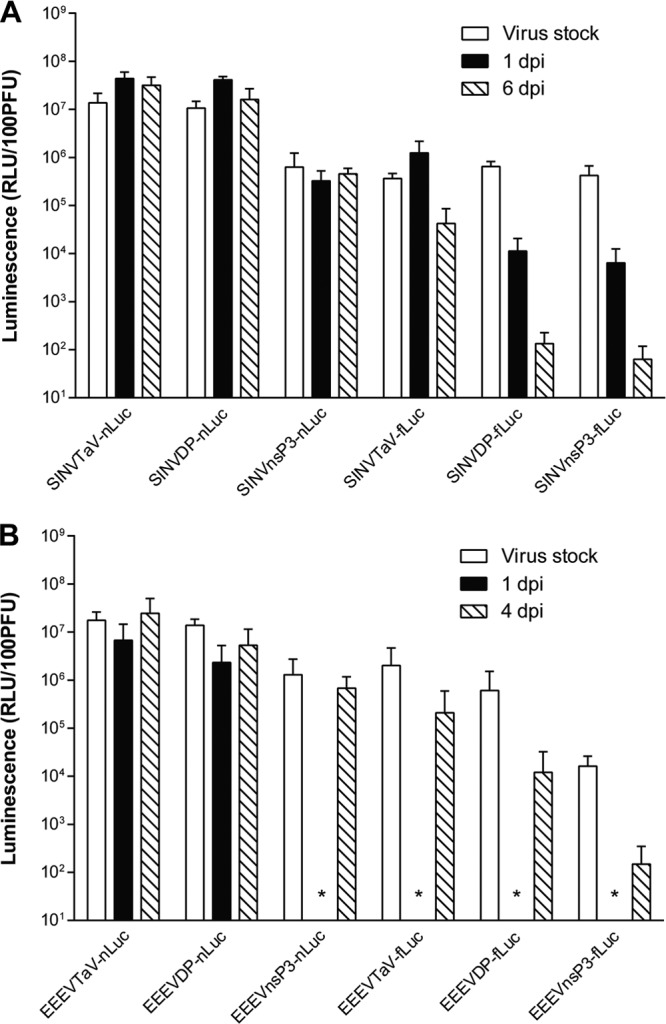
Luminescence expression for 100 BHK-21 PFU of stock and animal-passaged viruses derived from brain tissue. For SINV (A) or EEEV (B) viruses, BHK-21 cells were infected with dilutions of either stock virus (open bars) or viruses harvested from brain at early (hatched bars) or late (solid bars) times p.i. as indicated, and the luminescence derived from 100 BHK PFU was measured at 8 h p.i. The limit of detection of the assay was between 1 and 10 RLU/μg of protein. *, not done due to absence of infectious virus in tissue. Error bars indicate standard deviations.
Longitudinal in vivo imaging in live mice.
As a direct comparison between fLuc and nLuc for suitability for in vivo imaging, we infected C57BL/6 IFNAR1−/− mice (AB6) with TR339 TaV viruses expressing either protein and then performed imaging using an IVIS Spectrum CT instrument at 6, 24, and 48 h p.i. as described in Materials and Methods. At 6 h p.i., a signal was observable with both viruses at the footpad sites of infection and a site consistent with the inguinal or lumbar lymph nodes (LNs) which drain the footpads (25) (Fig. 9A and B). This initial replication was more visible at a 2-s exposure from the dorsal than the ventral view (Fig. 9A versus 9B). Quantitation of footpad signal indicated that the fLuc-emitted luminescence was ∼5-fold higher than that of nLuc (P < 0.05 [Fig. 9B]). This is likely a result of the increased absorption of the nLuc emission optimum (460 nm) versus the fLuc emission optimum (560 nm) by mouse tissues. Surprisingly, at 24 and 48 h p.i. (Fig. 9A and B), the fLuc signal was confined to the footpad and only occasionally visible in LNs, even with extended exposures (data not shown). In contrast, at 24 h p.i., an nLuc signal was observed in multiple areas of the mouse corresponding to the front footpads, the cervical lymph nodes, diffuse areas in the abdominal region, the snout, and the tail, and this signal continued to expand through 48 h p.i. When quantitated, the footpad signal with fLuc remained slightly higher (Fig. 9C); however, by 24 h, the total body signal (excluding footpad) from nLuc was ∼1 log higher (P < 0.05), and by 48 h p.i., it was ∼2 logs higher (P < 0.001 [Fig. 9C]). When mice were euthanized at 48 h p.i. and peritoneal and chest cavities exposed, a disseminated signal from the nLuc virus was observed, particularly in skin, and was essentially found throughout the animals (Fig. 9D). However, the fLuc signal was restricted to a small number of tissues, including the footpad, lungs, and punctate areas within the peritoneal cavity. The overall signal from the mouse body was >2 logs higher with nLuc (P < 0.001 [Fig. 9E]).
FIG 9.

Longitudinal in vivo imaging of SINV nLuc-TaV and fLuc-TaV viruses in IFNAR1−/− mice. Mice were infected with 39nLuc-TaV or 39fLuc-TaV viruses and imaged for 2 s as described in Materials and Methods at 6, 24, or 48 h p.i. with the dorsal side (A) or ventral side (B) toward the camera. “Mock” indicates mice that were left uninfected but administered the respective luciferase substrate. Luminescence was quantitated from three mice for the footpad injection sites or whole body excluding the injection site using the ventral view (C). At 48 h p.i., the chest and peritoneal cavities of mice were exposed (D) and luminescence quantitated for the whole body as described above (E). Images are of one representative mouse of 3 infected per group. Error bars indicate standard deviations.
DISCUSSION
We have compared the magnitude and stability of reporter gene expression and the virulence of three types of alphavirus vectors derived from Old World and New World viruses and expressing a large (fLuc) or a small (nLuc) reporter protein. We conclude from these studies that both the size of the expressed gene and its location in the genome are factors in retention of gene expression in vitro and in vivo and virulence in vivo. fLuc expression was lost rapidly from nsP3, DP, and TaV vectors, especially in vitro, while nLuc was much more stable, particularly in the nsP3 and TaV vectors. The data do suggest that the TaV expression is somewhat more stable than DP expression, as fLuc expression was better retained by TaV viruses during passage in vitro and growth in animals. However, the effect of insert size upon virulence is clear comparing nsP3 and TaV viruses expressing fLuc versus nLuc. This is further reinforced by the fact that EEEV and VEEV TaV-eGFP and TaV-mCherry (both genes are ∼750 nt)-expressing viruses exhibit the same mortality rates as unmodified parental viruses but yield slightly extended ASTs versus the vectors with the shorter nLuc gene (Table 2 and data not shown).
The location of the expressed gene had a greater effect upon the virulence of the vector, especially when expressed from the 3′ DP. The levels of virulence of nsP3- and TaV-nLuc viruses were similar in mice for both SINV and EEEV. However, the corresponding DP viruses were significantly attenuated. This suggests strongly that the second subgenomic promoter is an attenuating factor regardless of the expressed gene. This is further supported by the increased virulence in the TaV-fLuc viruses in comparison to DP-fLuc viruses. While 5′ DP vectors may be less attenuating than the 3′ DP vectors tested in this study (11, 26), the TaV vectors appear to combine both high-level and stable expression of heterologous proteins and, therefore, provide a distinct advantage in sensitivity. Possible mechanisms of attenuation for 3′ DP vectors include competition between the authentic subgenomic promoter and the artificial second promoter for limiting viral factors and/or an unidentified effect upon virus packaging or host responses to infection associated with this particular change in the structure of the alphavirus genome. Overall, our results should substantially temper conclusions drawn from experiments utilizing DP viruses expressing fLuc or fluorescent proteins that have been used to track virus replication in animals (3, 6, 27, 28), especially later in infection.
Interestingly, ASTs with the EEEV TAV and nsP3-nLuc vectors were not significantly different from the parental virus, while the analogous SINV nLuc vectors were significantly different, although still the most virulent vectors tested. This may be due to the stringency of the SINV model, as mice 5 days of age exhibit uniform mortality with the parental virus, but by the time mice reach the age of 7 days, this falls to less than 70%, and all mice survive when infected at 11 days old or older (24). Thus, addition of even nLuc may be very slightly attenuating, but in a fully virulent model system such as adult mice infected with EEEV, this is not detectable.
In addition to the effects upon virulence and gene retention, we have identified nLuc as a much more sensitive measure of virus replication in vitro and in vivo. The signal from nLuc was 1 to 2 logs higher than that from fLuc (as expected based upon luminescence chemistry (16) in all cases and should allow very sensitive measurement of virus tropism and dissemination in tissues in vivo. The nsP3-nLuc viruses will allow measurement of the earliest translation of the alphavirus genome, while the TaV viruses will give an idea of cumulative levels of replication and, reflective of the ∼10-fold-higher abundance of the subgenomic mRNA, allow detection of lower levels of replication. One caution based upon our studies is that both luminescent proteins appeared to accumulate in some tissues in a manner that did not closely reflect the presence of infectious virus as a function of time. Therefore, a more accurate measure of direct virus production may be a rapidly degrading form of the reporter, such as the PEST sequence-fused nLuc (16).
An additional consideration is the application of these reporters to in vivo imaging technology. While a number of studies have examined expression of fLuc from DP viruses (3, 6, 24, 28) using in vivo imaging, nLuc has yet to be fully tested and may compromise some sensitivity in comparison to fLuc due to a blue shift of light emitted resulting in increased potential for absorption by animal tissues (16). However, this may be compensated by the increased luminescence per molecule of nLuc as well as resistance of nLuc to pH and temperature variations and lack of ATP requirement compared with fLuc (16). A detectable in vivo imaging signal has recently been observed using nLuc-expressing influenza virus vectors (29). We observed higher luminescence for fLuc from individual positive tissues but, overall, a much more disseminated signal with nLuc, more similar to virus titration and in situ hybridization results with IFNAR1−/− mice (30). Indeed, the nLuc distribution in skin revealed a previously unrecognized contribution of this tissue to overall virus replication in the absence of type I interferon (IFN). We attribute the detection of markedly more widespread nLuc signal in the animals to the combination of increased tissue titers of the nLuc TaV virus and increased retention of the transgene over the course of infection. However, differences between luciferases in tissue absorption should be considered for in vivo imaging experimental design and data analysis.
In summary, we have created versions of both New World and Old World alphaviruses that express reporter genes yet retain virulence very similar to that of unmodified parental viruses. Further, we have identified nLuc as a highly sensitive and efficiently retained reporter of infection both in vitro and in vivo. These viruses will be important reagents in antiviral therapeutic and vaccine candidate screening assays in vivo and may also be adapted for use as live-attenuated vaccines by use of minimal immunogenic protein sequences and incorporation of attenuating mutations with known mechanisms of action, such as HS-binding mutations (21, 31; K. D. Ryman, submitted for publication), mutations to the 5′ nontranslated region (32, 33), or mutations to the host interaction domains of nsP1 (34) or nsP2 (35–39).
Footnotes
Published ahead of print 4 December 2013
REFERENCES
- 1.Griffin DE. 2007. Alphaviruses, p 1023–1068 In Knipe DM, Howley PM, Griffin DE, Lamb RA, Martin MA, Roizman B, Straus SE. (ed), Fields virology, 5th ed, vol 1 Lippincott Williams & WIlkins, Philadelphia, PA [Google Scholar]
- 2.Caley IJ, Betts MR, Davis NL, Swanstrom R, Frelinger JA, Johnston RE. 1999. Venezuelan equine encephalitis virus vectors expressing HIV-1 proteins: vector design strategies for improved vaccine efficacy. Vaccine 17:3124–3135. 10.1016/S0264-410X(99)00142-5 [DOI] [PubMed] [Google Scholar]
- 3.Cook SH, Griffin DE. 2003. Luciferase imaging of a neurotropic viral infection in intact animals. J. Virol. 77:5333–5338. 10.1128/JVI.77.9.5333-5338.2003 [DOI] [PMC free article] [PubMed] [Google Scholar]
- 4.Gardner CL, Ebel GD, Ryman KD, Klimstra WB. 2011. Heparan sulfate binding by natural eastern equine encephalitis viruses promotes neurovirulence. Proc. Natl. Acad. Sci. U. S. A. 108:16026–16031. 10.1073/pnas.1110617108 [DOI] [PMC free article] [PubMed] [Google Scholar]
- 5.Ryman KD, White LJ, Johnston RE, Klimstra WB. 2002. Effects of PKR/RNase L-dependent and alternative antiviral pathways on alphavirus replication and pathogenesis. Viral Immunol. 15:53–76. 10.1089/088282402317340233 [DOI] [PubMed] [Google Scholar]
- 6.Phillips AT, Stauft CB, Aboellail TA, Toth AM, Jarvis DL, Powers AM, Olson KE. 2013. Bioluminescent imaging and histopathologic characterization of WEEV neuroinvasion in outbred CD-1 mice. PLoS One 8:e53462. 10.1371/journal.pone.0053462 [DOI] [PMC free article] [PubMed] [Google Scholar]
- 7.Kümmerer BM, Grywna K, Glasker S, Wieseler J, Drosten C. 2012. Construction of an infectious Chikungunya virus cDNA clone and stable insertion of mCherry reporter genes at two different sites. J. Gen. Virol. 93:1991–1995. 10.1099/vir.0.043752-0 [DOI] [PubMed] [Google Scholar]
- 8.Powers AM, Brault AC, Tesh RB, Weaver SC. 2000. Re-emergence of Chikungunya and O'nyong-nyong viruses: evidence for distinct geographical lineages and distant evolutionary relationships. J. Gen. Virol. 81:471–479 [DOI] [PubMed] [Google Scholar]
- 9.Tsetsarkin K, Higgs S, McGee CE, De Lamballerie X, Charrel RN, Vanlandingham DL. 2006. Infectious clones of Chikungunya virus (La Reunion isolate) for vector competence studies. Vector Borne Zoonotic Dis. 6:325–337. 10.1089/vbz.2006.6.325 [DOI] [PubMed] [Google Scholar]
- 10.Xiong C, Levis R, Shen P, Schlesinger S, Rice CM, Huang HV. 1989. Sindbis virus: an efficient, broad host range vector for gene expression in animal cells. Science 243:1188–1191. 10.1126/science.2922607 [DOI] [PubMed] [Google Scholar]
- 11.Brault AC, Foy BD, Myles KM, Kelly CL, Higgs S, Weaver SC, Olson KE, Miller BR, Powers AM. 2004. Infection patterns of o'nyong nyong virus in the malaria-transmitting mosquito, Anopheles gambiae. Insect Mol. Biol. 13:625–635. 10.1111/j.0962-1075.2004.00521.x [DOI] [PubMed] [Google Scholar]
- 12.Huang HV, Rice CM, Xiong C, Schlesinger S. 1989. RNA viruses as gene expression vectors. Virus Genes 3:85–91. 10.1007/BF00301989 [DOI] [PubMed] [Google Scholar]
- 13.Gardner CL, Burke CW, Tesfay MZ, Glass PJ, Klimstra WB, Ryman KD. 2008. Eastern and Venezuelan equine encephalitis viruses differ in their ability to infect dendritic cells and macrophages: impact of altered cell tropism on pathogenesis. J. Virol. 82:10634–10646. 10.1128/JVI.01323-08 [DOI] [PMC free article] [PubMed] [Google Scholar]
- 14.Bick MJ, Carroll JW, Gao G, Goff SP, Rice CM, MacDonald MR. 2003. Expression of the zinc-finger antiviral protein inhibits alphavirus replication. J. Virol. 77:11555–11562. 10.1128/JVI.77.21.11555-11562.2003 [DOI] [PMC free article] [PubMed] [Google Scholar]
- 15.Pugachev KV, Mason PW, Shope RE, Frey TK. 1995. Double-subgenomic Sindbis virus recombinants expressing immunogenic proteins of Japanese encephalitis virus induce significant protection in mice against lethal JEV infection. Virology 212:587–594. 10.1006/viro.1995.1516 [DOI] [PubMed] [Google Scholar]
- 16.Hall MP, Unch J, Binkowski BF, Valley MP, Butler BL, Wood MG, Otto P, Zimmerman K, Vidugiris G, Machleidt T, Robers MB, Benink HA, Eggers CT, Slater MR, Meisenheimer PL, Klaubert DH, Fan F, Encell LP, Wood KV. 2012. Engineered luciferase reporter from a deep sea shrimp utilizing a novel imidazopyrazinone substrate. ACS Chem. Biol. 7:1848–1857. 10.1021/cb3002478 [DOI] [PMC free article] [PubMed] [Google Scholar]
- 17.Thomas JM, Klimstra WB, Ryman KD, Heidner HW. 2003. Sindbis virus vectors designed to express a foreign protein as a cleavable component of the viral structural polyprotein. J. Virol. 77:5598–5606. 10.1128/JVI.77.10.5598-5606.2003 [DOI] [PMC free article] [PubMed] [Google Scholar]
- 18.Donnelly ML, Hughes LE, Luke G, Mendoza H, ten Dam E, Gani D, Ryan MD. 2001. The ‘cleavage’ activities of foot-and-mouth disease virus 2A site-directed mutants and naturally occurring ‘2A-like' sequences. J. Gen. Virol. 82:1027–1041 [DOI] [PubMed] [Google Scholar]
- 19.Aguilar PV, Adams AP, Wang E, Kang W, Carrara AS, Anishchenko M, Frolov I, Weaver SC. 2008. Structural and nonstructural protein genome regions of eastern equine encephalitis virus are determinants of interferon sensitivity and murine virulence. J. Virol. 82:4920–4930. 10.1128/JVI.02514-07 [DOI] [PMC free article] [PubMed] [Google Scholar]
- 20.Weaver SC, Anishchenko M, Bowen R, Brault AC, Estrada-Franco JG, Fernandez Z, Greene I, Ortiz D, Paessler S, Powers AM. 2004. Genetic determinants of Venezuelan equine encephalitis emergence. Arch. Virol. Suppl. 2004(18):43–64. 10.1007/978-3-7091-0572-6_5 [DOI] [PubMed] [Google Scholar]
- 21.Klimstra WB, Ryman KD, Johnston RE. 1998. Adaptation of Sindbis virus to BHK cells selects for use of heparan sulfate as an attachment receptor. J. Virol. 72:7357–7366 [DOI] [PMC free article] [PubMed] [Google Scholar]
- 22.Ryman KD, Meier KC, Nangle EM, Ragsdale SL, Korneeva NL, Rhoads RE, MacDonald MR, Klimstra WB. 2005. Sindbis virus translation is inhibited by a PKR/RNase L-independent effector induced by alpha/beta interferon priming of dendritic cells. J. Virol. 79:1487–1499. 10.1128/JVI.79.3.1487-1499.2005 [DOI] [PMC free article] [PubMed] [Google Scholar]
- 23.Yin J, Gardner CL, Burke CW, Ryman KD, Klimstra WB. 2009. Similarities and differences in antagonism of neuron alpha/beta interferon responses by Venezuelan equine encephalitis and Sindbis alphaviruses. J. Virol. 83:10036–10047. 10.1128/JVI.01209-09 [DOI] [PMC free article] [PubMed] [Google Scholar]
- 24.Ryman KD, Gardner CL, Meier KC, Biron CA, Johnston RE, Klimstra WB. 2007. Early restriction of alphavirus replication and dissemination contributes to age-dependent attenuation of systemic hyperinflammatory disease. J. Gen. Virol. 88:518–529. 10.1099/vir.0.82359-0 [DOI] [PubMed] [Google Scholar]
- 25.Xiong L, Shuhendler AJ, Rao J. 2012. Self-luminescing BRET-FRET near-infrared dots for in vivo lymph-node mapping and tumour imaging. Nat. Commun. 3:1193. 10.1038/ncomms2197 [DOI] [PMC free article] [PubMed] [Google Scholar]
- 26.Vanlandingham DL, Tsetsarkin K, Klingler KA, Hong C, McElroy KL, Lehane MJ, Higgs S. 2006. Determinants of vector specificity of o'nyong nyong and chikungunya viruses in Anopheles and Aedes mosquitoes. Am. J. Trop. Med. Hyg. 74:663–669 [PubMed] [Google Scholar]
- 27.Poussard A, Patterson M, Taylor K, Seregin A, Smith J, Smith J, Salazar M, Paessler S. 2012. In vivo imaging systems (IVIS) detection of a neuro-invasive encephalitic virus. J. Vis. Exp. 2012(70):e4429. 10.3791/4429 [DOI] [PMC free article] [PubMed] [Google Scholar]
- 28.Ryman KD, Gardner CL, Burke CW, Meier KC, Thompson JM, Klimstra WB. 2007. Heparan sulfate binding can contribute to the neurovirulence of neuroadapted and nonneuroadapted Sindbis viruses. J. Virol. 81:3563–3573. 10.1128/JVI.02494-06 [DOI] [PMC free article] [PubMed] [Google Scholar]
- 29.Tran V, Moser LA, Poole DS, Mehle A. 2013. Highly sensitive real-time in vivo imaging of an influenza reporter virus reveals dynamics of replication and spread. J. Virol. 87:13321–13329. 10.1128/JVI.02381-13 [DOI] [PMC free article] [PubMed] [Google Scholar]
- 30.Ryman KD, Klimstra WB, Nguyen KB, Biron CA, Johnston RE. 2000. Alpha/beta interferon protects adult mice from fatal Sindbis virus infection and is an important determinant of cell and tissue tropism. J. Virol. 74:3366–3378. 10.1128/JVI.74.7.3366-3378.2000 [DOI] [PMC free article] [PubMed] [Google Scholar]
- 31.Klimstra WB, Ryman KD, Bernard KA, Nguyen KB, Biron CA, Johnston RE. 1999. Infection of neonatal mice with Sindbis virus results in a systemic inflammatory response syndrome. J. Virol. 73:10387–10398 [DOI] [PMC free article] [PubMed] [Google Scholar]
- 32.Kobiler D, Rice CM, Brodie C, Shahar A, Dubuisson J, Halevy M, Lustig S. 1999. A single nucleotide change in the 5′ noncoding region of Sindbis virus confers neurovirulence in rats. J. Virol. 73:10440–10446 [DOI] [PMC free article] [PubMed] [Google Scholar]
- 33.McKnight KL, Simpson DA, Lin SC, Knott TA, Polo JM, Pence DF, Johannsen DB, Heidner HW, Davis NL, Johnston RE. 1996. Deduced consensus sequence of Sindbis virus strain AR339: mutations contained in laboratory strains which affect cell culture and in vivo phenotypes. J. Virol. 70:1981–1989 [DOI] [PMC free article] [PubMed] [Google Scholar]
- 34.Heise MT, White LJ, Simpson DA, Leonard C, Bernard KA, Meeker RB, Johnston RE. 2003. An attenuating mutation in nsP1 of the Sindbis-group virus S.A.AR86 accelerates nonstructural protein processing and up-regulates viral 26S RNA synthesis. J. Virol. 77:1149–1156. 10.1128/JVI.77.2.1149-1156.2003 [DOI] [PMC free article] [PubMed] [Google Scholar]
- 35.Frolova EI, Fayzulin RZ, Cook SH, Griffin DE, Rice CM, Frolov I. 2002. Roles of nonstructural protein nsP2 and alpha/beta interferons in determining the outcome of Sindbis virus infection. J. Virol. 76:11254–11264. 10.1128/JVI.76.22.11254-11264.2002 [DOI] [PMC free article] [PubMed] [Google Scholar]
- 36.Fros JJ, Liu WJ, Prow NA, Geertsema C, Ligtenberg M, Vanlandingham DL, Schnettler E, Vlak JM, Suhrbier A, Khromykh AA, Pijlman GP. 2010. Chikungunya virus nonstructural protein 2 inhibits type I/II interferon-stimulated JAK-STAT signaling. J. Virol. 84:10877–10887. 10.1128/JVI.00949-10 [DOI] [PMC free article] [PubMed] [Google Scholar]
- 37.Akhrymuk I, Kulemzin SV, Frolova EI. 2012. Evasion of the innate immune response: the Old World alphavirus nsP2 protein induces rapid degradation of Rpb1, a catalytic subunit of RNA polymerase II. J. Virol. 86:7180–7191. 10.1128/JVI.00541-12 [DOI] [PMC free article] [PubMed] [Google Scholar]
- 38.Fros JJ, van der Maten E, Vlak JM, Pijlman GP. 2013. The C-terminal domain of Chikungunya virus nsP2 independently governs viral RNA replication, cytopathicity, and inhibition of interferon signaling. J. Virol. 87:10394–10400. 10.1128/JVI.00884-13 [DOI] [PMC free article] [PubMed] [Google Scholar]
- 39.Burke CW, Gardner CL, Steffan JJ, Ryman KD, Klimstra WB. 2009. Characteristics of alpha/beta interferon induction after infection of murine fibroblasts with wild-type and mutant alphaviruses. Virology 395:121–132. 10.1016/j.virol.2009.08.039 [DOI] [PMC free article] [PubMed] [Google Scholar]