

ABSTRACT
Epstein-Barr virus (EBV) reactivation involves the ordered induction of approximately 90 viral genes that participate in the generation of infectious virions. Using strand-specific RNA-seq to assess the EBV transcriptome during reactivation, we found extensive bidirectional transcription extending across nearly the entire genome. In contrast, only 4% of the EBV genome is currently bidirectionally annotated. Most of the newly identified transcribed regions show little evidence of coding potential, supporting noncoding roles for most of these RNAs. Based on previous cellular long noncoding RNA size calculations, we estimate that there are likely hundreds more EBV genes expressed during reactivation than was previously known. Limited 5′ and 3′ rapid amplification of cDNA ends (RACE) experiments and findings of novel splicing events by RNA-seq suggest that the complexity of the viral genome during reactivation may be even greater. Further analysis of antisense transcripts at some of the EBV latency gene loci showed that they are “late” genes, they are nuclear, and they tend to localize in areas of the nucleus where others find newly synthesized viral genomes. This raises the possibility that these transcripts perform functions such as new genome processing, stabilization, organization, etc. The finding of a significantly more complex EBV transcriptome during reactivation changes our view of the viral production process from one that is facilitated and regulated almost entirely by previously identified viral proteins to a process that also involves the contribution of a wide array of virus encoded noncoding RNAs.
IMPORTANCE
INTRODUCTION
Epstein-Barr virus (EBV) is a human gammaherpesvirus that is prevalent in all human populations. Although infection is frequently asymptomatic, it has been linked to a number of serious diseases such as Burkitt's lymphoma, nasopharyngeal carcinoma, and posttransplant lymphoproliferative disorder (1). Like other herpesviruses, EBV can exist in both lytic and latent phases, with primary lytic infections often progressing to lifelong latent infections with generally sporadic subsequent episodes of lytic reactivation (2).
Although latency is critical for long-term survival in the host, spread from cell to cell and from host to host requires the lytic phase during which virus is produced. The production and assembly of viable infectious virions is probably the most complex process in the virus infection cascade, requiring the orchestration of hundreds of viral and cellular molecules. Currently, approximately 91 primarily protein coding viral genes are thought to be induced for viral replication (3). In addition to the classic lytic genes, it is now understood that the protein coding EBV latency genes are also induced during reactivation and presumably contribute to the production of viable virus (4–6).
We previously examined EBV transcription following B-cell receptor engagement (to induce synchronous reactivation) in the EBV positive Akata cell system using RNA-seq (6). The results of that study were consistent with existing knowledge of reactivation in that we observed abundant transcription of the lytic genes, as well as substantial transcription across the latency genes. Unexpectedly, we also observed coverage at the relatively few intergenic regions, as well as at intronic regions. Closer analysis of one of these intergenic regions using 5′ RACE (rapid amplification of cDNA ends) revealed at least two previously unknown transcripts that overlap in opposing orientations. Our study led us to hypothesize that the complexity of the EBV lytic transcriptome is greater than previously appreciated. Here we address this hypothesis by performing strand-specific RNA-seq to allow the attribution of reads to their originating strand. In addition to sequencing libraries from poly(A) selected RNA, we also sequenced libraries generated from ribodepleted RNA to capture additional noncoding RNAs that are not polyadenylated. Based on our analysis, we found that most of the EBV genome is transcribed in both directions and that there are likely hundreds more lytic genes than previously known, many of which are noncoding RNAs that perform as-yet-unknown functions in viral replication.
MATERIALS AND METHODS
Cell culture.
Akata cells were grown at 37°C and 5% CO2 in a humidified incubator and were cultured in RPMI 1640 (Thermo Scientific, catalog no. SH30027) plus 10% fetal bovine serum (FBS; Invitrogen-Gibco, catalog no. 16000), and 0.5% penicillin-streptomycin (pen/strep; Invitrogen-Gibco, catalog no. 15070).
Lytic cycle induction.
One day prior to induction, near-saturation cell cultures were diluted with equal volumes of fresh RPMI 1640 (with 10% FBS and 0.5% pen/strep). The next day, cells were spun down and resuspended at a concentration of 106 cells/ml in fresh RPMI 1640 (with 10% FBS and 0.5% pen/strep) plus either 10 μg/ml of anti-IgG or no anti-IgG (uninduced). Cells were harvested at 5 min, 30 min, 1 h, 2 h, 4 h, 8 h, 24 h, and 48 h after induction, and RNA was isolated as described below.
For phosphonoacetic acid (PAA) experiments, cells were treated as described above and at the time of anti-IgG addition were resuspended in media that also contained either 200 μg of PAA/ml or no PAA. Cells were harvested 24 h after treatment, and RNA was isolated as described below.
RNA extraction.
At each time point, total RNA was isolated by using an RNeasy minikit (Qiagen, catalog no. 74104) or TRIzol reagent (Ambion, catalog no. 15596) according to the vendors' protocols and treated twice with RNase-free DNase (Qiagen, catalog no. 79254) according to the vendor's protocol. For nuclear and cytoplasmic RNA isolation, uninduced cells and cells induced for 24 h were isolated using a cytoplasmic and nuclear RNA purification kit from Norgen Biotek (catalog no. 2100).
RNA sequencing.
RNA samples were either poly(A) selected or ribodepleted (Ribo-Zero; Epicentre, catalog no. MRZH11124) and prepared using the TruSeq stranded protocol (Illumina, catalog no. RS-930-2001). Ribodepleted samples underwent 101 base single-end sequencing using an Illumina HiSeq 2000 instrument. Poly(A)-selected samples underwent 2 × 101 base paired-end sequencing using an Illumina HiSeq 2000 instrument. Sequencing data have been deposited to NCBI Gene Expression Omnibus (7) and are accessible through GEO series accession number GSE52490.
Alignments.
RNA-seq reads were aligned using indexes containing both the human (hg19 assembly) and the Akata EBV (Akata-NCBI accession number KC207813.1 [8]) genomes. Alignments were performed using both Novoalign version 2.08.02 (Novocraft; -o SAM –r R, default options) and Bowtie version 2 (9) (–library-type fr-firststrand, default options). Splice junctions were identified using TopHat version 2.0.6 (10) (default options). In order to maintain consistency between single-end RNA-seq data and paired-end RNA-seq data, only the first read of the paired-end sequencing data was analyzed for the studies presented here.
Strand specificity calculation.
Strand specificity was determined by using eight highly expressed cellular genes with no known antisense transcription (GAPDH, ACTB, RPL8, EEF2, RPS6, RPLP1, GNB2L1, and PFN1). Initially, coverage data were loaded onto a genome browser, and each gene was visually inspected for possible clusters of antisense reads that might represent previously unannotated antisense transcripts. No likely antisense transcript was detected for any of these genes. To calculate strand specificity, signalmap files (the number of reads covering each genomic coordinate) were generated for each strand of each gene from Bowtie2/TopHat aligned files using IGVtools (11, 12). The gene signalmap files were converted to exon signalmap files using the BedTools command intersectBed (13) and an exon bed file from the hg19 assembly of the human genome. At all nucleotide positions with 200 or more sense reads, the number of antisense reads was divided by the number of sense reads and multiplied by 100 to obtain the percent background antisense reads. The means and standard deviations were then calculated to determine the average and the variability of antisense background.
Calculation of percentage of reads mapped to EBV and induction level.
The number of reads with a primary alignment (SAM FLAG code 0 or 16) on the EBV genome was divided by the total number of reads with a primary alignment on either genome and multiplied by 100. To allow better comparison between poly(A) selected and ribodepleted data sets, reads overlapping the EBER genes were removed in both directions prior to calculating the percentage of reads mapped to EBV. The fold change between induced and uninduced conditions was calculated by dividing the percentage of reads mapped to EBV at 24 h postinduction by the percentage of reads mapped to EBV at 0 min postinduction.
Determination of transcribed EBV genome loci.
Signalmap files were generated for each strand of the EBV genome from Bowtie2/TopHat aligned files using IGVtools. For the purposes of this analysis, a nucleotide position was considered to be transcribed if it met both of the following criteria: (i) the number of reads aligning to the respective base was greater than 4 and (ii) the number of reads aligning to that base was higher than the expected antisense background from opposite strand reads (equals opposite strand read numbers times average antisense background) plus four standard deviations. Transcription was considered to be “known” if the base was contained within a previously annotated exon (8).
Quantification of gene expression using strand information.
Expression levels of known EBV and cellular genes were quantified from Bowtie2/TopHat aligned files using SAMMate (14). Quantification was made strand-specific by using a separate annotation file for each strand in conjunction with a SAM file containing only reads aligning to the strand matching the annotation file. To allow for direct comparison of RPKM (reads per kilobase of transcript per million mapped reads) values generated for different strands, these RPKM values were multiplied by the ratio of the sum of read counts for that strand (as determined by SAMMate) to the total number of mapped reads for both strands of the two genomes (as determined by Bowtie2/TopHat). The levels of antisense expression to known genes were quantified using the annotation file for one strand together with a SAM file containing only reads aligning to the opposite strand. Antisense RPKM values were corrected as described above. Non-strand-specific expression values for known genes were obtained in the poly(A) selected data set by combining sense and antisense read counts for each gene from strand-specific SAMMate output and dividing by the gene's transcript length in thousands and by the number of million mapped reads.
Comparison of novel EBV gene expression to cellular transcript levels.
Because exon boundaries and transcript sizes are unknown for the novel EBV transcripts, RPKM values cannot be used to measure abundance. To compare EBV transcription levels with cellular transcription levels, per-base EBV read counts were first normalized by dividing by the total number of million reads mapped to either genome. This value is the reads per million mapped reads (RPM) at each position. To determine the expression level of the top quartile of cellular genes, cellular gene expression was quantified with SAMMate (14) as described above. The strand-specific RPKMs for the plus and minus strand cellular genes were combined, genes with fewer than two reads aligning were removed, and the top quartile expression level was determined. To allow comparison of per-base EBV read levels to the top quartile of cellular genes, the RPKM value representing the 75th percentile of cellular genes was converted to an RPM value by multiplying by 1,000 and dividing by the read length (i.e., 101).
Detection of poly(A) tails in RNA-seq data.
To detect poly(A) tails in the RNA-seq data, reads with runs of five or more Ts at their 5′ ends were extracted from Novoalign generated SAM alignment files from ribodepleted RNA isolated from cells treated with anti-IgG for 24 h. All reads with 5′ poly(T)s were then aligned to the Akata genome using BLAST version 2.2.28+ (15). Reads with mismatches at the first two or more positions of the read were identified as candidate poly(A) tail reads. Mapping data for this set of reads were then used to generate a BED file for visualization on a genome browser.
5′ and 3′ RACE.
5′ and 3′ RACE (Rapid Amplification of cDNA ends) was performed using the SMARTer RACE cDNA Amplification kit (Clontech, catalog no. 634924). cDNA was prepared with Primer A or with Random Primer Mix to detect polyadenylated and nonpolyadenylated transcripts, respectively. Thermal cycling was performed according to the manufacturer's Program 2. RACE PCR products were cloned using a TOPO TA cloning kit (Invitrogen, catalog no. K4575) and Sanger sequenced.
RACE primers.
The primers and their corresponding sequences for EBNA3A were as follows: 5′ RACE primer 1, CCGGCGGCCAGGGTTTGCAGTCTCCA; 5′ RACE primer 2, ACGTGACACCTACGGCCACCTGTGCA; 5′ RACE primer 3, GCTCTCCGCGTCCTCACTTTCTTCCCG; 5′ RACE primer 4, TGCCCTGTTCCGTTCGTTTGCCCGCT; 5′ RACE primer 5, TGCACAGGTGGCCGTAGGTGTCACGT; 5′ RACE primer 6, ACACCGATCACCAGACGACTCCCAC; and 5′ RACE primer 7, TCCCACCCCAGCCGGATCTCCCT. The primers and their corresponding sequences for EBNA3B were as follows: 3′ RACE primer 1, GCCAGCACTGTACGTTGTTGCATGCCG; 5′ RACE primer 1, TGTGAACCCAACGCAGGCTCCAGTGA; and 5′ RACE primer 2, CACGTCGTGCTAGGTCACTTTCGGCAGA.
Calculation of coding potential.
The coding potential of known and novel transcripts was calculated using the Coding Potential Calculator (16). For transcripts with ambiguous 5′ or 3′ ends, several sequences of various lengths were used as input. Representative results are shown.
Strand-specific qRT-PCR.
Strand-specific quantitative reverse transcription-PCR (qRT-PCR) was performed according to the method of Feng et al. (17) using 200 ng of total RNA from all anti-IgG-induction time points, 200 to 300 ng of nuclear and cytoplasmic RNA (24 h time point), or 300 ng of total RNA from PAA-treated cells (24 h time point). cDNA was synthesized at 65°C for 50 min using sequence-modifying primers and ThermoScript reverse transcriptase (Life Technologies, catalog no. 12236-022) according to the manufacturer's protocol. qRT-PCRs were carried out using iQ SYBR green Supermix (Bio-Rad, catalog no. 170-8882) on a Bio-Rad CFX96 instrument as follows: 1 μl of cDNA product was denatured for 3 min at 95°C and amplified for 40 cycles of 15-s denaturation at 95°C and 1-min annealing/extension at 60°C. Melting-curve analysis was conducted from 65 to 95°C with a ramp of 0.5°C/5 s to confirm strand specificity (see Fig. S1 in the supplemental material) Transcript abundance was quantified using the comparative CT method (2−ΔΔCT).
Primers.
The primers used in the present study were as follows (lowercase letters indicate sequence-modifying bases): EBNA2, sequence-modifying RT primer (GCAACCCCTAACGTTTCACCgggcCggGAACCGG) and qPCR primers (GCAACCCCTAACGTTTCACC and CGGGGAAGAGAATGGGAGC); EBNA3B, sequence-modifying RT primer (TGGCATTGTACAGATACCACGAgcggCgGACCAAAAC) and qPCR primers (TGGCATTGTACAGATACCACGA and CCGAAAGTGACCTAGCACGA); and actin, sequence-modifying RT primer (GTACAGGTCTTTGCGGATGTttAtaTaACACTTCATG) and qPCR primers (CACTCTTCCAGCCTTCCTTC and GTACAGGTCTTTGCGGATGT).
qRT-PCR of Zta expression.
cDNA was synthesized from RNA extracted from PAA-treated cells at the 24-h time point using the Superscript III first strand synthesis system (Invitrogen, catalog no. 18080-051) with oligo(dT) primers. qRT-PCRs were carried out using iQ SYBR green Supermix (Bio-Rad, catalog no. 170-8882) on a Bio-Rad CFX96 instrument as follows. First, 1 μl of cDNA product was denatured for 3 min at 95°C and amplified for 40 cycles of 15-s denaturation at 95°C and 1-min annealing/extension at 60°C. Transcript abundance was quantified using the comparative CT method (2−ΔΔCT). The primers GAAGCCACCCGATTCTTGTAT and CGACGTACAAGGAAACCACTAC were used to evaluate Zta expression.
FISH.
Fluorescence in situ hybridization (FISH) was performed with custom Stellaris RNA FISH probes (Biosearch Technologies) with CAL Fluor Red 610 fluorophores according to the manufacturer's protocol. Ten million Akata cells were used for fixation and permeabilized for 2 h. No antifade solution was used. All imaging was performed on a Leica DMRXA2 deconvolution upright microscope. CAL Fluor Red 610 was excited at between 530 and 585 nm, and emitted light was collected at around 615 nm. Three-dimensional imaging of Akata cells was acquired using a 100×/1.35 oil objective lens on a motorized XYZ-stage with a Cooke SensiCAM camera using Slidebook software. Videos were created using iMovie version 8.0.6.
RESULTS
Strand-specific sequencing of poly(A) selected and ribodepleted RNAs from reactivated Akata cells.
To investigate the lytic EBV transcriptome, we first induced the lytic cascade in the EBV positive Burkitt's lymphoma cell line, Akata, through B-cell receptor engagement (using an anti-Ig antibody) (Fig. 1). After 24 h, we prepared RNA from untreated and treated cells and subjected it to either poly(A) selection (to obtain data from mRNA and other polyadenylated transcripts) or ribodepletion (to additionally obtain data from transcripts that are not polyadenylated). The Illumina TruSeq stranded protocol was used to prepare strand-specific sequencing libraries which were loaded onto an Illumina HiSeq 2000 instrument for 101-base sequencing reactions.
FIG 1.
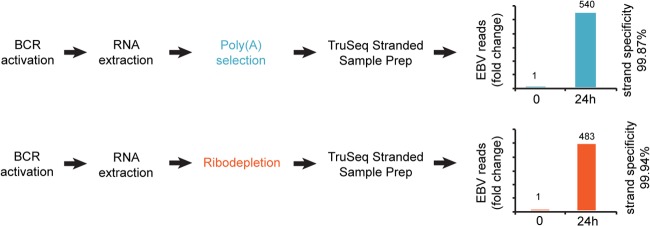
Reactivation and sequencing strategy. Column charts represent fold change in the number of RNA-seq reads mapped to the EBV genome, excluding EBER regions, at 0 and 24 h. For the calculation of strand specificity, see Materials and Methods.
Despite the use of multiplex sequencing, we obtained more than 45 million reads for each reaction which we considered suitable for cellular and viral transcriptome analysis (see Table S1 in the supplemental material). After induction, we observed 540- and 483-fold increases in the percentages of EBV reads in reactions from the poly(A) selected and ribodepleted RNAs, respectively, indicating robust reactivation (Fig. 1).
Critical for our study was the level of strand specificity for the library preparations. While another method that we tested resulted in only ca. 90% specificity (data not shown), the TruSeq stranded protocol gave a minimum of 99.87% in all four cases (see Table S1 in the supplemental material). This high level of specificity (≤1.3 background reads for every 1,000 reads) allowed us to discriminate between sense and antisense transcription in most regions of the EBV genome.
Extensive bidirectional transcription of the EBV genome.
Visualization of read coverage in reactivated cells revealed very little antisense transcription at abundantly transcribed cellular genes that we examined (see Fig. S2 in the supplemental material). In contrast, we observed near-global transcription of both strands of the EBV genome (Fig. 2). To date, only 76% of the EBV genome has been annotated with exons and even more strikingly, only 4% of it has been annotated with exons on both strands (Fig. 3A) (8). The extensive bidirectional transcription seen in Fig. 2 therefore raised the possibility that there are considerably more genes encoded by EBV than was previously known.
FIG 2.
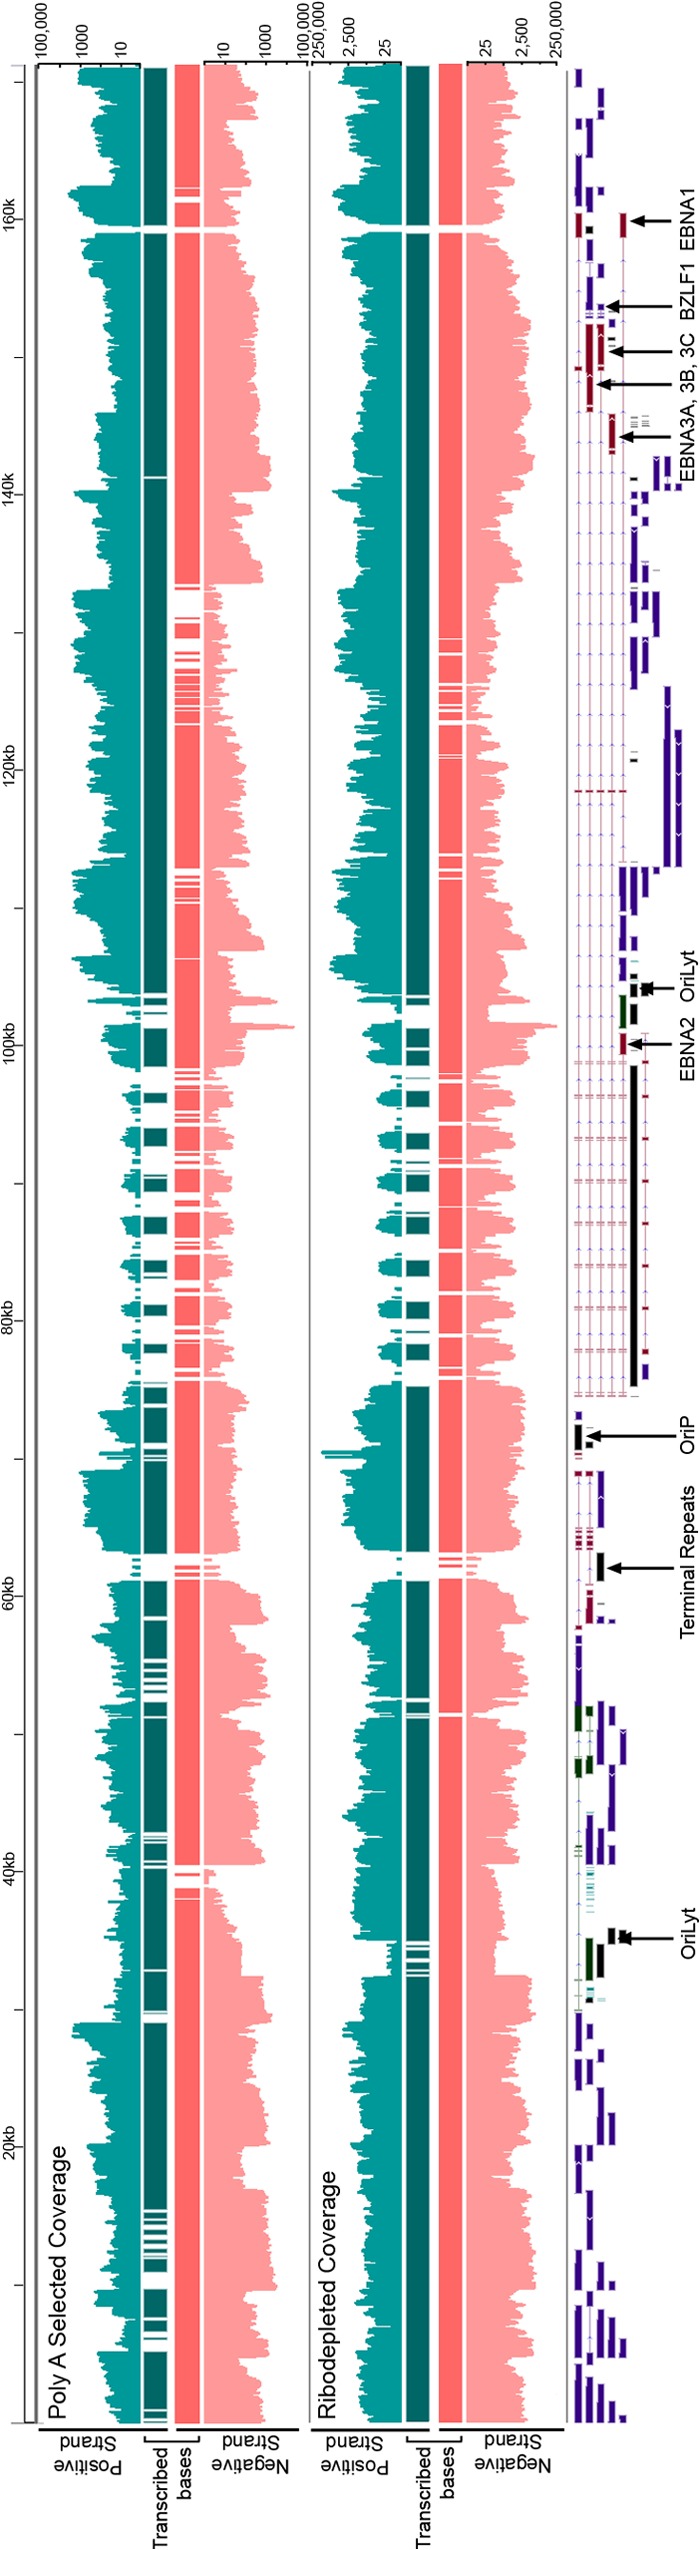
RNA-seq read coverage of the Akata EBV genome at 24 h postinduction. The scales are logarithmic. Transcribed bases tracks display bases with at least five reads with coverage above background levels (see Materials and Methods).
FIG 3.

Novel transcription of the Akata genome 24 h postinduction. (A) Percentage of the genome covered by annotated genes and by RNA-seq reads from poly(A) selected and from ribodepleted RNA. (B) Percentage of novel transcribed genome regions and their expression relative to cellular gene expression. Coverage percentage is based on the full length of both strands of genomic DNA, i.e., 342,646 potentially transcribed bases. (C) Predicted numbers of novel genes based on the number of transcribed bases divided by average of or median transcript lengths from published gene catalogs (8, 18, 19).
Despite the general appearance of significant transcription of both strands of EBV, estimating true coverage requires ensuring that read depth is greater than the predicted background from transcription of the opposite strand (due to imperfect strand specificity). To take this into account, we categorized a nucleotide position as transcribed if more than 4 reads mapped to it and if the number of reads aligning to that position was higher than the expected antisense background plus four standard deviations. Applying these criteria to data from the poly(A) selected RNA from induced cells, we calculated that 91% of the EBV genome was transcribed in at least one direction and >65% was transcribed in both directions (Fig. 3A). Considering the possibility that EBV contains previously unknown transcripts that are not polyadenylated, we performed a similar analysis using data from ribodepleted RNA from induced cells. In this case we calculated that 93% of the genome was transcribed in at least one direction, while 80% of the genome was transcribed in both directions (Fig. 3A). Given that only 4% of the genome has been annotated with genes on both strands, this analysis indicated that much more of the genome is transcribed than has been previously appreciated. The finding of higher coverage using data from ribodepleted RNA compared to poly(A) selected RNA suggests that many unannotated transcripts are not polyadenylated.
At least 50% of the nucleotide positions meeting our criteria for transcription, or upwards of 133,000 bases, did not fall within previously described exons (Fig. 3B). Published catalogs of coding and noncoding genes (8, 18, 19) report average and median transcript lengths ranging from 592 bp to approximately 2,900 bp (Fig. 3C). Using these values, we predicted the number of novel genes by dividing the total number of novel transcribed bases by the average or median gene sizes reported in different studies for different classes of genes. This approach is likely conservative, in part because it does not account for possible overlapping genes oriented in the same direction and it does not take into account gene isoforms. Nevertheless, this analysis predicts that the observed novel transcription could represent dozens to hundreds of viral lytic genes that have not been previously described (Fig. 3C). For example, assuming new transcript lengths near the Akata average of 1,697 bp (8) leads to a rough prediction of 78 [poly(A)+] or 98 (ribodepletion) new genes, while assuming transcript lengths near the average human long noncoding RNA (lncRNA) length determined by GENCODE (18) leads to a rough prediction of 225 [poly(A)+] or 280 (ribodepletion) new genes (Fig. 3C).
High expression of novel EBV transcripts.
To determine whether these novel viral transcripts represented low-level spurious transcription rather than functionally significant transcripts, we compared their expression levels to known cellular transcripts (for calculation method see Materials and Methods). Analysis of the poly(A) selected RNA data revealed that 42% of novel transcribed bases were expressed at levels higher than the top quartile of expressed cellular genes, while 96% were expressed at levels that were above the cellular median (Fig. 3B and data not shown). Analysis of the ribodepleted RNA data showed even higher levels of novel transcription, with 82% of bases being expressed in the top quartile of cellular genes and 97% being expressed above the median (Fig. 3B and data not shown). This suggests that the novel lytic transcripts in general are abundantly transcribed and that nonpolyadenylated transcripts in particular show very high lytic expression levels. Taken together, these data indicate that transcriptional coverage of the EBV genome upon reactivation is both extremely deep and much more broad than has been previously reported.
Antisense transcription at latency loci.
In addition to finding novel transcription through introns and intergenic regions, we observed abundant transcription in the antisense direction of the majority of known genes. The level of antisense transcription was not uniform and did not mirror sense transcription levels, suggesting distinct antisense gene structures. Although the antisense transcription spanned most lytic genes, viral latency genes generally exhibited considerably higher antisense to sense transcription ratios especially when we used data from ribodepleted RNA (Fig. 4A). From a technical standpoint, this illustrates the importance of using strand-specific protocols when determining expression levels of EBV genes, since nonstranded protocols can lead to significantly over-represented transcript abundance for many genes (Fig. 4B). From a functional standpoint, this suggests that the unexpected finding of comprehensive latent gene expression during reactivation by Elliot Kieff's and Mei-Run Chen's groups in 2006 (4, 5) may be a simplified picture of the functional role of these regions during reactivation.
FIG 4.
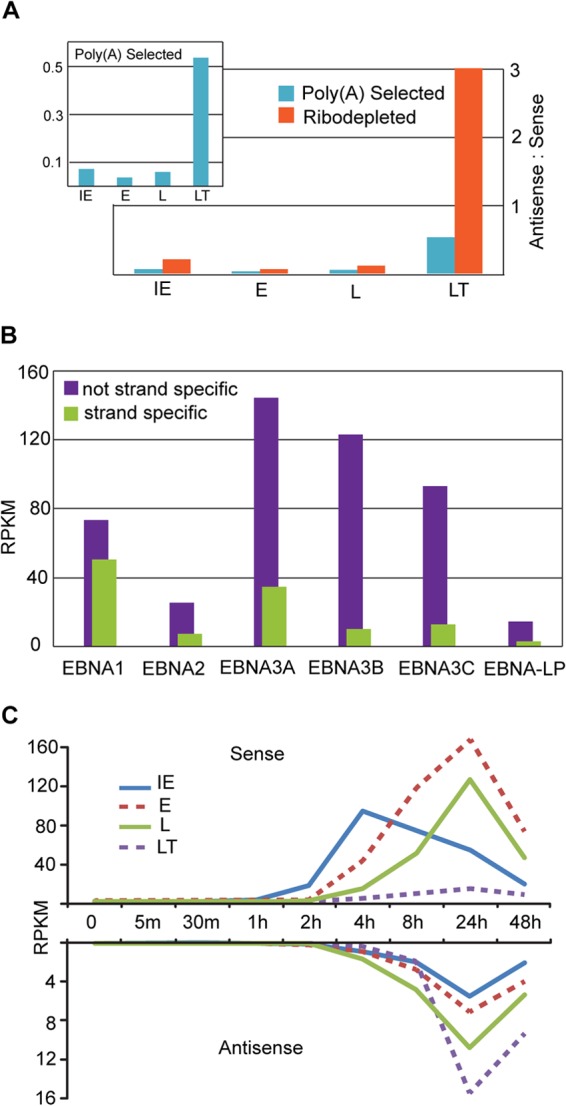
Antisense transcription at known genes and gene classes. (A) Ratio of antisense to sense RPKM values at 24 h postinduction for annotated gene classes using RNA-seq coverage from poly(A) selected (blue) and ribodepleted (orange) RNA. Transcription at EBER loci are excluded. (B) RPKM values for EBNA genes calculated using an unstranded (purple) or strand-specific (green) method on RNA-seq data from poly(A) selected RNA (C) Sense and antisense RPKM values for annotated gene classes at nine time points after reactivation.
Time course analysis of antisense transcription.
Because examining the transcriptome only at 0 h (uninduced) and 24 h (fully induced) presents a snapshot of the lytic cascade, we performed a time course experiment, extracting RNA at 0 min, 5 min, 30 min, 1 h, 2 h, 4 h, 8 h, 24 h, and 48 h after BCR activation. RNA was extracted, ribodepleted, prepared using the Illumina TruSeq stranded protocol and loaded onto an Illumina HiSeq 2000 instrument for 101-base sequencing reactions. We obtained excellent strand specificity and appropriate EBV induction levels for each time point (see Table S1 in the supplemental material).
We used sense gene exon coordinates to calculate strand-specific RPKM values for sense and antisense transcription for all known EBV gene loci. The immediate-early (IE), early (E), late (L), and latent (LT) gene classes showed expression dynamics that are consistent with those previously observed using microarray technology (5) (Fig. 4C). Analysis of antisense expression showed that a majority of antisense transcription at all classes of genes is concordant with late and latent sense transcription, although there is an earlier increase in antisense transcription across from at least some genes within the late category (green line in Fig. 4C). This indicates that while some of these novel transcripts are probably early, many should likely be classified as late.
Antisense transcription at EBNA2, EBNA3A, EBNA3B, and EBNA3C.
The sense and antisense RNA-seq read coverage at the EBNA2, EBNA3A, and EBNA3B loci is depicted in Fig. 5A, 6A, and 7A. In all cases, antisense coverage is considerably higher than sense coverage, and this difference is greater when visualizing reads from ribodepleted RNA relative to reads from poly(A) selected RNA. This is especially true for EBNA2, where the ratio of antisense to sense RPKM values is 2.4 for the poly(A) selected RNA and 52.0 for the ribodepleted RNA. This indicates that these loci, which are known to produce protein-coding polyadenylated transcripts in the sense direction, encode abundant antisense transcripts that largely lack poly(A) tails.
FIG 5.

Sense and antisense transcription at the EBNA2 locus (A) RNA-seq read coverage from poly(A) selected and ribodepleted RNA, and coding potential evidence summary from the Coding Potential Calculator. Note the inset with a zoomed scale for the positive (sense) strand in ribodepleted coverage. (B) RPKM values for RNA-seq time course from ribodepleted RNA (C) Relative abundance of antisense transcription from 0 to 48 h measured by strand-specific qRT-PCR. Primer placement is shown in panel A. (D) Relative abundance of antisense transcription at 24 h after treatment with anti-IgG, anti-IgG plus PAA, or nothing (control). Measured by strand-specific qRT-PCR. (E) Relative abundance of antisense transcription in the nucleus and cytoplasm at 24 h after treatment with anti-IgG. Measured by strand-specific qRT-PCR. (F) FISH of EBNA2 antisense transcripts.
FIG 6.

Sense and antisense transcription at the EBNA3A locus. (A) RNA-seq read coverage from poly(A) selected and ribodepleted RNA (top tracks). Blue annotation tracks represent consensus from RACE fragments from 2 or more primers. Yellow circles indicate RACE fragments that end within 20 bases of another RACE fragment. Orange dashed ends indicate matching splice acceptors with different splice donors. Colored boxes on RACE gel images indicate bands corresponding to pictured fragments of the same color. Poly(A) reads track illustrates RNA-seq reads mapping partially to poly(A) tails. Coding potential evidence summary is from the Coding Potential Calculator. (B) RPKM values from RNA-seq reads from ribodepleted RNA time course (C) FISH of antisense EBNA3A transcripts.
FIG 7.

Sense and antisense transcription at the EBNA3B locus (A) RNA-seq read coverage from poly(A) selected and ribodepleted RNA. Blue annotation tracks represents consensus from RACE fragments. Green annotation track represents a 3′ RACE fragment (band indicated by green box on gel). Orange annotation tracks indicate 5′ RACE fragments (bands indicated by boxes on gel). Poly(A) reads track illustrates RNA-seq reads mapping partially to poly(A) tails. Coding potential evidence summary is from the Coding Potential Calculator. (B) RPKM values for RNA-seq time course using ribodepleted RNA. (C) Relative abundance of antisense transcription from 0 to 48 h measured by strand-specific qRT-PCR. Primer placement is shown in panel A. (D) Relative abundance of antisense transcription at 24 h after treatment with anti-IgG, anti-IgG plus PAA, or nothing (control). Results were obtained by strand-specific qRT-PCR. (E) Relative abundance of antisense transcription in the nucleus and cytoplasm at 24 h after treatment with anti-IgG. Results were obtained by strand-specific qRT-PCR. (F) FISH of antisense transcripts.
Noncoding antisense transcripts at EBNA2, EBNA3A, and EBNA3B.
The analysis of transcript sequences per se can facilitate initial functional predictions by revealing features such as open reading frames, homologous domains and known sequence motifs. As a first step toward the functional classification of these novel transcripts, we investigated the coding potential of antisense transcripts across the EBNA2, EBNA3A, and EBNA3B latency gene loci using the Coding Potential Calculator (16). The only open reading frames identified in these regions were found to be short, unreliable and with no homology to any proteins in the UniProt reference clusters. As a result, the coding potential scores for all transcripts indicated a high probability that they are noncoding RNAs (Fig. 5A, 6A, and 7A and data not shown).
A novel reading frame within the antisense EBNA3C region.
Sequence analysis of the EBNA3C region from the Akata genome revealed a 766-nucleotide open reading frame opposite the last coding exon of EBNA3C (see Fig. S3 in the supplemental material). This open reading frame shows substantial RNA-seq coverage from both polyadenylated and ribodepleted RNA, with the read depth increasing near the 5′ end of the open reading frame and decreasing near the 3′ end. It is conserved between the EBV strains B95-8 and AG876 (see Fig. S3 in the supplemental material), supporting the possibility that it may code for a functional protein.
Complex transcript structures at EBNA3 loci.
In a previous EBV RNA-seq study (6), analysis of novel intergenic transcripts using 5′ RACE revealed a more complex transcription pattern than we initially gleaned by simple visualization of coverage data. As an initial assessment of transcript structure(s) within the EBNA3A and EBNA3B regions, we performed 5′ and 3′ RACE using RNA isolated from cells induced for 24 h. Multiple primers were used for each analysis, and only ends generated from at least two different primers were considered candidate transcriptional start or stop sites [except in the case of the 3′ RACE experiment for an antisense EBNA3B transcript, in which only one primer was used but there was additional support for termination in the form of poly(A) containing reads and a canonical polyadenylation signal (see below)].
For the EBNA3A locus, we performed 5′ RACE on sense transcripts as well as antisense transcripts. Analysis of sense transcription revealed a considerably more complex picture than has previously been noted: we detected two novel start sites and a novel splice junction, each of which was supported by more than one 5′ RACE primer (Fig. 6A, uppermost gel). These RACE products were all detected using cDNA synthesized from poly(A) primers, indicating the presence of poly(A) tails on the transcripts. The novel splice junction contains the canonical GT-AG splice donor/acceptor dinucleotides and was detected in RNA-seq reads from both poly(A) selected and ribodepleted RNA harvested from cells induced for 24 h (see Fig. S6 in the supplemental material). The junction extends from within the BLLF1 locus to a location in the last exon of EBNA3A, completely bypassing the first coding exon of EBNA3A. The resulting transcript is predicted to code for a protein that is largely in the same reading frame as canonical EBNA3A but it contains unique N-terminal amino acids. Multiple other novel splice junctions in this locus were also detected in the RNA-seq reads, several of which were found at read depths substantially greater than those of the annotated EBNA3A splice junctions (see Fig. S6 in the supplemental material).
Two transcription start sites were also found for antisense transcripts in the EBNA3A region, and one transcription start site was found for an EBNA3B antisense transcript (Fig. 6A and 7A). The two start sites for EBNA3A antisense transcripts are separated by only 45 bp and generate overlapping transcripts. Both are supported by TATA boxes: the first start site (Fig. 6A, bottom antisense transcript) is 25 bp downstream of a classical TATAAA motif, while the second start site (Fig. 6A, top antisense transcript) is 24 bp downstream of the sequence TATACAA. These TATA box motifs are conserved in the EBV strain B95-8 (see Fig. S7A in the supplemental material).
As an additional method to detect 3′ ends in polyadenylated transcripts we extracted RNA-seq reads with runs of 5 or more Ts and at least two mismatches at their 5′ end from RNA isolated from 24-h-induced cells. When aligned to the Akata genome with BLAST, the positions of these reads showed good concordance with known lytic polyadenylation sites (see Fig. S4 in the supplemental material). We also observed a pileup of poly(T) reads corresponding to the end of an EBNA3B antisense transcript detected with one 3′ RACE primer (Fig. 7A). Further, the poly(T) reads and the end of the 3′ RACE fragment coincide with a canonical polyadenylation signal (AAUAAA motif and a downstream UG-rich element), which is conserved in both the B95-8 and the AG876 strains of EBV (see Fig. S7B in the supplemental material).
We also observed a pileup of poly(T) reads, indicating a potential 3′ end of an EBNA3A antisense transcript. Primers located upstream of these reads produced 5′ RACE products from cDNA generated with either random primers or poly(A) primers, whereas a primer located downstream of these reads produced a 5′ RACE product only from cDNA generated with random primers (Fig. 6A and data not shown). This provides evidence of a polyadenylated transcript overlapped by a transcript that is not polyadenylated.
Despite our findings of multiple transcript ends for EBNA3A and EBNA3B by RACE, it is clear that RNA-seq read coverage extends well beyond these start and stop sites (Fig. 5A, 6A, and 7A). Further, not shown are longer RACE fragments with ambiguous ends further connoting the presence of a greater number of distinct transcripts than we were able to definitively identify. The presence of multiple transcription start sites in both directions, overlapping transcripts and alternate splicing of known transcripts paints a very complex portrait of lytic viral transcription and indicates that the number of novel transcripts might be considerably higher than those predicted by simple calculations based on average known transcript lengths (as was done for the predictions shown in Fig. 3C).
Time course of antisense EBNA2, EBNA3A, and EBNA3B transcript expression.
To determine the phase of the lytic cascade where the EBNA2, EBNA3A, and EBNA3B antisense transcripts function, we calculated RPKM values using their respective sense exon coordinates across our induction time course. As was the case for most latent genes, the sense EBNA3A and 3B RPKM values peaked at 24 h, while the sense EBNA2 RPKM values were highest at 48 h, a finding consistent with observations made by Yuan et al. by microarray (5) (Fig. 5B, 6B, and 7B). Antisense RPKM values peaked at 24 h for all three genes, reaching values that were much higher than those of the sense transcripts (Fig. 5B, 6B, and 7B). These results were validated for EBNA2 and EBNA3B antisense transcription using the strand-specific qRT-PCR method developed by Feng et al. (17) (Fig. 5C and 7C).
Dependence of EBNA2 and EBNA3B antisense gene expression on viral DNA replication.
Because antisense EBNA2, EBNA3A, and EBNA3B expression kinetics were consistent with late gene expression, we used the viral DNA polymerase inhibitor phosphonoacetic acid (PAA) (20) to determine whether EBNA2 or EBNA3B expression was dependent on viral DNA replication. Akata cells were treated with anti-IgG and PAA, RNA was extracted after 24 h, and strand-specific qRT-PCR was used to measure abundance. We observed 82 and 97% inhibition of antisense EBNA2 and EBNA3B transcription, respectively, in PAA-treated versus untreated cells (Fig. 5D and 7D). This level of inhibition was substantially more than that observed with the immediate-early BZLF1 transcript and is comparable to that of late genes BBRF2, BOLF1, and BDLF1 observed by Lu et al. after PAA treatment. Sense EBNA2 transcription, in contrast, is known to be resistant to PAA treatment, while sense EBNA3B transcription is susceptible (4).
Cellular localization of novel transcripts.
The subcellular localization of noncoding RNA transcripts can suggest function, with cytoplasmic lncRNA often playing a role in mRNA stability, translation, or protein trafficking, and nuclear lncRNA frequently functioning in an epigenetic regulatory capacity (21). To determine the localization of novel transcripts antisense to EBNA2 and EBNA3B, we conducted strand-specific qRT-PCR on RNA extracted from both nuclear and cytoplasmic fractions of cells treated with anti-IgG for 24 h. Both EBNA2 antisense transcripts and EBNA3B antisense transcripts are 9-fold more abundant in the nucleus than in the cytoplasm (Fig. 5E and 6E). To further investigate cellular localization, we used FISH probes specific to EBNA2, EBNA3A, and EBNA3B antisense transcripts (see Fig. S5 in the supplemental material). All transcripts localized within the nucleus (Fig. 5F, 6C, and 7F; see also Videos S1, S2, and S3 in the supplemental material).
Novel EBV splice junctions.
Although EBV latency genes are spliced, only a few lytic genes are thought to contain more than a single exon. We used the junction mapper TopHat to locate splice junctions using RNA-seq data from cells induced for 24 h. TopHat reports only candidate junctions with the canonical GT-AG splice donor/acceptor dinucleotides, and we limited our reporting to junctions supported by at least five reads from the poly(A) selected RNA data or ten reads from the ribodepleted RNA data (because approximately twice as many reads from the ribodepleted RNA aligned to the EBV genome; see Table S1 in the supplemental material). Surprisingly, we identified approximately five times more splice junctions than have been previously annotated in latent or lytic genes combined (Fig. 8). All of the previously known lytic splice junctions were identified in the data sets from both poly(A) selected and ribodepleted RNA. Many annotated latency splice junctions were also detected but there were also several latent gene splice junctions that were not detected by these criteria. Although the latency gene loci are transcribed at this time point, the absence of their canonical splice junctions in the RNA-seq reads may reflect alternative splicing of latent genes during lytic reactivation. The EBNA3A locus, for example, contains several novel splice junctions at read depths comparable to or greater than the canonical splice junctions (see Fig. S6 in the supplemental material).
FIG 8.

Splice junctions at 24 h postinduction (A) Splice junctions supported by at least five RNA-seq reads from poly(A) selected RNA or by at least ten RNA-seq reads from ribodepleted RNA. Annotated splice junctions are color coded: blue, lytic genes; maroon, latent genes; and green, noncoding transcripts. (B) Venn diagram indicating numbers of junctions that are annotated, the number that are detected in poly(A) RNA data, and the number detected in ribodepleted RNA data. (C) Annotated and novel splice junctions detected in poly(A) selected or ribodepleted RNA.
Several canonical splice junctions in the EBNA genes are within the W repeat region; although all known W splice junctions were detected by TopHat, the repeated nature of this region prevents the attribution of the donor or acceptor sequence from any particular junction read to a specific repeat. Because of this ambiguity, splice junctions with donors or acceptors in the W repeat region were excluded from further analysis. In total, 58 new splice junctions were identified that were supported by data from both poly(A) selected and ribodepleted RNA. An additional 94 novel splice junctions were supported by data from either the ribodepleted or poly(A) selected RNA (Fig. 8B). In both data sets, the majority of junctions detected have not been previously annotated (Fig. 8C).
DISCUSSION
Using strand-specific RNA-seq, we have revealed complex bidirectional transcription throughout nearly all of the EBV genome during the lytic cascade. Although novel lytic transcription has previously been described in the few small intergenic regions of the EBV genome by both RNA-seq (6) and microarray (5), the use of strand-specific libraries has allowed us to also detect extensive antisense transcription at nearly every EBV gene. These newly identified transcripts are generally highly expressed, with their expression levels being comparable to the most abundant cellular genes.
Our initial estimates for the number of transcripts represented by novel transcription (Fig. 3C) were obtained by simply dividing the number of transcribed bases by average or median transcript lengths reported in the literature. Our most conservative estimate of at least 48 new genes was based on the number of transcribed bases (identified using poly(A) selected RNA) divided by the average length of human protein coding transcripts reported by John Rinn's lab in 2011 (19). Nevertheless, the use of poly(A) data for this analysis is probably not appropriate because it is not inclusive of nonpolyadenylated transcripts. We estimate the identification of 57 new genes if we apply the above criteria to the ribodepleted data, and this is probably more appropriate as our most conservative estimate (Fig. 3C). Notably though, long noncoding RNA transcripts are on average shorter than protein coding transcripts, and we found that 97.5% of EBV bases from ribodepleted RNA that show novel transcription do not fall within protein coding regions predicted by the eukaryotic virus version of the gene prediction software GeneMarkS (22). Considering that most of the novel transcripts are noncoding, and taking into account the number of transcribed bases identified using ribodepleted RNA, we predict that there may be as many as 280 more genes encoded by EBV than have been previously identified (Fig. 3C). Even this number is likely an underestimate because our calculations do not account for transcript overlaps or alternative splicing. As we have found previously (6) and as we have seen in the present study (Fig. 6A), detailed analysis of predicted EBV gene regions generally reveals significantly greater complexity than is discernible by simple visualization of RNA-seq reads. Further, here we have provided evidence of extensive novel splicing during reactivation (Fig. 6A and 8 and see Fig. S6 in the supplemental material). Currently, 94 genes and splice variants (excluding miRNAs) are annotated in the Akata genome: we have found evidence that the actual number of EBV genes is likely higher by severalfold. This is consistent with studies in human cytomegalovirus (HCMV) and Kaposi's sarcoma herpesvirus (KSHV) that are beginning to shed light on the extent of antisense and intergenic transcription in herpesviruses (23–25).
Noncoding and antisense transcripts have been shown to perform a wide array of functions in eukaryotic cells, such as the regulation of splicing (26) and DNA replication (27), protein localization (28), and transcriptional control (29). Several functional long noncoding herpesviral RNAs have been previously discovered: for example, the long noncoding KSHV transcript, polyadenylated nuclear RNA (PAN), has recently been shown to be critical for inducing the lytic transcription program of KSHV (30) while the noncoding latency-associated transcripts in herpes simplex virus repress lytic gene expression by modifying chromatin structure (31). Given the increasingly known pervasive nature of long noncoding RNAs in regulating cellular gene expression (21), it seems likely that many of the EBV lncRNAs similarly play a role in altering EBV chromatin and activating early and late gene expression. On the other hand, some of these may play a role in viral lytic DNA replication, possibly through scaffolding of protein complexes in a manner similar to RNAs that bind EBNA1 and cellular factors during EBV latency replication (32).
As an early step toward determining the functions of some of these new transcripts we investigated the subcellular localization of EBNA2, EBNA3A, and EBNA3B antisense transcripts. Strand-specific qRT-PCR in cytoplasmic and nuclear fractions revealed enrichment of the EBNA2 and EBNA3B antisense transcripts in the nucleus (Fig. 5E and 7E) and FISH experiments similarly showed nuclear staining of the EBNA2, EBNA3A, and EBNA3B antisense transcripts (Fig. 5F, 6C, and 7F; see also Videos S1, S2, and S3 in the supplemental material). Close inspection of the staining pattern for these transcripts shows a marked concentration within subnuclear regions of less intense DAPI (4′,6′-diamidino-2-phenylindole) staining. This suggests that they are located within the BMRF1 cores of viral replication compartments, which have been identified as storage centers for newly synthesized viral genomes (33, 34). The localization of these transcripts to nuclear compartments containing viral DNA is consistent with a possible role in altering gene expression or DNA replication. However, the expression of both EBNA2 and EBNA3B antisense transcripts peak at 24 h, and their expression is substantially reduced by the DNA replication inhibitor PAA, indicating that they are “late” genes. Other late gene products, such as the glycoproteins encoded by the BLRF1 and BLLF1 genes, are largely involved in virion structure and packaging (5). Intriguing possible roles for these genes could involve structural determination and packaging of virus. For example, heteroduplex-based binding of EBV lncRNAs to the viral genome could mark or tag the DNA for packaging, condensation, or nuclear export of the new viral genomes. Alternatively, noncoding transcripts may be involved in directing the second, “rolling circle” phase of viral DNA replication. This is still consistent with inhibition by PAA, since inhibition of the first phase of DNA replication may be sufficient to impact the expression of later genes. Indeed, Lu et al. observed 30 to 50% PAA inhibition of at least two genes involved in replication (4).
Although the EBNA antisense transcripts that we studied here appear to be noncoding, there is also the possibility that they (or other EBV lncRNAs) encode small peptides. Several studies suggest that small proteins translated from short open reading frames are abundant in mammalian genomes (35, 36). Interestingly, one antisense KSHV transcript that was previously annotated as noncoding has been found to encode a small peptide which plays a role in regulating its antisense partner, the KSHV replication and transcriptional activator RTA (37).
In addition to detecting abundant antisense transcription, we also observed a high level of complexity in the transcription of annotated genes. We identified a large number of previously unknown splice junctions, many of which appear to produce novel transcripts of known genes such as EBNA3A (Fig. 6A and 8; see also Fig. S6 in the supplemental material). Also, although we found evidence of splicing at most annotated splice junctions, we observed substantial RNA-seq read coverage throughout most of the introns. This could represent novel unspliced transcript variants of known genes, or additional transcripts such as stable intronic sequence RNA (38). Finally, we have identified multiple novel transcription start sites in the EBNA3A locus (Fig. 6A). HCMV has recently been demonstrated to make use of multiple transcription start sites to produce different polypeptides from its protein-coding loci (39): this may be a common strategy among herpesviruses to maximize the coding potential of their genomes.
Supplementary Material
ACKNOWLEDGMENTS
This study was supported by National Institutes of Health grants R01CA124311 and R01CA138268 to E.K.F., F31CA180449-01 to T.O., and P20GM103518 to Prescott Deininger.
Footnotes
Published ahead of print 20 November 2013
Supplemental material for this article may be found at http://dx.doi.org/10.1128/JVI.02989-13.
REFERENCES
- 1.Hjalgrim H, Friborg J, Melbye M. 2007. The epidemiology of EBV and its association with malignant disease, p 930–958 In Arvin A, Campadelli-Fiume G, Mocarski E. (ed), Human herpesviruses: biology, therapy, and immunoprophylaxis. Cambridge University Press, Cambridge, United Kingdom: [PubMed] [Google Scholar]
- 2.Longnecker R, Neipel F. 2007. Introduction to the human γ-herpesviruses, p 341–359 In Arvin A, Campadelli-Fiume G, Mocarski E. (ed), Human herpesviruses: biology, therapy, and immunoprophylaxis. Cambridge University Press, Cambridge, United Kingdom [Google Scholar]
- 3.Young L, Arrand J, Murray P. 2007. EBV gene expression and regulation, p 461–489 In Arvin A, Campadelli-Fiume G, Mocarski E. (ed), Human herpesviruses: biology, therapy, and immunoprophylaxis. Cambridge University Press, Cambridge, United Kingdom: [PubMed] [Google Scholar]
- 4.Lu CC, Jeng YY, Tsai CH, Liu MY, Yeh SW, Hsu TY, Chen MR. 2006. Genome-wide transcription program and expression of the Rta responsive gene of Epstein-Barr virus. Virology 345:358–372. 10.1016/j.virol.2005.09.064 [DOI] [PubMed] [Google Scholar]
- 5.Yuan J, Cahir-McFarland E, Zhao B, Kieff E. 2006. Virus and cell RNAs expressed during Epstein-Barr virus replication. J. Virol. 80:2548–2565. 10.1128/JVI.80.5.2548-2565.2006 [DOI] [PMC free article] [PubMed] [Google Scholar]
- 6.Concha M, Wang X, Cao S, Baddoo M, Fewell C, Lin Z, Hulme W, Hedges D, McBride J, Flemington EK. 2012. Identification of new viral genes and transcript isoforms during Epstein-Barr virus reactivation using RNA-Seq. J. Virol. 86:1458–1467. 10.1128/JVI.06537-11 [DOI] [PMC free article] [PubMed] [Google Scholar]
- 7.Edgar R, Domrachev M, Lash AE. 2002. Gene Expression Omnibus: NCBI gene expression and hybridization array data repository. Nucleic Acids Res. 30:207–210 [DOI] [PMC free article] [PubMed] [Google Scholar]
- 8.Lin Z, Wang X, Strong MJ, Concha M, Baddoo M, Xu G, Baribault C, Fewell C, Hulme W, Hedges D, Taylor CM, Flemington EK. 2013. Whole-genome sequencing of the Akata and Mutu Epstein-Barr virus strains. J. Virol. 87:1172–1182. 10.1128/JVI.02517-12 [DOI] [PMC free article] [PubMed] [Google Scholar]
- 9.Langmead B, Salzberg SL. 2012. Fast gapped-read alignment with Bowtie 2. Nat. Methods 9:357–359. 10.1038/nmeth.1923 [DOI] [PMC free article] [PubMed] [Google Scholar]
- 10.Kim D, Pertea G, Trapnell C, Pimentel H, Kelley R, Salzberg SL. 2013. TopHat2: accurate alignment of transcriptomes in the presence of insertions, deletions, and gene fusions. Genome Biol. 14:R36. 10.1186/gb-2013-14-4-r36 [DOI] [PMC free article] [PubMed] [Google Scholar]
- 11.Robinson JT, Thorvaldsdottir H, Winckler W, Guttman M, Lander ES, Getz G, Mesirov JP. 2011. Integrative genomics viewer. Nat. Biotechnol. 29:24–26. 10.1038/nbt.1754 [DOI] [PMC free article] [PubMed] [Google Scholar]
- 12.Thorvaldsdottir H, Robinson JT, Mesirov JP. 2013. Integrative Genomics Viewer (IGV): high-performance genomics data visualization and exploration. Brief Bioinform. 14:178–192. 10.1093/bib/bbs017 [DOI] [PMC free article] [PubMed] [Google Scholar]
- 13.Quinlan AR, Hall IM. 2010. BEDTools: a flexible suite of utilities for comparing genomic features. Bioinformatics 26:841–842. 10.1093/bioinformatics/btq033 [DOI] [PMC free article] [PubMed] [Google Scholar]
- 14.Xu G, Deng N, Zhao Z, Judeh T, Flemington E, Zhu D. 2011. SAMMate: a GUI tool for processing short read alignments in SAM/BAM format. Source Code Biol. Med. 6:2. 10.1186/1751-0473-6-2 [DOI] [PMC free article] [PubMed] [Google Scholar]
- 15.Zhang Z, Schwartz S, Wagner L, Miller W. 2000. A greedy algorithm for aligning DNA sequences. J. Comput. Biol. 7:203–214. 10.1089/10665270050081478 [DOI] [PubMed] [Google Scholar]
- 16.Kong L, Zhang Y, Ye ZQ, Liu XQ, Zhao SQ, Wei L, Gao G. 2007. CPC: assess the protein-coding potential of transcripts using sequence features and support vector machine. Nucleic Acids Res. 35:W345–W349. 10.1093/nar/gkm391 [DOI] [PMC free article] [PubMed] [Google Scholar]
- 17.Feng L, Lintula S, Ho TH, Anastasina M, Paju A, Haglund C, Stenman UH, Hotakainen K, Orpana A, Kainov D, Stenman J. 2012. Technique for strand-specific gene-expression analysis and monitoring of primer-independent cDNA synthesis in reverse transcription. Biotechniques 52:263–270. 10.2144/0000113842 [DOI] [PubMed] [Google Scholar]
- 18.Derrien T, Johnson R, Bussotti G, Tanzer A, Djebali S, Tilgner H, Guernec G, Martin D, Merkel A, Knowles DG, Lagarde J, Veeravalli L, Ruan X, Ruan Y, Lassmann T, Carninci P, Brown JB, Lipovich L, Gonzalez JM, Thomas M, Davis CA, Shiekhattar R, Gingeras TR, Hubbard TJ, Notredame C, Harrow J, Guigo R. 2012. The GENCODE v7 catalog of human long noncoding RNAs: analysis of their gene structure, evolution, and expression. Genome Res. 22:1775–1789. 10.1101/gr.132159.111 [DOI] [PMC free article] [PubMed] [Google Scholar]
- 19.Cabili MN, Trapnell C, Goff L, Koziol M, Tazon-Vega B, Regev A, Rinn JL. 2011. Integrative annotation of human large intergenic noncoding RNAs reveals global properties and specific subclasses. Genes Dev. 25:1915–1927. 10.1101/gad.17446611 [DOI] [PMC free article] [PubMed] [Google Scholar]
- 20.Summers WC, Klein G. 1976. Inhibition of Epstein-Barr virus DNA synthesis and late gene expression by phosphonoacetic acid. J. Virol. 18:151–155 [DOI] [PMC free article] [PubMed] [Google Scholar]
- 21.Mercer TR, Mattick JS. 2013. Structure and function of long noncoding RNAs in epigenetic regulation. Nat. Struct. Mol. Biol. 20:300–307. 10.1038/nsmb.2480 [DOI] [PubMed] [Google Scholar]
- 22.Besemer J, Lomsadze A, Borodovsky M. 2001. GeneMarkS: a self-training method for prediction of gene starts in microbial genomes. Implications for finding sequence motifs in regulatory regions. Nucleic Acids Res. 29:2607–2618. 10.1093/nar/29.12.2607 [DOI] [PMC free article] [PubMed] [Google Scholar]
- 23.Zhang G, Raghavan B, Kotur M, Cheatham J, Sedmak D, Cook C, Waldman J, Trgovcich J. 2007. Antisense transcription in the human cytomegalovirus transcriptome. J. Virol. 81:11267–11281. 10.1128/JVI.00007-07 [DOI] [PMC free article] [PubMed] [Google Scholar]
- 24.Chandriani S, Xu Y, Ganem D. 2010. The lytic transcriptome of Kaposi's sarcoma-associated herpesvirus reveals extensive transcription of noncoding regions, including regions antisense to important genes. J. Virol. 84:7934–7942. 10.1128/JVI.00645-10 [DOI] [PMC free article] [PubMed] [Google Scholar]
- 25.Gatherer D, Seirafian S, Cunningham C, Holton M, Dargan DJ, Baluchova K, Hector RD, Galbraith J, Herzyk P, Wilkinson GW, Davison AJ. 2011. High-resolution human cytomegalovirus transcriptome. Proc. Natl. Acad. Sci. U. S. A. 108:19755–19760. 10.1073/pnas.1115861108 [DOI] [PMC free article] [PubMed] [Google Scholar]
- 26.Barry G, Briggs JA, Vanichkina DP, Poth EM, Beveridge NJ, Ratnu VS, Nayler SP, Nones K, Hu J, Bredy TW, Nakagawa S, Rigo F, Taft RJ, Cairns MJ, Blackshaw S, Wolvetang EJ, Mattick JS. The long non-coding RNA Gomafu is acutely regulated in response to neuronal activation and involved in schizophrenia-associated alternative splicing. Mol. Psychiatr., in press. 10.1038/mp.2013.45 [DOI] [PubMed] [Google Scholar]
- 27.Christov CP, Gardiner TJ, Szuts D, Krude T. 2006. Functional requirement of noncoding Y RNAs for human chromosomal DNA replication. Mol. Cell. Biol. 26:6993–7004. 10.1128/MCB.01060-06 [DOI] [PMC free article] [PubMed] [Google Scholar]
- 28.Willingham AT, Orth AP, Batalov S, Peters EC, Wen BG, Aza-Blanc P, Hogenesch JB, Schultz PG. 2005. A strategy for probing the function of noncoding RNAs finds a repressor of NFAT. Science 309:1570–1573. 10.1126/science.1115901 [DOI] [PubMed] [Google Scholar]
- 29.Tufarelli C, Stanley JA, Garrick D, Sharpe JA, Ayyub H, Wood WG, Higgs DR. 2003. Transcription of antisense RNA leading to gene silencing and methylation as a novel cause of human genetic disease. Nat. Genet. 34:157–165. 10.1038/ng1157 [DOI] [PubMed] [Google Scholar]
- 30.Rossetto CC, Tarrant-Elorza M, Verma S, Purushothaman P, Pari GS. 2013. Regulation of viral and cellular gene expression by Kaposi's sarcoma-associated herpesvirus polyadenylated nuclear RNA. J. Virol. 87:5540–5553. 10.1128/JVI.03111-12 [DOI] [PMC free article] [PubMed] [Google Scholar]
- 31.Cliffe AR, Garber DA, Knipe DM. 2009. Transcription of the herpes simplex virus latency-associated transcript promotes the formation of facultative heterochromatin on lytic promoters. J. Virol. 83:8182–8190. 10.1128/JVI.00712-09 [DOI] [PMC free article] [PubMed] [Google Scholar]
- 32.Norseen J, Thomae A, Sridharan V, Aiyar A, Schepers A, Lieberman PM. 2008. RNA-dependent recruitment of the origin recognition complex. EMBO J. 27:3024–3035. 10.1038/emboj.2008.221 [DOI] [PMC free article] [PubMed] [Google Scholar]
- 33.Daikoku T, Kudoh A, Fujita M, Sugaya Y, Isomura H, Shirata N, Tsurumi T. 2005. Architecture of replication compartments formed during Epstein-Barr virus lytic replication. J. Virol. 79:3409–3418. 10.1128/JVI.79.6.3409-3418.2005 [DOI] [PMC free article] [PubMed] [Google Scholar]
- 34.Sugimoto A, Sato Y, Kanda T, Murata T, Narita Y, Kawashima D, Kimura H, Tsurumi T. 2013. Different distributions of Epstein-Barr virus early and late gene transcripts within viral replication compartments. J. Virol. 87:6693–6699. 10.1128/JVI.00219-13 [DOI] [PMC free article] [PubMed] [Google Scholar]
- 35.Frith MC, Forrest AR, Nourbakhsh E, Pang KC, Kai C, Kawai J, Carninci P, Hayashizaki Y, Bailey TL, Grimmond SM. 2006. The abundance of short proteins in the mammalian proteome. PLoS Genet. 2:e52. 10.1371/journal.pgen.0020052 [DOI] [PMC free article] [PubMed] [Google Scholar]
- 36.Slavoff SA, Mitchell AJ, Schwaid AG, Cabili MN, Ma J, Levin JZ, Karger AD, Budnik BA, Rinn JL, Saghatelian A. 2013. Peptidomic discovery of short open reading frame-encoded peptides in human cells. Nat. Chem. Biol. 9:59–64. 10.1038/nchembio.1120 [DOI] [PMC free article] [PubMed] [Google Scholar]
- 37.Jaber T, Yuan Y. 2013. A virally encoded small peptide regulates RTA stability and facilitates Kaposi's sarcoma-associated herpesvirus lytic replication. J. Virol. 87:3461–3470. 10.1128/JVI.02746-12 [DOI] [PMC free article] [PubMed] [Google Scholar]
- 38.Moss WN, Steitz JA. 2013. Genome-wide analyses of Epstein-Barr virus reveal conserved RNA structures and a novel stable intronic sequence RNA. BMC Genomics 14:543. 10.1186/1471-2164-14-543 [DOI] [PMC free article] [PubMed] [Google Scholar]
- 39.Stern-Ginossar N, Weisburd B, Michalski A, Le VT, Hein MY, Huang SX, Ma M, Shen B, Qian SB, Hengel H, Mann M, Ingolia NT, Weissman JS. 2012. Decoding human cytomegalovirus. Science 338:1088–1093. 10.1126/science.1227919 [DOI] [PMC free article] [PubMed] [Google Scholar]
Associated Data
This section collects any data citations, data availability statements, or supplementary materials included in this article.