

Abstract
H2N2 influenza A viruses were the cause of the 1957-1958 pandemic. Historical evidence demonstrates they arose from avian virus ancestors, and while the H2N2 subtype has disappeared from humans, it persists in wild and domestic birds. Reemergence of H2N2 in humans is a significant threat due to the absence of humoral immunity in individuals under the age of 50. Thus, examination of these viruses, particularly those from the avian reservoir, must be addressed through surveillance, characterization, and antiviral testing. The data presented here are a risk assessment of 22 avian H2N2 viruses isolated from wild and domestic birds over 6 decades. Our data show that they have a low rate of genetic and antigenic evolution and remained similar to isolates circulating near the time of the pandemic. Most isolates replicated in mice and human bronchial epithelial cells, but replication in swine tissues was low or absent. Multiple isolates replicated in ferrets, and 3 viruses were transmitted to direct-contact cage mates. Markers of mammalian adaptation in hemagglutinin (HA) and PB2 proteins were absent from all isolates, and they retained a preference for avian-like α2,3-linked sialic acid receptors. Most isolates remained antigenically similar to pandemic A/Singapore/1/57 (H2N2) virus, suggesting they could be controlled by the pandemic vaccine candidate. All viruses were susceptible to neuraminidase inhibitors and adamantanes. Nonetheless, the sustained pathogenicity of avian H2N2 viruses in multiple mammalian models elevates their risk potential for human infections and stresses the need for continual surveillance as a component of prepandemic planning.
INTRODUCTION
In 1957, a novel influenza virus of the subtype H2N2 emerged in humans in Southeast Asia, rapidly spread worldwide, and caused the second pandemic of the 20th century (1–3). The pandemic virus possessed hemagglutinin (HA), neuraminidase (NA), and PB1 polymerase genes from avian viruses of wild duck origin, and the remaining genes were from the circulating human H1N1 virus (2, 4). Morbidity and mortality rates during the 1957-1958 pandemic were significantly lower than those during the precursor 1918 “Spanish influenza” pandemic, yet estimates of worldwide mortality are between 1 to 4 million (3). The pandemic subsided by 1958, and the virus established a stable presence in humans for only a decade. It was displaced after reassortment events led to the emergence of the H3N2 virus in the 1968 pandemic (1, 3, 5, 6).
Only influenza viruses of the subtypes H1, H2, and H3 have maintained a sustained presence in humans. Of late, study of the pandemic potential of H5, H7, and H9 subtype viruses has dominated scientific discussion, but they have yet to establish successful circulation and human-to-human transmission. The first pandemic of the 21st century was not caused by H5, H7, or H9 but instead by recycling of the H1N1 subtype in the form of a virus that was antigenically distinct from those already circulating in humans (7, 8). Both the reemergence of a pandemic H1N1 virus and the relative lack of widespread human infections with novel subtypes have led some to hypothesize that only H1, H2, and H3 viruses possess the potential to establish stable circulation in humans. H1 and H3 viruses are currently endemic; therefore, attention has turned to the possible return of the H2 virus (9–11). Of primary concern is the absence of this subtype from humans for more than 5 decades. This has resulted in most individuals younger than 50 years lacking humoral immunity to the H2 antigen (11). The proven pandemic potential of H2N2 and the threat to an immunologically naive population justify continued study into the risk it poses to the public.
Migratory waterfowl are the reservoir for influenza A viruses, and all pandemics of the past century, including the 2009 pandemic virus, contained influenza genes of direct avian lineage (12). The exact origin of the pandemic H2N2 virus is unknown. There is little evidence that they adapted by passage through a mammalian intermediate host (i.e., pigs). The pandemic viruses did, however, contain multiple genes from avian influenza viruses. Some human isolates were genetically and phenotypically avian-like in respect to receptor binding and antigenicity (13, 14). Together, these characteristics suggest the contribution of an avian precursor. Though it currently does not circulate in humans, the H2 subtype persists in wild and domestic bird populations (15, 16). Further, these avian viruses display a high degree of genetic and antigenic similarity to ancestral viruses that contributed genes to the 1957 pandemic (2, 15–17). The small number of studies of the pathogenesis of H2 viruses have focused largely on human pandemic or swine H2N3 isolates (14, 18), while examination into the pathogenesis of avian H2N2 viruses is limited. In the present study, we evaluated 22 H2N2 viruses of avian origin to determine their ability to infect mammals and ultimately evaluate their risk potential for emergence from the avian reservoir and movement into humans. To this end, we have characterized these avian H2N2 viruses in respect to antigenic and genetic properties, receptor binding specificity, replication in primary normal human bronchial epithelial (NHBE) cells and porcine tracheal respiratory explants, pathogenicity and transmission in animal models, and antiviral susceptibility.
MATERIALS AND METHODS
Ethics statement.
All experiments using human H2N2 isolates or animals infected with H2 viruses were conducted in a biosafety level 3 enhanced containment laboratory in accordance with USDA 9 CFR 121 and 7 CFR 331.
Animals experiments were approved by the St. Jude Children's Research Hospital Animal Care and Use Committee and were performed in compliance with the policies of the National Institutes of Health and the Animal Welfare Act.
Viruses.
Unless otherwise noted, viruses used in this study (Table 1) were obtained from the St. Jude Children's Research Hospital repository. A/Mallard/Minnesota/Al08-3437/2008 (H2N2), A/Mallard/Minnesota/355777/2000 (H2N2), and A/Mallard/Minnesota/182717/98 (H2N2) were kindly provided by David Stalknecht (University of Georgia, Athens, GA), and A/Chicken/NewYork/Sg-00425/2004 (H2N2) and A/Chicken/PA/298108-4/2004 (H2N2) were kindly provided by Carol Cardona (University of Minnesota, St. Paul, MN). Candidate viruses were chosen to represent a wide range of species, geographic, and temporal isolates. One virus, Mal/Pot177/83, was previously reported as H2N2 but later confirmed as H2N1 by sequence analysis of the neuraminidase gene and neuraminidase inhibition assay (19) (data not shown). All viruses were propagated in 10-day-old, embryonated chicken eggs, and 50% egg infectious doses (EID50) were determined by the method of Reed and Muench (20). Viruses used in these studies represent either 2 or 3 passages in eggs with the exception of A/Chicken/NY/29878/91 (H2N2) and A/Swine/MO/2124514/2006, which were passaged 4 times in eggs before use.
TABLE 1.
H2 influenza viruses used in this study
| Categorya | Animal origin | Virus | Subtype | Abbreviation |
|---|---|---|---|---|
| Eurasian | Wild | A/Mallard/MT/Y61 | H2N2 | Mal/MT/61 |
| Wild | A/Mallard/Potsdam/177-4/1983 | H2N1 | Mal/Pot177/83 | |
| Wild | A/Mallard/Potsdam/179/1983 | H2N2 | Mal/Pot179/83 | |
| Domestic | A/Duck/Hong Kong/273/1978 | H2N2 | Dk/HK273/78 | |
| Domestic | A/Duck/Hong Kong/319/1978 | H2N2 | Dk/HK319/79 | |
| Domestic | A/Chicken/Jena/4836/1983 | H2N2 | Ck/Jena/83 | |
| Domestic | A/Chicken/Jena/4705/1984 | H2N2 | Ck/Jena/84 | |
| North American | Wild | A/Blue-wingedTeal/Alberta/604/1978 | H2N2 | Bwt/Alb/78 |
| Wild | A/Mallard/NewYork/6750/1978 | H2N2 | Mal/NY/78 | |
| Wild | A/Mallard/Minnesota/182717/1998 | H2N2 | Mal/MN/98 | |
| Wild | A/Mallard/Minnesota/355777/2000 | H2N2 | Mal/MN/00 | |
| Wild | A/Mallard/Minnesota/AI08-3437/2008 | H2N2 | Mal/MN/08 | |
| Domestic | A/Chicken/Connecticut/13657/1990 | H2N2 | Ck/CT/90 | |
| Domestic | A/Chicken/Pennsylvania/24825/1991 | H2N2 | Ck/PA/91 | |
| Domestic | A/Chicken/NewYork/29878/1991 | H2N2 | Ck/NY/91 | |
| Domestic | A/GuineaFowl/NewYork/4449-12/1994 | H2N2 | GF/NY/94 | |
| Domestic | A/Duck/NewJersey/7872-27/1995 | H2N2 | Dk/NJ/95 | |
| Domestic | A/GuineaFowl/NewYork/13824/1995 | H2N2 | GF/NY/95 | |
| Domestic | A/Chicken/NewYork/13828-3/1995 | H2N2 | Ck/NY/95 | |
| Domestic | A/Chicken/NewJersey/13839-17/1995 | H2N2 | Ck/NJ/95 | |
| Domestic | A/Chicken/NewYork/Sg-00425/2004 | H2N2 | Ck/NY/04 | |
| Domestic | A/Chicken/Pennsylvania/298101-4/2004 | H2N2 | Ck/PA/04 | |
| Nonavian | Swine | A/Swine/Missouri/2124514/2006 | H2N3 | Sw/MO/06 |
“Category” indicates geographic region or a nonavian isolate.
Cells.
Madin-Darby canine kidney (MDCK) cells (ATCC, Manassas, VA) were cultured in modified Eagle's medium (MEM; CellGro, Herndon, VA) supplemented with 5% fetal bovine serum (FBS; Thermo Scientific HyClone, Logan, UT) at 37°C in 5% CO2. Primary normal human bronchial epithelial (NHBE) cells (Lonza, Walkersville, MD) from a 2-year-old healthy female donor were expanded, cryopreserved, and cultured in an air-liquid interface (ALI) system on Transwell inserts (Corning, NY) (21). ALI was established after cells reached confluence. The apical surface of the cells was exposed to a humidified 95% air and 5% CO2 environment for a minimum of 5 weeks. Basal medium (bronchial epithelial cell basal medium supplemented with SingleQuot growth factors; Lonza) was changed every 48 h, and the apical surface was washed to remove mucus.
Swine tracheal explants.
Piglets (1 week old) were kindly provided by C. Leffler and E. Parfenova (University of Tennessee, Memphis, TN) and were humanely euthanized. The tracheas were removed and washed with phosphate-buffered saline (PBS) containing penicillin-streptomycin-amphotericin B (Sigma, St. Louis, MO). The tracheas were opened by a single lengthwise incision, and explants (5 mM in diameter) were prepared with a biopsy punch. The explants were grown on Transwell inserts, and 1 ml of medium (as described for NHBE culture) was added to the basal chamber. Tissues were incubated at 37°C in 5% CO2 for at least 18 h before infection.
Sequencing.
Viral RNA from allantoic fluid was extracted by a QIAamp vRNA kit (Qiagen, Valencia, CA) and amplified by performing a one-step reverse transcription (RT)-PCR assay (Qiagen). HA and M gene sequencing was accomplished by using overlapping primer pairs and the Sanger platform (Hartwell Center for Bioinformatics and Biotechnology, SJCRH). Additional full-length HA, M, and PB2 sequences were obtained from GenBank (available from the corresponding author by request). M gene sequences were spliced to analyze M2 gene products. Evolutionary trees of HA genes were prepared from Sanger-acquired, full-length sequences in MEGA version 5.05 software by using the following parameters: ClustalW, neighbor-joining analysis, 1,000 bootstrap tests, maximum composite likelihood, pairwise analysis.
Serology.
Viruses were screened for antigenicity against a variety of sera in the hemagglutinin inhibition (HI) test described previously (22) using chicken and/or horse red blood cells as indicated. Sera were generated in ferrets or chickens by infection via the natural route (intranasal or oculonasal, respectively). Animals were boosted after 2 weeks by intramuscular injection of virus without adjuvant, and blood was collected 1 week later for serum isolation. Sera against virus A/Mallard/MT/Y61 was used without a boost. Sera against A/Chicken/Pennsylvania/298101-4/2004 and A/Singapore/1/1957 were kindly provided by C. Cardona (University of Minnesota, St. Paul, MN) and R. Fouchier (Erasmus Medical Center, Rotterdam, Netherlands), respectively. Results presented are representative of two independent tests.
Sensitivity to neuraminidase inhibitors.
The following neuraminidase inhibitors (NAIs) were used: oseltamivir carboxylate (oseltamivir) from Hoffmann-La Roche (Basel, Switzerland), zanamivir from GlaxoSmithKline (Research Triangle Park, NC), and peramivir from BioCryst Pharmaceuticals (Birmingham, AL). A modified fluorometric assay using the fluorogenic substrate 2′-(4-methylumberlliferyl)-α-d-N-acetylneuraminic acid (MUNANA; Sigma-Aldrich, St. Louis, MO) was performed to determine viral NA activity and used influenza A/Fukui/20/2004 (E119) (wild-type virus) and A/Fukui/45/2004 (E119V) in each round as reference viruses (23). Influenza viruses were standardized to equivalent NA activity and incubated with NAIs (concentration range, 5 × 10⁻⁷ μM to 2 μM). The fluorescence of the released 4-methylumbelliferone was measured in a Synergy 2 microplate reader (Biotek, Winooski, VT) at excitation and emission wavelengths of 360 nM and 460 nM, respectively. The drug concentration that inhibited 50% of the NA enzymatic activity (IC50) was determined from the dose-response curve with GraphPad software (La Jolla, CA). Box plot analysis was performed with GraphPad software as described previously (24). Results are representative of two independent tests.
Receptor binding assays.
Receptor binding specificity was determined by assaying the relative association to biotinylated sialylglycopolymers (Glycotech, Gaithersburg, MD): 3′sialyllactose (3′SL; Neu5Acα2,3Galβ1,4Glc) and 6′sialyllactosamine (6′SLN; Neu5Acα2,6Galβ1,4Glcβ) as previously described (25). Briefly, 128 hemagglutinating units of each virus were coated to wells of enzyme-linked immunosorbent assay (ELISA) plates previously coated with fetuin and incubated overnight at 4°C. Plates were washed with PBS-0.01% Tween 80 (PBST); unbound sites were blocked with PBST containing 0.1% bovine serum albumin (BSA), and dilutions of sialylglycopolymers were prepared in reaction buffer (PBST, 0.1% BSA, 1 μM oseltamivir carboxylate) and added to plates for 1.5 h at 4°C. Plates were then washed, and streptavidin-horse radish peroxidase (HRP) (BD Biosciences, San Jose, CA) was added for 1 h at 4°C. Plates were washed and incubated with tetramethylbenzidine substrate solution (BD Biosciences) for 30 min, and the reaction was stopped by adding 2 M H2SO4. The absorbance at 450 nM (A450) was read on a Synergy microplate reader (Biotek). Scatchard plots (A450/polymer concentration compared to A450) were prepared from each set of data, and the x (Amax) and y (Y0) values were calculated from the slope of the line. The apparent association (Kass = Y0/Amax) and the relative affinity to 3′SL polymer (Kass 3′SL/Kass 6′SLN) were calculated for each virus. Results are representative of three independent tests.
NHBE and swine explant infections.
Apical surfaces of NHBE cells or explants were washed with PBS and equilibrated at 37°C for 30 min with infection medium (bronchial epithelial cell basal medium; Lonza) containing 0.5% BSA. One hundred microliters of virus inoculum (multiplicity of infection [MOI] of 0.001 in NHBE cells or 106 EID50 units per explant) was prepared from each virus and added to the apical surface of the tissues for 1 h. The surfaces were given 2 brief acid washes (PBS, pH 2.2) and 3 PBS washes to remove unbound virus. At each time point (every 24 h for 4 days), 300 μl of infection medium was added to the apical surface for 30 min and harvested, and titers were determined on MDCKs, with 50% tissue culture infectious dose (TCID50) determined by the method of Reed and Muench (20). NHBE cell data are representative of combined data from two independent tests of 3 inserts per virus group. Swine explant data are representative of 2 independent tests with 3 explants per virus group.
Mouse infections.
Six- to eight-week-old DBA/2J mice (Charles River, Wilmington, MA) were lightly anesthetized with isoflurane (Baxter Healthcare, Deerfield, IL) and intranasally administered 106 EID50 units of virus in a 50-μl volume. Mice (n = 5/virus group) were monitored daily for morbidity (i.e., weight loss) and mortality. Those displaying ≥30% loss of starting weight were humanely euthanized. Additional mice (n = 3 or fewer depending on virus mortality rate and number of remaining animals) were euthanized at 5 days postinfection (dpi), and one half of each lung was removed and homogenized in 1 ml of PBS. EID50 values were determined as previously described. At 14 to 16 dpi, blood from 3 animals per experimental group was collected, and seroconversion to homologous challenge virus was determined by performing HI assays (22) with horse red blood cells. Results represent a single screen of each virus in mice, with a follow-up replicate experiment using the viruses chosen for further study in swine explants, ferrets, and receptor binding experiments.
Ferret infections.
Eight-month-old male ferrets (Triple F Farms, Sayre, PA) were verified as being seronegative for influenza A (H1 and H3 subtypes) and B in the HI assay. Two sets of 3 ferrets were used for each virus group, and each set included 1 inoculated donor, 1 direct contact housed in the same cage with the donor, and 1 aerosol contact housed in an adjacent cage separated by a permeable barrier that allowed free airflow but excluded animal contact. Donor ferrets were lightly anesthetized by isoflurane and intranasally inoculated with 106 EID50 units of virus in a total volume of 1 ml. Twenty-four hours later, direct and aerosol contacts were introduced. Every 48 h, the ferrets' temperatures and weights were recorded before they were sedated with ketamine (25 mg/kg of body weight) (26, 27) and induced to sneeze by intranasal instillation of PBS. The viral titer of nasal washes was determined in MDCK cells, and TCID50 values were determined as previously described. At 14 to 16 dpi (i.e., once shedding had ceased), blood was collected from both donor and contacts to determine seroconversion to homologous challenge virus via HI assay (22) using horse red blood cells.
Statistical analyses.
All experiments except the DBA/2J screen are representative of or are data combined from 2 or 3 independent tests as indicated. The mean values ± standard deviations and statistical significance were determined by Excel (Microsoft, Redmond, WA) or by using GraphPad Prism version 5 (GraphPad Software, La Jolla, CA) to perform t tests.
RESULTS
Virus selection and antigenic analysis.
The 22 avian viruses chosen for analysis were isolated from domestic birds (i.e., chicken, guinea fowl, duck) and wild birds (i.e., duck) between 1961 and 2008. A recent swine H2N3 virus was included as a control for experiments using mammalian models of infection or receptor binding. North American and Eurasian isolates were included for geographical diversity (Table 1). Phylogenetic analysis and construction of an evolutionary tree based upon full-length HA sequences revealed division into two primary branches based largely upon geographical distribution (data not shown), similar to previous findings (16, 17). The Eurasian branch includes many older viruses most closely related to pandemic human isolates, and the North American branch includes mostly contemporary isolates (Table 1 and data not shown). Two North American isolates (Ck/NY/91 and Ck/PA/04) clustered in the Eurasian branch.
Analysis of the antigenic relationships between the avian H2N2 viruses was accomplished using a panel of antisera generated against viruses from multiple species, including (i) three Eurasian avian virus antisera which represent approximately 2-decade intervals since the introduction of the H2 subtype from birds into humans [Mal/MT/61 (H2N2), Ck/Jena/84 (H2N2), A/Duck/Shantou/992/2000 (H2N8)], (ii) one North American avian antisera (Ck/PA/04), (iii) two human virus antisera which represent either a pandemic or seasonal isolate [A/Singapore/1/1957 (H2N2), A/Netherlands/65/1968 (H2N2)], and (iv) one swine virus antisera [A/Sw/MO/06 (H2N3)]. Nearly all viruses tested reacted with all three Eurasian sera. Two contemporary viruses (Mal/MN/08 and Mal/MN/00) failed to react with antisera to Mal/MT/61 and Dk/Shan/00, respectively. Reactivity to the North American sera was considerably lower, with only 6 viruses in the panel (including the homologous control) reacting. All but 8 viruses reacted to the human pandemic virus A/Singapore/1/57, demonstrating that the avian H2 viruses used here retain antigenic similarity to those viruses present during the introduction of H2N2 into humans. Few of the viruses reacted with antisera to human seasonal virus A/Netherlands/65/1968 (including all North American isolates) (Table 2). All viruses in the panel reacted with the Sw/MO/06 antisera (18). Overall, these data suggest that most isolates in this study are antigenically related and most similar to avian viruses circulating in Eurasia and to a North American swine H2N3 virus. Additionally, the isolates are more closely related to the human pandemic viruses than to those human seasonal viruses isolated near the end of the H2N2 circulation period.
TABLE 2.
Antigenic characterization of avian H2N2 influenza viruses by HI assay
| Categoryb | Animal origin | H2N2 isolate | Postinfection ferret serum titer raised againsta: |
||||||
|---|---|---|---|---|---|---|---|---|---|
| Avian viruses |
Human viruses |
Swine virus Sw/MO/06 | |||||||
| Mal/MT/61 | Ck/Jena/84 | Dk/Shan/00c | Ck/PA/04 | Sing/57d | Neth/68 | ||||
| Eurasian | Wild | Mal/MT/61 | 320 | 160 | 640 | < | 320 | 20 | 160 |
| Wild | Mal/Pot177/83 (H2N1) | 80 | 160 | 640 | < | 80 | 20 | 80 | |
| Wild | Mal/Pot179/83 | 80 | 160 | 640 | < | 80 | 20 | 80 | |
| Domestic | Dk/HK273/78 | 160 | 320 | 640 | < | 80 | 40 | 160 | |
| Domestic | Dk/HK319/79 | 160 | 160 | 640 | 20 | 40 | 20 | 80 | |
| Domestic | Ck/Jena/83 | 320 | 320 | 640 | 20 | < | 40 | 80 | |
| Domestic | Ck/Jena/84 | 160 | 640 | 640 | 20 | < | 20 | 160 | |
| North American | Wild | Bwt/Alb/78 | 40 | 160 | 640 | < | 80 | < | 160 |
| Wild | Mal/NY/78 | 80 | 160 | 640 | < | 80 | < | 80 | |
| Wild | Mal/MN/98 | 80 | 20 | 640 | 20 | < | < | 320 | |
| Wild | Mal/MN/00 | 40 | 40 | < | < | < | < | 40 | |
| Wild | Mal/MN/08 | < | 20 | 20 | < | < | < | 40 | |
| Domestic | Ck/CT/90 | 80 | 80 | 640 | < | 80 | < | 160 | |
| Domestic | Ck/PA/91 | 80 | 80 | 640 | < | 40 | < | 40 | |
| Domestic | Ck/NY/91 | 40 | 80 | 640 | < | < | < | 40 | |
| Domestic | Dk/NJ/95 | 40 | 80 | 640 | < | < | < | 40 | |
| Domestic | GF/NY/95 | 40 | 160 | 640 | < | 40 | < | 80 | |
| Domestic | Ck/NY/95 | 80 | 80 | 640 | < | 40 | < | 80 | |
| Domestic | Ck/NJ/95 | 40 | 40 | 320 | < | 40 | < | 40 | |
| Domestic | Ck/NY/04 | 80 | 160 | 640 | 80 | 40 | < | 160 | |
| Domestic | Ck/PA/04 | 80 | 160 | 640 | 160 | < | 20 | 80 | |
| Control | Human | A/Singapore/1/57 | ND | ND | ND | ND | 320 | ND | ND |
| Human | A/Netherlands/65/68 | 160 | ND | ND | 80 | ND | 320 | ND | |
| Wild | A/WildDuck/Shantou/992/00 (H2N8) | ND | ND | 1,280 | < | ND | ND | ND | |
| Swine | Sw/MO/06 (H2N3) | 160 | 40 | 640 | ND | 40 | 20 | 320 | |
HI titers shown are the reciprocal of the highest doubling dilution that inhibited 4 hemagglutinating units of virus using horse red blood cells. “<” represents a titer below the cutoff of 1:20 serum dilution. ND, not determined; boldface, homologous virus control.
“Category” indicates geographic region or a nonavian isolate.
This serum was produced in chickens.
This serum was used with chicken red blood cells.
Replication in DBA/2J mice.
DBA/2J mice are susceptible to infection with a wide range of influenza viruses and are a viable mammalian model for screening the pathogenicity of large numbers of isolates (28–30). We tested the ability of avian H2N2 viruses to infect DBA/2J mice and cause disease as scored by morbidity (i.e., weight loss) and virus replication in the lungs. Mouse-adapted A/PuertoRico/8/34 (H1N1) virus (PR/8) was used as a positive control. Despite the avian origin of the H2N2 viruses, all were pathogenic in mice, as assessed by the ability to either induce ≥5% weight loss, replicate in the lungs, or both (Fig. 1 and Table 3). Although only 9 of the 22 viruses (41%) met both criteria, 19 (86%) replicated in the lungs (mean titer of ≥1 log10 TCID50), demonstrating that avian H2N2 viruses can replicate in mice without inducing morbidity. The swine H2N3 and PR/8 viruses induced high morbidity and mortality rates (100%) and replicated to high titers in the lungs (6.4 log10 to 7.5 log10 TCID50/ml) as expected (Fig. 1, Table 3). Three virulence classifications were constructed on the basis of the morbidity criterion: high (>10% loss of initial weight), intermediate (5 to 10% loss of initial weight), and low (<5% loss of initial weight). Five avian viruses induced mortality (20% to 100%), and all were classified as high virulence. All but 1 Eurasian virus was in the high-virulence group. Among the North American isolates, only 3 were high virulence, and most (7/15) were low virulence. Surviving animals seroconverted to homologous virus (Table 3). These data show that the majority of the avian H2N2s are pathogenic in mice and can cause various levels of virulence despite not being mouse adapted.
FIG 1.
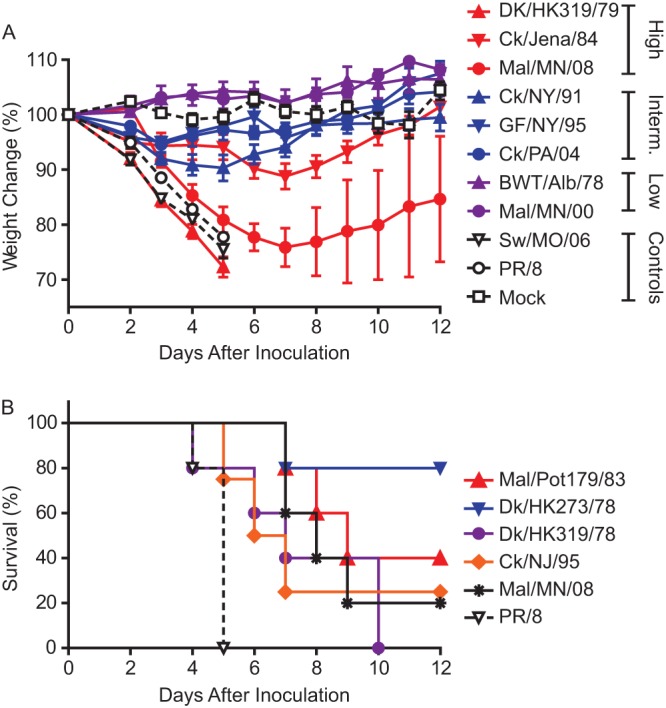
Replication of representative avian H2N2 viruses in DBA/2J mice. (A) Virus induced morbidity and virulence as classified by weight loss: high, >10% loss of starting weight; intermediate, 5 to 10% loss; low, <5% loss. (B) Viruses that induced mortality. Data in morbidity curves are presented as mean values ± standard deviations. Control groups are denoted as dashed lines.
TABLE 3.
Pathogenicity of avian H2N2 influenza viruses in DBA/2J mice
| Categorya | Animal origin | Virus | Maximum wt lossb | % mortality | Lung titerc | Serologyd | Virulencee |
|---|---|---|---|---|---|---|---|
| Eurasian | Wild | Mal/MT/61 | 11.5 ± 3.7 | 0 | 6.5 ± 0.3 | (3/3) | High |
| Wild | Mal/Pot177/83f | 16.0 ± 4.6 | 0 | 5.6 ± 1.0 | (3/3) | High | |
| Wild | Mal/Pot179/83 | 25.0 ± 4.1 | 60 | 5.8 ± 0.4 | (2/2) | High | |
| Domestic | Dk/HK273/78 | 14.0 ± 3.5 | 20 | 5.4 ± 1.3 | (3/3) | High | |
| Domestic | Dk/HK319/79 | 12.0 ± 7.9 | 100 | 6.9 ± 0.9 | < | High | |
| Domestic | Ck/Jena/83 | 3.0 ± 2.4 | 0 | 5.3 ± 1.4 | (3/3) | Low | |
| Domestic | Ck/Jena/84 | 11.0 ± 5.2 | 0 | 5.3 ± 0.7 | (3/3) | High | |
| North American | Wild | Bwt/Alb/78 | < | 0 | 3.8 ± 0.4 | (3/3) | Low |
| Wild | Mal/NY/78 | 4.0 ± 5.4 | 0 | 5.3 ± 1.1 | (3/3) | Low | |
| Wild | Mal/MN/98 | 4.0 ± 2.3 | 0 | 6.0 ± 0.5 | (3/3) | Low | |
| Wild | Mal/MN/00 | < | 0 | 4.3 ± 0.4 | (3/3) | Low | |
| Wild | Mal/MN/08 | 28.0 ± 4.2 | 80 | 5.3 ± 0.4 | (3/3) | High | |
| Domestic | Ck/CT/90 | 5.0 ± 1.5 | 0 | 1.5 ± 2.6 | (3/3) | Intermediate | |
| Domestic | Ck/PA/91 | < | 0 | 5.0 ± 0.5 | (3/3) | Low | |
| Domestic | Ck/NY/91 | 10.0 ± 5.3 | 0 | 0.3 ± 0.6 | ND | Intermediate | |
| Domestic | GF/NY/94 | 4.0 ± 4.3 | 0 | 3.2 ± 2.7 | ND | Low | |
| Domestic | Dk/NJ/95 | 5.0 ± 1.9 | 0 | 2.8 ± 0.5 | (3/3) | Intermediate | |
| Domestic | GF/NY/95 | 5.0 ± 1.7 | 0 | 6.0 ± 0.7 | (3/3) | Intermediate | |
| Domestic | Ck/NY/95 | 14.0 ± 5.5 | 0 | 0.3 ± 0.6 | (3/3) | High | |
| Domestic | Ck/NJ/95 | 24.0 ± 5.4 | 60 | (2/2) | High | ||
| Domestic | Ck/NY/04 | < | 0 | 3.0 ± 3.3 | (3/3) | Low | |
| Domestic | Ck/PA/04 | 5.0 ± 3.1 | 0 | 6.0 ± 0.7 | (3/3) | Intermediate | |
| Nonavian | Swine | Sw/MO/06 | 25.0 ± 2.4 | 100 | 6.4 ± 0.3 | < | High |
| Mouse adapted | PR/8 | 26.0 ± 0.9 | 100 | 7.5 ± 0.0 | < | High | |
| Mock (PBS) | < | 0 | < | (0/3) | N/A |
“Category” indicates geographic region or a nonavian isolate.
Corresponds to the point during infection at which the group displayed the maximum decrease from starting weight (% starting weight ± SD); <, no statistical loss of weight at any time point.
Mean lung titer (Log10 EID50/ml ± SD) at 5 days postinfection.
Assessed by hemagglutination inhibition assay of horse red blood cells. Parentheses represent the number of animals that seroconverted to titers of ≥1:20 out of total surviving animals sampled. “<” represents a titer below the cutoff of 1:20 serum dilution or no surviving animals. ND, not determined.
High, >10% loss of starting weight; intermediate, 5% to 10% loss; low, <5% loss.
Isolate Mal/Pot177/83 is subtype H2N1.
Replication in primary differentiated NHBE cells.
To determine the replication capacity of avian H2N2 viruses in human cells, we used an ex vivo model of differentiated NHBEs, which retain morphological and physiologic characteristics of the human respiratory tract (21). Because nearly all the viruses were pathogenic in mice, we retained the entire panel for NHBE cell infections. Differentiated cells were infected with a low multiplicity of infection (MOI) (0.001) to more closely model physiological inocula. Similar to results seen in the mouse model, 91% of the avian H2N2 isolates replicated in NHBEs; only Ck/NJ/95 and Mal/MN/00 failed to do so (Table 4). Viruses were classified into 3 groups on the basis of replication kinetics at 24 h postinfection (hpi): rapid/high (≥4 Log10 TCID50/ml), delayed/intermediate (<4 Log10, but surpassed this level at subsequent time points), and low (<4 Log10 throughout the study) (Fig. 2 and Table 4). Nearly half of the viruses had delayed/intermediate replication. High and low replication phenotypes were 36% and 9%, respectively. The mammalian-adapted control, SW/MO/06, replicated to high titers (Table 4). Thus, avian H2N2 viruses, including contemporary isolates from the past decade, are able to infect and cause productive replication in a human ex vivo NHBE model system.
TABLE 4.
Replication of avian H2N2 influenza viruses in NHBE cellsf
| Categorya | Animal origin | Virus | Replicationb | Titer, 24 hpic | Peak titerc | hpi of peak titer | Replication patternd |
|---|---|---|---|---|---|---|---|
| Eurasian | Wild | Mal/MT/61 | Yes | 6.6 ± 0.7 (6/6) | 7.3 ± 0.3 (6/6) | 72 | Rapid/high |
| Wild | Mal/Pot177/83e | Yes | 4.1 ± 1.2 (5/6) | 7.2 ± 0.6 (6/6) | 48 | Rapid/high | |
| Wild | Mal/Pot179/83 | Yes | 4.0 ± 1.6 (6/6) | 7.2 ± 0.7 (6/6) | 48 | Rapid/high | |
| Domestic | Dk/HK273/78 | Yes | < | 2.9 ± 1.9 (2/6) | 96 | Low | |
| Domestic | Dk/HK319/79 | Yes | 4.0 ± 0.7 (3/6) | 5.8 ± 2.9 (5/6) | 72 | Rapid/high | |
| Domestic | Ck/Jena/83 | Yes | 6.0 ± 0.7 (5/6) | 7.5 ± 0.9 (6/6) | 48 | Rapid/high | |
| Domestic | Ck/Jena/84 | Yes | 6.2 ± 0.7 (6/6) | 8.0 ± 0.4 (6/6) | 48 | Rapid/high | |
| North American | Wild | Bwt/Alb/78 | Yes | 3.3 ± 0.0 (1/6) | 6.3 ± 0.0 (1/6) | 72 | Low |
| Wild | Mal/NY/78 | Yes | 3.2 ± 0.6 (3/6) | 6.4 ± 0.9 (6/6) | 72 | Intermediate/delayed | |
| Wild | Mal/MN/98 | Yes | < | 5.2 ± 0.6 (3/6) | 96 | Intermediate/delayed | |
| Wild | Mal/MN/00 | No | < | < | < | None | |
| Wild | Mal/MN/08 | Yes | 3.6 ± 0.7 (5/6) | 7.0 ± 0.4 (6/6) | 72 | Intermediate/delayed | |
| Domestic | Ck/CT/90 | Yes | 3.0 ± 1.6 (4/6) | 6.3 ± 0.4 (5/6) | 72 | Intermediate/delayed | |
| Domestic | Ck/PA/91 | Yes | 4.0 ± 0.4 (2/6) | 6.4 ± 0.3 (4/6) | 72 | Rapid/high | |
| Domestic | Ck/NY/91 | Yes | 3.3 ± 0.0 (1/6) | 5.3 ± 0.4 (6/6) | 96 | Intermediate/delayed | |
| Domestic | GF/NY/94 | Yes | 3.5 ± 0.0 (1/6) | 5.2 ± 1.7 (5/6) | 48 | Intermediate/delayed | |
| Domestic | Dk/NJ/95 | Yes | < | 4.3 ± 0.8 (6/6) | 96 | Intermediate/delayed | |
| Domestic | GF/NY/95 | Yes | 3.0 ± 0.5 (5/6) | 5.5 ± 1.3 (6/6) | 48 | Intermediate/delayed | |
| Domestic | Ck/NY/95 | Yes | < | 4.0 ± 0.7 (6/6) | 96 | Intermediate/delayed | |
| Domestic | Ck/NJ/95 | No | < | < | < | None | |
| Domestic | Ck/NY/04 | Yes | 4.3 ± 0.0 (1/6) | 5.2 ± 0.4 (3/6) | 96 | Intermediate/delayed | |
| Domestic | Ck/PA/04 | Yes | 4.8 ± 0.0 (2/6) | 6.6 ± 0.1 (4/6) | 72 | Rapid/high | |
| Control | Swine | SW/MO/06 | Yes | 7.9 ± 0.6 (3/3) | 8.6 ± 0.9 (3/3) | 48 | Rapid/high |
| Mock (PBS) | No | < | < | < | None |
“Category” indicates geographic region or a nonavian isolate.
Productive replication was defined as >1 Log10 TCID50/ml in at least 1 of 6 inserts.
Mean titer (Log10 TCID50/ml ± SD) of 6 inserts (or 3 for controls). Negative inserts were excluded from analysis. Numbers in parentheses are the number of positive inserts out of the total.
Replication patterns were scored based upon titers 24 h postinfection as follows: rapid/high, ≥4 Log10 TCID50/ml; intermediate/delayed, ≤4 Log10; low, ≤4 Log10 throughout the time course; none, no replication throughout the time course.
Isolate Mal/Pot177/83 is subtype H2N1.
“<” represents a titer below the cutoff of <1 Log10 EID50/ml or no surviving animals. ND, not determined.
FIG 2.
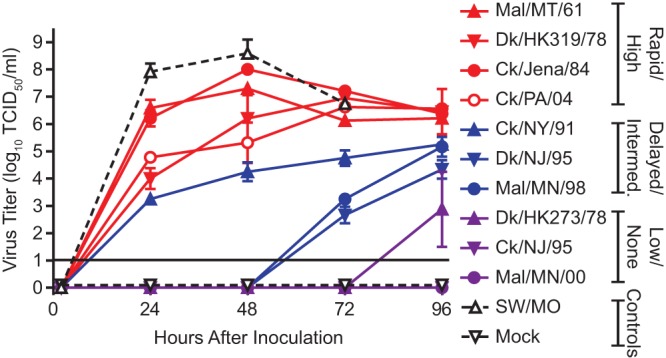
Replication kinetics of representative avian H2N2 viruses in normal human bronchial epithelial (NHBE) cells. The replication patterns indicated were scored based upon 24-h-time-point titers as follows: rapid/high, ≥4 log10 TCID50/ml; intermediate/delayed, ≤4 log10; low, ≤4 log10 throughout the time course; none, 0 log10 throughout the time course. Control groups are represented by open shapes and dashed lines. Data are presented as mean values from 6 inserts per virus group from two independent experiments, excluding negative inserts. The limit of detection is indicated by a solid horizontal line.
Replication in swine tracheal explants.
To assess the ability of avian H2N2 viruses to infect pigs, we used an ex vivo model of tissue explants prepared from pig tracheas, a system used previously to model the potential of influenza viruses to replicate in swine (31–33). We screened the replication ability of a small panel representing viruses of North American, Eurasian, wild animal, and domestic animal origin (Fig. 3). The positive control, Sw/MO/06, replicated to expected high titers (5.8 to 7.1 Log10 TCID50/ml). Only two avian viruses, Ck/Jena/84 and GF/NY/95, had significant replication over the 1-hpi carryover titers. In both cases, replication was not sustained past 48 hpi (Fig. 3). While the explants maintain structure and receptor specificity mimicking infection patterns observed in live animals, a lower expression of α2,3-linked receptors may limit upper respiratory replication of these viruses (31, 32). Overall, the avian H2N2 viruses in this study had an impaired ability to infect or maintain stable replication in swine tracheal tissues.
FIG 3.
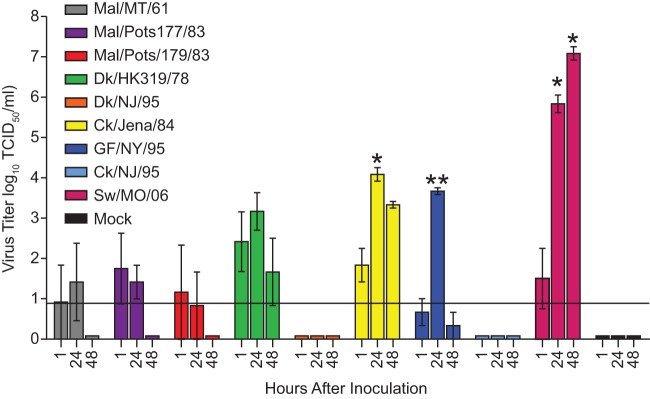
Replication kinetics of representative avian H2N2 viruses in ex vivo swine tracheal explants. Data are presented as the mean values of 3 explants per virus group ± standard deviation. The limit of detection is indicated by a solid horizontal line, and bars below without standard deviations are indicative of 0 values. Statistical significance of replication (as determined by comparison to the amount of virus 1 h after inoculation) was determined by performing t tests. *, P < 0.05; **, P < 0.005. Isolate Mal/Pot177/83 is subtype H2N1.
Pathogenicity and transmission in ferrets.
Ferrets are the gold standard for modeling pathogenesis and transmissibility of influenza. We tested the ability of the avian H2N2 viruses to infect donor ferrets and be transmitted by either direct contact (i.e., to a cage mate) or aerosol (i.e., to animals in adjacent cages). A positive control for infection and transmission, Sw/MO/06, was also used (18). Five of nine avian viruses replicated in donor ferrets, as assessed by the isolation of virus from nasal discharge (Fig. 4A and B and Table 5). Clinical symptoms, including weight loss, fever, sneezing, nasal discharge, and lethargy, were absent from all ferrets infected with avian viruses, with the exception of one infected with Mal/MT/61 (Table 5). Three avian viruses, Mal/MT/61, Dk/HK319/79, and Mal/Pot179/83, were transmitted to cage mates that were in direct contact with donor ferrets, and none displayed clinical signs of disease (Fig. 4A and Table 5). No aerosol transmission was observed with any virus tested (data not shown). Sw/MO/06 replicated in both donors, induced clinical disease, and spread to direct-contact animals as has been previously described (18). Our experiment indicated no aerosol transmission of this isolate (data not shown), which was not examined in a previous study (18).
FIG 4.

Replication and transmission of avian H2N2 viruses in ferrets. Each virus group contained 6 ferrets: 2 each of donors, direct contacts, and aerosol contacts. (A) Viruses exhibiting droplet/contact transmission; (B) viruses exhibiting replication in donors only; (C) viruses exhibiting no replication in ferrets. Data are presented as TCID50 values for each individual animal at a given time point. The limit of detection is indicated by a solid horizontal line, and bars below are indicative of 0 values. Isolate Mal/Pot177/83 is subtype H2N1.
TABLE 5.
Pathogenicity and transmission of avian H2N2 influenza viruses in ferrets
| Virus | Donor ferrets |
Direct-contact ferrets |
||||
|---|---|---|---|---|---|---|
| No. of ferrets shedding (n = 2)a | Clinical signs (no. of ferrets/total)b | No. of ferrets with seroconversion, (assay range)c | No. of ferrets shedding (n = 2)a | Clinical signs (no. of ferrets/total)b | No. of ferrets with seroconversion, (assay range)c | |
| Avian | ||||||
| Mal/MT/61 | 2 | Sneezing (1/2) | 2 (320) | 2 | None | 2 (320) |
| Dk/HK273/78 | 0 | None | 2 (20–40) | 0 | None | < |
| Dk/HK319/79 | 2 | None | 2 (80–160) | 2 | None | 1 (320) |
| Mal/Pot177/83e | 1 | None | 2 (160) | 0 | None | 2 (20) |
| Mal/Pot179/83 | 2 | None | 2 (160) | 1 | None | 2 (20–160) |
| Ck/Jena/84 | 2 | None | 2 (160) | 0 | None | < |
| Dk/NJ/95 | 0 | None | 2 (40–80) | 0 | None | <d |
| GF/NY/95 | 0 | None | 1d (80) | 0 | None | < |
| Ck/NJ/95 | 0 | None | 2 (20–40) | 0 | None | < |
| Nonavian and control | ||||||
| Sw/MO/06 | 2 | Weight loss (2/2), sneezing (2/2) | 2 | 2 | Sneezing (2/2) | 2 |
Number of animals with >1 Log10 TCID50/ml nasal titer out of total animals.
Numbers in parentheses are numbers of animals displaying signs out of the total.
Number of animals (n = 2) that seroconverted to homologous virus. Assessed by HI assay; titers are representative of the reciprocal of the highest doubling dilution that inhibited 4 hemagglutinating units of homologous virus with horse red blood cells. <, titers below assay cutoff of <1:20.
One animal in this group died due to adverse reaction to ketamine injection at 4 dpi.
Isolate Mal/Pot177/83 is subtype H2N1.
Seroconversion was observed in all donor ferrets even when the virus was not shed by the animals. In the latter cases, HI titers were often one or two doubling dilutions lower than in animals that were actively shedding virus (Table 5). Seroconversion was also observed in direct-contact animals that shed virus with the exception of one animal infected with Dk/HK/319/79. One contact ferret infected with Mal/Pot179/83 did not shed virus and was seropositive. All remaining contact ferrets that did not shed virus remained seronegative (Table 5). Overall, these data demonstrate that several avian H2N2 viruses are pathogenic in ferrets and some are capable of transmission between animals in direct contact. However, none of the viruses were able to spread by aerosol.
Molecular characteristics and receptor specificity.
To examine molecular determinants that may confer replication in mammals, we analyzed full-length HA gene sequences, focusing on important residues in the receptor binding domain (Q226L and G228S by H3 numbering) which influence the adaptation of avian influenza viruses to mammalian hosts (14, 34). Sw/MO/06 has 226L and 228G residues (Table 6) (18), indicative of mammalian adaptation. In contrast, all avian H2N2 viruses in our panel for which sequences were available had the avian consensus residues 226Q and 228G (Table 6).
TABLE 6.
Sequence analysis of pertinent HA, M2, and PB2 amino acid residues
| Category | Amino acid(s)a |
|||||||||||
|---|---|---|---|---|---|---|---|---|---|---|---|---|
| HA receptor bindingc |
M2 adamantane antiviral resistanced |
PB2 mammal adaptatione |
||||||||||
| 190 | 222 | 226 | 228 | 26 | 27 | 30 | 31 | 34 | 271 | 627 | 701 | |
| Avian or α2,3 binding consensusb | E | – | Q | G | – | – | – | – | – | – | – | – |
| Human or α2,6 binding consensusb | D | – | L/Q | S/G | – | – | – | – | – | – | – | – |
| Adamantane-susceptible consensus | – | – | – | – | L | V | A | S | G | – | – | – |
| PB2 mammalian adaptation consensus | – | – | – | – | – | – | – | – | – | A | K | N |
| All avian viruses in this studyd | E | K/E | Q | G | L | V | A | S | G | T | E | D |
| Swine/MO/06b | E | K | L | G | L | I | A | S | G | A | E | D |
Sequences were obtained from in-house Sanger sequencing or GenBank. “–” indicates the residue does not pertain to the designated category.
HA analysis excludes Bwt/Alb/78, Mal/MN/00, Mal/MN/98.
M2 analysis excludes Bwt/Alb/78, Mal/MN/00, Dk/NJ/95.
PB2 analysis excludes Bwt/Alb/78, Mal/MN/00, Mal/MN/98, Mal/MN/08, Dk/NJ/95.
HA mutations E190D and D222G have been implicated in the change from α2,3-linked (i.e., avian-like) to α2,6-linked (i.e., human-like) sialic acid receptor binding in the 1918 and 2009 H1N1 pandemic viruses, respectively (35). The 222G residue also significantly increases viruses' ability to infect ciliated epithelia (36). All avian H2N2 viruses in this study for which sequences were available and the control swine viruses retained the 190E residue and lacked the 222G change.
The presence of residues at positions 271A and 627K in the PB2 protein have been implicated in increased pathogenesis and replication in mammalian species (37). All avian H2N2 viruses in this study had the avian-like residues 271T and 627E. In contrast, SW/MO/06 had the 271A mutation, indicative of mammalian adaptation, but retained 627E. The PB2 mutation D701N can compensate for the absence of the 627K mutation in the process of adaptation, but all avian H2N2s tested retained aspartic acid at this position (Table 6) (38).
To explore the functional effect of receptor site residues, we analyzed the ability of immobilized avian H2N2 viruses to bind biotinylated sialylglycopolymers of α2,3- or α2,6-sialic acid linkages, representing avian- or human-like receptors, respectively. The avian H2N2 viruses preferentially bound the α2,3 polymer, with Kass (μM-1) values of 0.2 to 1.8 (Fig. 5A). All avian H2N2 viruses tested had a 17-fold- to 224-fold-higher affinity for the α2,3 polymer than for the α2,6 polymer (Fig. 5B). The control virus, Sw/MO/06, previously shown to preferentially bind α2,6 linkages (13), bound the α2,6 polymer with higher affinity than the α2,3 polymer (Fig. 5). Thus, the molecular characteristics of the receptor binding site and the preference for α2,3-linked carbohydrate receptors confirm the avian nature of these H2N2 viruses.
FIG 5.
Receptor specificity of avian H2N2 viruses. (A) Apparent association (Kass) of viruses to α2,3 (3′SL)- or α2,6 (6′SLN)-linked biotinylated sialylglycopolymers. (B) Relative affinity to the α2,3-sialylglycopolymer. Data are presented as the mean values of repeat measures ± standard deviations. Isolate Mal/Pot177/83 is subtype H2N1.
Antiviral susceptibility.
Antivirals are an important option in the control of influenza virus outbreaks. Therefore, we determined the susceptibility of avian H2N2 viruses to two FDA-approved classes of influenza antivirals: the adamantanes and neuraminidase inhibitors (NAIs). Genetic resistance to adamantanes is conferred by combinations of M2 protein mutations at positions 26, 27, 30, 31, or 34 (39). All viruses tested in this study possess consensus M2 gene sequences that suggest genetic susceptibility to the adamantanes (Table 6). We next assessed the phenotypic susceptibility to NAIs in the fluorescence-based NA enzyme inhibition assays. The mean IC50s obtained with oseltamivir (0.34 nM) were similar to those obtained with the investigational NAI peramivir (0.28 nM). However, the mean IC50s obtained with zanamivir (0.88 nM) were approximately 2.5-fold higher than those obtained with oseltamivir and 3-fold higher than those obtained with peramivir (Table 7). The range of IC50s was 0.12 to 1.35 nM for most viruses, demonstrating high susceptibility of H2N2 influenza viruses to all three NAIs. The single exception to this finding was isolate Mal/Pot177/83, which had a mean IC50 of 3.11 nM, 9-fold greater than that of the other avian isolates tested (Fig. 6 and Table 7). This isolate was identified as a mild outlier in the box plot analysis. Mal/Pot177/83 had been previously identified as N2 in our database. It was subsequently verified as the N1 subtype after commencement of the study, and this may explain the slight elevation in IC50s over the N2 viruses. However, this virus retained high susceptibility to zanamivir (0.33 nM) and peramivir (0.14 nM). Overall, our data suggest that the avian H2N2 isolates are susceptible to both classes of influenza antivirals (Fig. 6 and Tables 6 and 7).
TABLE 7.
Susceptibility of avian H2N2 influenza viruses to neuraminidase inhibitors
| Categorya | Animal origin | Virus | Inhibitory activity (IC50 ±SD, nM)b |
||
|---|---|---|---|---|---|
| Oseltamivir | Zanamivir | Peramivir | |||
| Eurasian | Wild | Mal/MT/61 | 0.14 ± 0.02 | 0.76 ± 0.07 | 0.25 ± 0.02 |
| Wild | Mal/Pot177/83c | 3.11 ± 1.01 | 0.33 ± 0.19 | 0.14 ± 0.04 | |
| Wild | Mal/Pot179/83 | 0.21 ± 0.02 | 0.82 ± 0.07 | 0.25 ± 0.02 | |
| Domestic | Dk/HK273/78 | 0.17 ± 0.04 | 0.81 ± 0.20 | 0.27 ± 0.06 | |
| Domestic | Dk/HK319/79 | 0.16 ± 0.05 | 0.84 ± 0.28 | 0.27 ± 0.09 | |
| Domestic | Ck/Jena/83 | 0.19 ± 0.02 | 0.88 ± 0.08 | 0.32 ± 0.05 | |
| Domestic | Ck/Jena/84 | 0.17 ± 0.03 | 0.71 ± 0.08 | 0.23 ± 0.03 | |
| North American | Wild | Bwt/Alb/78 | 0.3 ± 0.04 | 0.64 ± 0.07 | 0.26 ± 0.06 |
| Wild | Mal/NY/78 | 0.15 ± 0.03 | 0.71 ± 0.11 | 0.26 ± 0.03 | |
| Wild | Mal/MN/98 | 0.59 ± 0.02 | 1.35 ± 0.46 | 0.27 ± 0.03 | |
| Wild | Mal/MN/00 | 0.19 ± 0.04 | 1.24 ± 0.43 | 0.28 ± 0.06 | |
| Wild | Mal/MN/08 | 0.41 ± 0.01 | 0.90 ± 0.11 | 0.46 ± 0.08 | |
| Domestic | Ck/CT/90 | 0.14 ± 0.02 | 0.76 ± 0.12 | 0.27 ± 0.08 | |
| Domestic | Ck/PA/91 | 0.15 ± 0.02 | 0.90 ± 0.17 | 0.32 ± 0.08 | |
| Domestic | Ck/NY/91 | 0.18 ± 0.03 | 0.94 ± 0.22 | 0.34 ± 0.12 | |
| Domestic | GF/NY/94 | 0.15 ± 0.01 | 0.79 ± 0.07 | 0.29 ± 0.08 | |
| Domestic | Dk/NJ/95 | 0.15 ± 0.01 | 1.08 ± 0.22 | 0.24 ± 0.03 | |
| Domestic | GF/NY/95 | 0.17 ± 0.01 | 0.86 ± 0.09 | 0.30 ± 0.05 | |
| Domestic | Ck/NY/95 | 0.22 ± 0.08 | 1.12 ± 0.37 | 0.31 ± 0.04 | |
| Domestic | Ck/NJ/95 | 0.29 ± 0.08 | 1.35 ± 0.23 | 0.35 ± 0.05 | |
| Domestic | Ck/NY/04 | 0.13 ± 0.04 | 0.87 ± 0.09 | 0.20 ± 0.02 | |
| Domestic | Ck/PA/04 | 0.12 ± 0.03 | 0.77 ± 0.07 | 0.22 ± 0.06 | |
| Mean IC50 for all viruses | 0.34 ± 0.63 | 0.88 ± 0.23 | 0.28 ± 0.06 | ||
“Category” indicates geographic region or a nonavian isolate.
Mean inhibition of NA enzymatic activity with MUNANA substrate (100 μM final concentration).
Isolate Mal/Pot177/83 is subtype H2N1.
FIG 6.
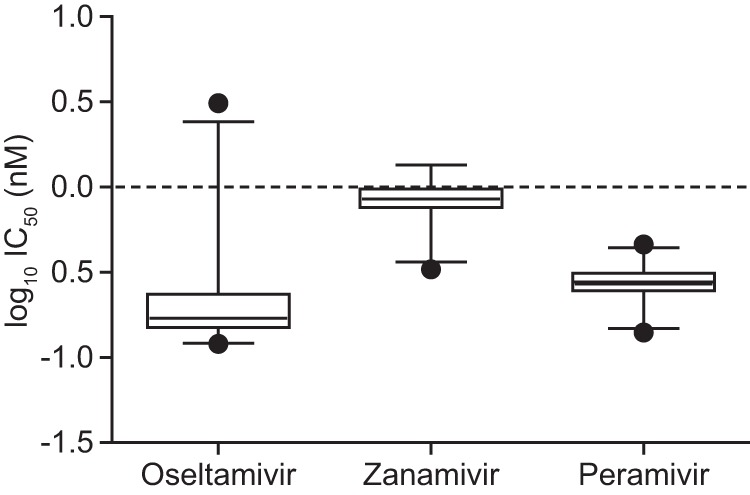
Box plots of the mean IC50s (nM) for oseltamivir carboxylate, zanamivir, and peramivir for avian H2N2 influenza viruses by the fluorometric assay. Boxes represent the 25th to 75th percentiles, and the horizontal lines within the boxes represent the median values. The length of the box represents the interquartile range (IQR). The end of the solid lines (whiskers) extending on either side of the box represent the 95% confidence limits. The isolates with IC50s between 1.5 and 3.0 IQR from the 25th and 75th percentiles were defined as mild outliers. The detected mild outlier for oseltamivir carboxylate A/Mal/Pot177/83 is shown as a closed circle.
Risk assessment and scoring.
A total of 10 H2 viruses were evaluated in all experimental models and assays. We employed a ranked scale with values of 0 to 4 to evaluate the performance of these viruses according to the test criteria, with lower values representing lower risk. The sum of the values for each criterion were determined and assigned to three risk categories: low (sum of <5), intermediate (sum of 5 to 9), or high (sum of 10 or higher). The mammalian-adapted Sw/MO/06 virus ranked as high risk on our scale along with one other avian virus, Dk/HK319/79, and both consistently showed high fitness in most ex vivo and in vivo assays. The remaining viruses were equally divided into the intermediate- and low-risk categories, with the low-risk viruses often performing less efficiently than the high- or intermediate-risk groups in these same assays (Table 8).
TABLE 8.
Risk scoring of H2N2 viruses
| Virus | Score |
Risk classificationk | ||||||||||
|---|---|---|---|---|---|---|---|---|---|---|---|---|
| Receptor specificitya | NHBE cellsb | Swine explantsc | Miced | Ferretse | HA 226f | PB2 627g | M2 inhibitorsh | NAIsi | Similarity to pandemic vaccinej | Risk | ||
| Mal/MT/61 | 0 | 3 | 0 | 2 | 3 | 0 | 0 | 0 | 0 | 0 | 8 | Intermediate |
| Dk/HK273/78 | 0 | 1 | 0 | 3 | 0 | 0 | 0 | 0 | 0 | 0 | 4 | Low |
| Dk/HK319/79 | 0 | 3 | 1 | 3 | 3 | 0 | 0 | 0 | 0 | 0 | 10 | High |
| Mal/Pot177/83 | 0 | 3 | 0 | 2 | 1 | 0 | 0 | 0 | 0 | 0 | 6 | Intermediate |
| Mal/Pot179/83 | 0 | 3 | 0 | 3 | 2 | 0 | 0 | 0 | 0 | 0 | 8 | Intermediate |
| Ck/Jena/84 | 0 | 3 | 1 | 2 | 1 | 0 | 0 | 0 | 0 | 1 | 8 | Intermediate |
| Dk/NJ/95 | 0 | 2 | 0 | 1 | 0 | 0 | 0 | 0 | 0 | 1 | 4 | Low |
| GF/NY/95 | 0 | 2 | 1 | 1 | 0 | 0 | 0 | 0 | 0 | 0 | 4 | Low |
| Ck/NJ/95 | 0 | 0 | 0 | 3 | 0 | 0 | 0 | 0 | 0 | 0 | 3 | Low |
| Sw/MO/06 (H2N3) | 1 | 3 | 1 | 3 | 3 | 1 | 1 | 0 | 0 | 0 | 13 | High |
| VN/1203 (H5N1) | 0 | 3 | 1 | 3 | 1 | 0 | 1 | 1 | 0 | N/A | 10 | High |
Polymer binding: 0, >2-fold preference for α2,3; 1, >2-fold preference for α2,6.
Replication kinetics: 0, none; 1, low; 2, intermediate/delayed; 3, high/rapid.
0, no replication; 1, productive replication. In vivo data was used to score VN/1203.
Morbidity: 0, low/none; 1, intermediate; 2, high; 3, high with mortality.
0, no replication in donors; 1, replication in donors, no transmission; 2, replication in 1 contact; 3, replication in both contacts; 4, aerosol transmission.
Consensus as HA residue 226: 0, avian consensus (Q); 1, mammalian consensus (L).
Consensus as PB2 residue 627: 0, avian consensus (E); 1, mammalian consensus (K).
0, adamantane sensitive residues in M2; 1, 1 or more resistant residues in M2.
Inhibition by NAI: 0, <1 μM; 1, >1 μM. VN/1203 score meets criteria for susceptibility to oseltamivir but not zanamivir.
Antigenically similar by HI assay: 0, virus inhibited by A/Singapore/1/57 sera ≥1:40; 1, not inhibited.
Risk classification: low risk, <5; intermediate risk, 5 to 9; high risk, >10.
DISCUSSION
The risks of antigenic recycling and reintroduction of H2N2 viruses into humans or other mammals remain a distinct possibility. The 1957 pandemic virus contained multiple genes donated from birds, and H2 viruses continue to circulate in avian species. Therefore, the avian reservoir is a potential source for reintroduction of the subtype. Despite this, analysis of avian H2N2 viruses and the ability to infect mammals is lacking. We have addressed this deficiency by assessing the risk of several avian H2N2 isolates to humans and other mammals by using a wide variety of criteria and model systems.
We found most viruses in our panel could replicate in both DBA2/J mice and NHBE cells. In DBA2/J mice, virulence of the viruses was variable, with roughly half causing very little weight loss and the rest causing the mice to lose weight and display clinical signs of disease. We scored virulence and morbidity based on the amount of weight the animals lost. No direct correlation exists between this criteria and the outcome of human infections, but the reduction of influenza-induced morbidity and mortality is one of several criteria that is used to evaluate the efficacy of vaccines and antivirals (40–42). Also, experimental studies by Kocer et al. suggest a relation between high virus-induced morbidity and the ability of that virus to infect ferrets (30), a standard animal model of influenza infection in humans. In our studies, viruses inducing a high morbidity score also replicated in one or more donor and direct contact animals, further suggesting an increased risk for mammalian infections (Tables 2 and 5). Perhaps more applicable to model risk to humans are primary human NHBEs. It has been demonstrated by Ilyushina et al. that replication of influenza viruses from various species between 8 and 24 hpi correlates with infection in humans (43). Thus, we chose an early time point (24 h) to assess how quickly an H2N2 virus of purely avian origin could replicate in these human cells. We observed that most avian viruses replicated to a high or intermediate score despite their preference for α2,3-sialic acid linkages, which are less abundant on NHBEs than α2,6-sialic acids. A similar phenomenon has been observed with avian H5 viruses, which have for more than a decade breached the avian-human species barrier and caused significant disease (21, 44–47). The degree to which receptor specificity plays in replication in NHBEs or other models used here should be defined by further experimentation. As these viruses were passaged multiple times in eggs, it is possible, particularly with older avian viruses circulating near the pandemic period, that any quasispecies that bind α2,6-sialic acid linkages would be replaced by viruses binding the more expected α2,3-sialic acid linkages. However, we note that Sw/MO was one of the most egg-passaged viruses (4 passages) used in this study, and it retains its strong preference for binding to α2,6-linked glycopolymers. Nevertheless, it will be important to use additional polymer linkages (both α2,3 and α2,6) and various carbohydrate lengths within a comprehensive glycan array format to better understand the binding profiles of these viruses to the lesser preferred receptor type. These studies are under way.
In contrast to mice and NHBEs, few avian H2 viruses replicated in swine tracheal explants, consistent with previous observations using avian viruses of several subtypes (32). Unlike the H1N1 and H3N2 pandemic viruses of the 20th century, H2N2 viruses did not establish a stable lineage in pigs, and there is also no conclusive evidence that the 1957 H2N2 pandemic virus involved reassortment in a pig. However, H2N3 viruses containing avian surface proteins along with markers of mammalian adaptation were isolated from pigs in 2006, demonstrating the potential of this host species to harbor avian-origin H2 viruses (18). Given the role swine play in the evolution and transmission of pandemic and epidemic influenza viruses, the ability of an H2 virus to display even limited replication in a pig may be an initial step toward acquisition of mutations necessary for infection of humans. Though our ex vivo studies suggest a low risk of swine infection from avian H2N2s, additional testing ex vivo or in vivo, in conjunction with ongoing swine herd surveillance for this subtype, should remain a priority.
Ferrets infected with influenza display a disease course similar to that of humans, making them a suitable model to determine the susceptibility of humans and other mammals to our avian H2N2 viruses. Over half of the viruses tested in ferrets replicated in donor animals, though little clinical disease was observed outside the Sw/MO/06 virus, and this may indicate that the pathology associated with avian H2 virus infection would be low in humans. Surprisingly, we found that 3 avian viruses were able to transmit to direct-contact cage mates, though it is unknown at this time if fomites are the source of virus spread. One donor-contact ferret pair infected with Dk/HK319/79 virus displayed a transmission pattern that was delayed by 3 to 4 days, and each animal shed for only a single time point. While this is inconsistent with typical contact transmission shedding in ferrets, the Pappas et al. study demonstrates that an H2N2 virus having acquired HA Q226L elicits a shedding pattern with a lag of 3 to 5 days between the cessation of shedding in the donor and appearance of shedding in the recipient (14). Interestingly, this was in a respiratory droplet transmission pattern. Though unlikely, the transmission of HK/319 by aerosol to the cage mate remains a possibility, and additional sequence analysis of these isolates will shed light on genetic mutations that may have facilitated such an event. Alternatively, Driskell et al. demonstrate a similar pattern with another avian virus (H1N9), in which a contact transmission lag period of 4 days is present in 1 of 3 direct-contact animals (48). Thus, the observed H2N2 delayed shedding with Dk/HK319/79 could simply be a characteristic of a somewhat inefficient transmission of an avian virus in a mammalian host.
Given our current data, the potential for aerosol spread of either the avian or swine H2 viruses in humans appears unlikely. We did not observe transmission to cage-separated aerosol animals in ferret experiments. Further, our avian viruses do not possess the 226L mutation in the HA gene previously shown to be important for efficient airborne spread (14). However, Sw/MO/06 does have this mutation yet was not able to spread to aerosol contacts. Therefore, additional mutations, particularly in the HA gene, may be necessary for an H2 virus to transmit by this route. Finally, all three viruses that replicated in donor ferrets and spread to direct contacts (Mal/MT/61, Dk/HK319/79, and Mal/Pot179/83) were also classified as high virulence in mice and rapid replicators in NHBE cells. The combination of the latter two virus characteristics, (i) the ability to cause high virulence in DBA/2 mice and (ii) rapid, high replicative pattern in NHBE cells (which provide an ex vivo model that recapitulates the receptors in the human respiratory tract), predicted the ability of H2N2 influenza viruses to spread via direct contact between ferrets. Nonetheless, we observed some H2N2 isolates that did not exhibit similar patterns between models examined (i.e., Ck/NJ/95 did not replicate in NHBE cells or swine explants but exhibited high virulence in the mouse model). Multiple variables can impact the replication and transmission pattern of an influenza virus and, for this reason, virus-specific variations between the in vitro and in vivo models highlight the notion that there is no universal model that can precisely predict influenza virus fitness in humans. Therefore, comprehensive risk assessment of a virus should include a variety of available model systems.
To summarize the data generated and further evaluate the risk of these viruses to humans and other mammals, we constructed a risk scoring system by which individual criteria (i.e., replication in NHBE cells, replication in ferrets, etc.) were assigned a value relative to the virus fitness in a particular model. The values were tabulated and assigned to three risk groups: low, intermediate, and high. Such strategies have been used by other groups to evaluate the risk potential of H9N2 viruses (49), and a similar system (influenza risk assessment tool [IRAT]) is under development by the Centers for Disease Control and Prevention to evaluate pandemic potential of influenza viruses from animals (50). We included Sw/MO/06 as a control in many of our assays. This virus shows several criteria suggestive of adaptation to mammals. This virus was “high” according to our risk scoring and validated this approach. Additionally, using previously published data (51–56), we scored the highly virulent A/Vietnam/1203/2004 (H5N1) virus. This subtype has been widely speculated to be of high pandemic potential and scored as high risk by our criteria (Table 8). Only one avian virus, Dk/HK319/79, was “high.” As with Sw/MO/06, this virus was incapable of spread to aerosol contacts, and it possessed no markers of mammalian adaptation in HA or PB2 genes. Nevertheless, further study of this isolate, including serial passaging through the ex vivo or in vivo models used in our study, could shed light on its ability to acquire additional mutations that facilitate pathogenesis in mammals. All remaining viruses were classified as either intermediate or low risk.
Despite an elevated risk of Sw/MO/06 and Dk/HK319/79, these and all other viruses in our panel would be susceptible to both classes of influenza antivirals. Additionally, formulation of an H2N2 vaccine is another potential option to address the lack of widespread immunity to the H2 antigen among individuals younger than 50 years (11). Our serology data suggest the avian viruses have undergone limited divergence from ancestors and many remained antigenically similar to pandemic isolate and vaccine strain A/Singapore/1/57. Nevertheless, we did observe isolates (e.g., Ck/Jena/84) that were not inhibited by A/Singapore/1/57 sera and were also capable of replication in donor ferrets. Thus, the risk of H2N2 viruses circulating in birds that are antigenically distinct from the pandemic vaccine virus of 1957 and capable of replication in mammals exists. However, our data showed that animals (both mice and ferrets) infected with avian H2s readily seroconverted. Additionally, protective studies in animals suggest that H2 viruses of various origins produce broadly cross-reactive protective antibodies (57). This suggests that formulation of a broadly immunogenic H2 vaccine is possible, and inclusion of the H2 antigen in an annual vaccine has been suggested by some experts (11).
The characterization of a panel of avian H2N2 viruses in this study addresses the lack of knowledge we currently have about these viruses, their pathogenicity in various hosts, and molecular characteristics that may elevate their risk for reemergence in humans. At this time, our risk scoring criteria indicate that most of the viruses present a low or intermediate risk to humans with multiple prophylactic and therapeutic options available to control them. However, this should not detract from future study of this subtype and prepandemic planning. Further screening and genetic analysis of banked avian H2 viruses are important in assessing the potential of this subtype to reemerge from the avian reservoir. Additionally, active surveillance and characterization of contemporary avian H2 viruses are critical to evaluate emerging markers of mammalian adaptation, antiviral susceptibility, and candidate vaccine strains, all of which are critical components in the public health response to influenza.
ACKNOWLEDGMENTS
We thank Zeynep Kocer, David Walker, Laura McClenaghan, Karthik Shanmuganatham, Heather Forrest, Jeri-Carol Crumpton, Jasmine Turner, Lisa Kercher, Beth Little, David Carey, James Knowles, Alex Fedinec, Shayamli Basuroy, Adam Ericsen, Rachel Wezeman, and Rose Szabady for experimental assistance and/or helpful discussion. We also thank Cherise Guess, Kimberly Friedman, and Julie Groff for assistance with manuscript review and figure preparation.
This work was supported by federal funds from the National Institute of Allergy and Infectious Diseases, National Institutes of Health, Department of Health and Human Services, under contract numbers N01-AI30071 and/or HHSN272200900007C, and the American Lebanese Syrian Associated Charities.
Footnotes
Published ahead of print 13 November 2013
REFERENCES
- 1.Scholtissek C, Rohde W, Von Hoyningen V, Rott R. 1978. On the origin of the human influenza virus subtypes H2N2 and H3N2. Virology 87:13–20. 10.1016/0042-6822(78)90153-8 [DOI] [PubMed] [Google Scholar]
- 2.Webster RG. 1997. Predictions for future human influenza pandemics. J. Infect. Dis. 176(Suppl 1):S14–S19 [DOI] [PubMed] [Google Scholar]
- 3.Simonsen L, Clarke MJ, Schonberger LB, Arden NH, Cox NJ, Fukuda K. 1998. Pandemic versus epidemic influenza mortality: a pattern of changing age distribution. J. Infect. Dis. 178:53–60. 10.1086/515616 [DOI] [PubMed] [Google Scholar]
- 4.Kawaoka Y, Krauss S, Webster RG. 1989. Avian-to-human transmission of the PB1 gene of influenza A viruses in the 1957 and 1968 pandemics. J. Virol. 63:4603–4608 [DOI] [PMC free article] [PubMed] [Google Scholar]
- 5.Palese P, Wang TT. 2011. Why do influenza virus subtypes die out? A hypothesis. mBio 2(5):e00150–11. 10.1128/mBio.00150-11 [DOI] [PMC free article] [PubMed] [Google Scholar]
- 6.Kilbourne ED. 1997. Perspectives on pandemics: a research agenda. J. Infect. Dis. 176(Suppl 1):S29–S31 [DOI] [PubMed] [Google Scholar]
- 7.Gatherer D. 2009. The 2009 H1N1 influenza outbreak in its historical context. J. Clin. Virol. 45:174–178. 10.1016/j.jcv.2009.06.004 [DOI] [PubMed] [Google Scholar]
- 8.Christman MC, Kedwaii A, Xu J, Donis RO, Lu G. 2011. Pandemic (H1N1) 2009 virus revisited: an evolutionary retrospective. Infect. Genet. Evol. 11:803–811. 10.1016/j.meegid.2011.02.021 [DOI] [PMC free article] [PubMed] [Google Scholar]
- 9.Dowdle WR. 1999. Influenza A virus recycling revisisted. Bull. World Health Organ. 77:820–828 [PMC free article] [PubMed] [Google Scholar]
- 10.Roos R. 2011. Scientists say 1957 pandemic flu virus could return. Center for Infectious Disease Research Policy (CIDRAP), University of Minnesota, Minneapolis, MN [Google Scholar]
- 11.Nabel GJ, Wei CJ, Ledgerwood JE. 2011. Vaccinate for the next H2N2 pandemic now. Nature 471:157–158. 10.1038/471157a [DOI] [PubMed] [Google Scholar]
- 12.Webster RG, Bean WJ, Gorman OT, Chambers TM, Kawaoka Y. 1992. Evolution and ecology of influenza A viruses. Microbiol. Rev. 56:152–179 [DOI] [PMC free article] [PubMed] [Google Scholar]
- 13.Xu R, McBride R, Paulson JC, Basler CF, Wilson IA. 2010. Structure, receptor binding, and antigenicity of influenza virus hemagglutinins from the 1957 H2N2 pandemic. J. Virol. 84:1715–1721. 10.1128/JVI.02162-09 [DOI] [PMC free article] [PubMed] [Google Scholar]
- 14.Pappas C, Viswanathan K, Chandrasekaran A, Raman R, Katz JM, Sasisekharan R, Tumpey TM. 2010. Receptor specificity and transmission of H2N2 subtype viruses isolated from the pandemic of 1957. PLoS One 5:e11158. 10.1371/journal.pone.0011158 [DOI] [PMC free article] [PubMed] [Google Scholar]
- 15.Schafer J, Khristova ML, Busse TL, Sinnecker R, Kharitonenkov IG, Schrader C, Suss J, Bucher D. 1992. Analysis of internal proteins of influenza A (H2N2) viruses isolated from birds in East Germany in 1983. Acta Virol. 36:113–120 [PubMed] [Google Scholar]
- 16.Makarova NV, Kaverin NV, Krauss S, Senne D, Webster RG. 1999. Transmission of Eurasian avian H2 influenza virus to shorebirds in North America. J. Gen. Virol. 80(Part 12):3167–3171 [DOI] [PubMed] [Google Scholar]
- 17.Schafer JR, Kawaoka Y, Bean WJ, Suss J, Senne D, Webster RG. 1993. Origin of the pandemic 1957 H2 influenza A virus and the persistence of its possible progenitors in the avian reservoir. Virology 194:781–788. 10.1006/viro.1993.1319 [DOI] [PubMed] [Google Scholar]
- 18.Ma W, Vincent AL, Gramer MR, Brockwell CB, Lager KM, Janke BH, Gauger PC, Patnayak DP, Webby RJ, Richt JA. 2007. Identification of H2N3 influenza A viruses from swine in the United States. Proc. Natl. Acad. Sci. U. S. A. 104:20949–20954. 10.1073/pnas.0710286104 [DOI] [PMC free article] [PubMed] [Google Scholar]
- 19.World Health Organization 2002. WHO manual on animal diagnosis and surveillance. WHO, Geneva, Switzerland: http://www.who.int/csr/resources/publications/influenza/en/whocdscsrncs20025rev.pdf [Google Scholar]
- 20.Reed L, Muench H. 1938. A simple method for estimating fifty percent endpoints. Am. J. Hygiene 27:493–497 [Google Scholar]
- 21.Oshansky CM, Pickens JA, Bradley KC, Jones LP, Saavedra-Ebner GM, Barber JP, Crabtree JM, Steinhauer DA, Tompkins SM, Tripp RA. 2011. Avian influenza viruses infect primary human bronchial epithelial cells unconstrained by sialic acid alpha2,3 residues. PLoS One 6:e21183. 10.1371/journal.pone.0021183 [DOI] [PMC free article] [PubMed] [Google Scholar]
- 22.Palmer DF. 1975. Advanced laboratory techniques for influenza diagnosis, 6th ed. U.S. Department of Health, Education, and Welfare, Public Health Service, Atlanta, GA [Google Scholar]
- 23.Potier M, Mameli L, Belisle M, Dallaire L, Melancon SB. 1979. Fluorometric assay of neuraminidase with a sodium (4-methylumbelliferyl-alpha-d-N-acetylneuraminate) substrate. Anal. Biochem. 94:287–296. 10.1016/0003-2697(79)90362-2 [DOI] [PubMed] [Google Scholar]
- 24.Monto AS, McKimm-Breschkin JL, Macken C, Hampson AW, Hay A, Klimov A, Tashiro M, Webster RG, Aymard M, Hayden FG, Zambon M. 2006. Detection of influenza viruses resistant to neuraminidase inhibitors in global surveillance during the first 3 years of their use. Antimicrob. Agents Chemother. 50:2395–2402. 10.1128/AAC.01339-05 [DOI] [PMC free article] [PubMed] [Google Scholar]
- 25.Matrosovich MN, Gambaryan AS. 2012. Solid-phase assays of receptor-binding specificity. Methods Mol. Biol. 865:71–94. 10.1007/978-1-61779-621-0_5 [DOI] [PubMed] [Google Scholar]
- 26.Moreland AF, Glaser C. 1985. Evaluation of ketamine, ketamine-xylazine and ketamine-diazepam anesthesia in the ferret. Lab. Anim. Sci. 35:287–290 [PubMed] [Google Scholar]
- 27.Green CJ, Knight J, Precious S, Simpkin S. 1981. Ketamine alone and combined with diazepam or xylazine in laboratory animals: a 10 year experience. Lab. Anim. 15:163–170. 10.1258/002367781780959107 [DOI] [PubMed] [Google Scholar]
- 28.Boon AC, de Beauchamp J, Hollmann A, Luke J, Kotb M, Rowe S, Finkelstein D, Neale G, Lu L, Williams RW, Webby RJ. 2009. Host genetic variation affects resistance to infection with a highly pathogenic H5N1 influenza A virus in mice. J. Virol. 83:10417–10426. 10.1128/JVI.00514-09 [DOI] [PMC free article] [PubMed] [Google Scholar]
- 29.Boon AC, de Beauchamp J, Krauss S, Rubrum A, Webb AD, Webster RG, McElhaney J, Webby RJ. 2010. Cross-reactive neutralizing antibodies directed against pandemic H1N1 2009 virus are protective in a highly sensitive DBA/2 mouse influenza model. J. Virol. 84:7662–7667. 10.1128/JVI.02444-09 [DOI] [PMC free article] [PubMed] [Google Scholar]
- 30.Kocer ZA, Krauss S, Stallknecht DE, Rehg JE, Webster RG. 2012. The potential of avian H1N1 influenza A viruses to replicate and cause disease in mammalian models. PLoS One 7:e41609. 10.1371/journal.pone.0041609 [DOI] [PMC free article] [PubMed] [Google Scholar]
- 31.Nunes SF, Murcia PR, Tiley LS, Brown IH, Tucker AW, Maskell DJ, Wood JL. 2010. An ex vivo swine tracheal organ culture for the study of influenza infection. Influenza Other Respir. Viruses 4:7–15. 10.1111/j.1750-2659.2009.00119.x [DOI] [PMC free article] [PubMed] [Google Scholar]
- 32.Van Poucke SG, Nicholls JM, Nauwynck HJ, Van Reeth K. 2010. Replication of avian, human and swine influenza viruses in porcine respiratory explants and association with sialic acid distribution. Virol. J. 7:38. 10.1186/1743-422X-7-38 [DOI] [PMC free article] [PubMed] [Google Scholar]
- 33.Chan RW, Kang SS, Yen HL, Li AC, Tang LL, Yu WC, Yuen KM, Chan IW, Wong DD, Lai WW, Kwong DL, Sihoe AD, Poon LL, Guan Y, Nicholls JM, Peiris JS, Chan MC. 2011. Tissue tropism of swine influenza viruses and reassortants in ex vivo cultures of the human respiratory tract and conjunctiva. J. Virol. 85:11581–11587. 10.1128/JVI.05662-11 [DOI] [PMC free article] [PubMed] [Google Scholar]
- 34.Vines A, Wells K, Matrosovich M, Castrucci MR, Ito T, Kawaoka Y. 1998. The role of influenza A virus hemagglutinin residues 226 and 228 in receptor specificity and host range restriction. J. Virol. 72:7626–7631 [DOI] [PMC free article] [PubMed] [Google Scholar]
- 35.Tumpey TM, Maines TR, Van Hoeven N, Glaser L, Solorzano A, Pappas C, Cox NJ, Swayne DE, Palese P, Katz JM, Garcia-Sastre A. 2007. A two-amino acid change in the hemagglutinin of the 1918 influenza virus abolishes transmission. Science 315:655–659. 10.1126/science.1136212 [DOI] [PubMed] [Google Scholar]
- 36.Liu Y, Childs RA, Matrosovich T, Wharton S, Palma AS, Chai W, Daniels R, Gregory V, Uhlendorff J, Kiso M, Klenk HD, Hay A, Feizi T, Matrosovich M. 2010. Altered receptor specificity and cell tropism of D222G hemagglutinin mutants isolated from fatal cases of pandemic A(H1N1) 2009 influenza virus. J. Virol. 84:12069–12074. 10.1128/JVI.01639-10 [DOI] [PMC free article] [PubMed] [Google Scholar]
- 37.Foeglein A, Loucaides EM, Mura M, Wise HM, Barclay WS, Digard P. 2011. Influence of PB2 host-range determinants on the intranuclear mobility of the influenza A virus polymerase. J. Gen. Virol. 92:1650–1661. 10.1099/vir.0.031492-0 [DOI] [PMC free article] [PubMed] [Google Scholar]
- 38.Steel J, Lowen AC, Mubareka S, Palese P. 2009. Transmission of influenza virus in a mammalian host is increased by PB2 amino acids 627K or 627E/701N. PLoS Pathog. 5:e1000252. 10.1371/journal.ppat.1000252 [DOI] [PMC free article] [PubMed] [Google Scholar]
- 39.Pielak RM, Chou JJ. 2010. Flu channel drug resistance: a tale of two sites. Protein Cell 1:246–258. 10.1007/s13238-010-0025-y [DOI] [PMC free article] [PubMed] [Google Scholar]
- 40.Bouvier NM, Lowen AC. 2010. Animal models for influenza virus pathogenesis and transmission. Viruses 2:1530–1563. 10.3390/v20801530 [DOI] [PMC free article] [PubMed] [Google Scholar]
- 41.Nguyen JT, Smee DF, Barnard DL, Julander JG, Gross M, de Jong MD, Went GT. 2012. Efficacy of combined therapy with amantadine, oseltamivir, and ribavirin in vivo against susceptible and amantadine-resistant influenza A viruses. PLoS One 7:e31006. 10.1371/journal.pone.0031006 [DOI] [PMC free article] [PubMed] [Google Scholar]
- 42.Ding H, Tsai C, Gutierrez RA, Zhou F, Buchy P, Deubel V, Zhou P. 2011. Superior neutralizing antibody response and protection in mice vaccinated with heterologous DNA prime and virus like particle boost against HPAI H5N1 virus. PLoS One 6:e16563. 10.1371/journal.pone.0016563 [DOI] [PMC free article] [PubMed] [Google Scholar]
- 43.Ilyushina NA, Ikizler MR, Kawaoka Y, Rudenko LG, Treanor JJ, Subbarao K, Wright PF. 2012. Comparative study of influenza virus replication in MDCK cells and in primary cells derived from adenoids and airway epithelium. J. Virol. 86:11725–11734. 10.1128/JVI.01477-12 [DOI] [PMC free article] [PubMed] [Google Scholar]
- 44.de Jong MD, Simmons CP, Thanh TT, Hien VM, Smith GJ, Chau TN, Hoang DM, Chau NV, Khanh TH, Dong VC, Qui PT, Cam BV, Ha do Q, Guan Y, Peiris JS, Chinh NT, Hien TT, Farrar J. 2006. Fatal outcome of human influenza A (H5N1) is associated with high viral load and hypercytokinemia. Nat. Med. 12:1203–1207. 10.1038/nm1477 [DOI] [PMC free article] [PubMed] [Google Scholar]
- 45.Bodewes R, Kreijtz JH, van Amerongen G, Fouchier RA, Osterhaus AD, Rimmelzwaan GF, Kuiken T. 2011. Pathogenesis of influenza A/H5N1 virus infection in ferrets differs between intranasal and intratracheal routes of inoculation. Am. J. Pathol. 179:30–36. 10.1016/j.ajpath.2011.03.026 [DOI] [PMC free article] [PubMed] [Google Scholar]
- 46.Maines TR, Chen LM, Van Hoeven N, Tumpey TM, Blixt O, Belser JA, Gustin KM, Pearce MB, Pappas C, Stevens J, Cox NJ, Paulson JC, Raman R, Sasisekharan R, Katz JM, Donis RO. 2011. Effect of receptor binding domain mutations on receptor binding and transmissibility of avian influenza H5N1 viruses. Virology 413:139–147. 10.1016/j.virol.2011.02.015 [DOI] [PMC free article] [PubMed] [Google Scholar]
- 47.van Riel D, Munster VJ, de Wit E, Rimmelzwaan GF, Fouchier RA, Osterhaus AD, Kuiken T. 2006. H5N1 virus attachment to lower respiratory tract. Science 312:399. 10.1126/science.1125548 [DOI] [PubMed] [Google Scholar]
- 48.Driskell EA, Pickens JA, Humberd-Smith J, Gordy JT, Bradley KC, Steinhauer DA, Berghaus RD, Stallknecht DE, Howerth EW, Tompkins SM. 2012. Low pathogenic avian influenza isolates from wild birds replicate and transmit via contact in ferrets without prior adaptation. PLoS One 7:e38067. 10.1371/journal.pone.0038067 [DOI] [PMC free article] [PubMed] [Google Scholar]
- 49.Baranovich T, Bridges O, Burnham A, Carey D, Cline TD, Crumpton JC, DeBeauchamp J, Duan S, Ducatez MF, Elbahesh H, Fabrizio T, Forrest HL, Franks J, Freiden P, Govorkova E, Guan Y, Jones JC, Kaplan BS, Karlsson EA, Kercher LA, Koçer ZA, Krauss S, Little B, Marathe BM, McClaren L, McKenzie PP, Meliopoulos VA, O'Brien KB, Oguin TH, III, Oshansky CM, Peiris JSM, Prevost K, Rubrum A, Russell CJ, Sanders C, Seiler P, Seufzer B, Shanmuganatham KK, Sonnberg S, Stoner TD, Jeevan T, Turner J, van de Velde LA, van de Velde N, Walker D, Webby RJ, Webster RG, Wong S-S, Yoon S-W, Zanin M, Zaraket H, Schultz-Cherry SL, Thomas PG. 2013. Assessing the fitness of distinct clades of influenza A (H9N2) viruses. Emerg. Microbes Infect. 2:e75. 10.1038/emi.2013.75 [DOI] [PMC free article] [PubMed] [Google Scholar]
- 50.Centers for Disease Control and Prevention 2012, posting date Influenza risk assessment tool (IRAT). Centers for Disease Control and Prevention, Atlanta, GA: http://www.cdc.gov/flu/pandemic-resources/tools/risk-assessment.htm [Google Scholar]
- 51.Lipatov AS, Kwon YK, Sarmento LV, Lager KM, Spackman E, Suarez DL, Swayne DE. 2008. Domestic pigs have low susceptibility to H5N1 highly pathogenic avian influenza viruses. PLoS Pathog. 4:e1000102. 10.1371/journal.ppat.1000102 [DOI] [PMC free article] [PubMed] [Google Scholar]
- 52.Stevens J, Blixt O, Tumpey TM, Taubenberger JK, Paulson JC, Wilson IA. 2006. Structure and receptor specificity of the hemagglutinin from an H5N1 influenza virus. Science 312:404–410. 10.1126/science.1124513 [DOI] [PubMed] [Google Scholar]
- 53.Hatta M, Hatta Y, Kim JH, Watanabe S, Shinya K, Nguyen T, Lien PS, Le QM, Kawaoka Y. 2007. Growth of H5N1 influenza A viruses in the upper respiratory tracts of mice. PLoS Pathog. 3:1374–1379. 10.1371/journal.ppat.0030133 [DOI] [PMC free article] [PubMed] [Google Scholar]
- 54.Cheung CL, Rayner JM, Smith GJ, Wang P, Naipospos TS, Zhang J, Yuen KY, Webster RG, Peiris JS, Guan Y, Chen H. 2006. Distribution of amantadine-resistant H5N1 avian influenza variants in Asia. J. Infect. Dis. 193:1626–1629. 10.1086/504723 [DOI] [PubMed] [Google Scholar]
- 55.Yen HL, Ilyushina NA, Salomon R, Hoffmann E, Webster RG, Govorkova EA. 2007. Neuraminidase inhibitor-resistant recombinant A/Vietnam/1203/04 (H5N1) influenza viruses retain their replication efficiency and pathogenicity in vitro and in vivo. J. Virol. 81:12418–12426. 10.1128/JVI.01067-07 [DOI] [PMC free article] [PubMed] [Google Scholar]
- 56.Yen HL, Lipatov AS, Ilyushina NA, Govorkova EA, Franks J, Yilmaz N, Douglas A, Hay A, Krauss S, Rehg JE, Hoffmann E, Webster RG. 2007. Inefficient transmission of H5N1 influenza viruses in a ferret contact model. J. Virol. 81:6890–6898. 10.1128/JVI.00170-07 [DOI] [PMC free article] [PubMed] [Google Scholar]
- 57.Chen GL, Lamirande EW, Yang CF, Jin H, Kemble G, Subbarao K. 2010. Evaluation of replication and cross-reactive antibody responses of H2 subtype influenza viruses in mice and ferrets. J. Virol. 84:7695–7702. 10.1128/JVI.00511-10 [DOI] [PMC free article] [PubMed] [Google Scholar]