

Abstract
Genotype 1 hepatitis E viruses (HEVs) are restricted to primate hosts, whereas genotype 3 HEVs predominantly infect swine, in addition to primates. In order to identify possible determinants of the host range, infectious recombinant viruses and chimeras of a genotype 1 isolate and a genotype 3 isolate were compared for their ability to infect versus transfect cultured human HepG2/C3A cells and swine LLC-PK cells. The patterns of luciferase expression from virus replicons containing the Gaussia luciferase gene in place of the viral ORF2 or ORF3 genes demonstrated that translation of the ORF2 capsid gene of genotype 1 virus is severely inhibited in swine kidney cells compared to its translation in rhesus macaque kidney or human liver cells. Therefore, this virus may produce insufficient capsid protein for optimal assembly in swine cells. Infectivity assays with a virus containing a chimeric capsid protein confirmed that amino acids 456 to 605 of the virus capsid protein comprised the virus receptor-binding region and suggested that genotype 1 viruses may be prevented from infecting swine because genotype 1 viruses are unable to enter swine cells. Rhesus macaque cells appeared to be better than human cells for growing the genotype 1 virus. These cell and virus combinations may serve as a useful in vitro model with which to study determinants of the natural host range of this virus.
INTRODUCTION
Hepatitis E virus (HEV; genus Hepevirus, family Hepeviridae) is a nonenveloped RNA virus that is transmitted by the fecal-oral route (1). The icosahedral capsid encloses a 7.2-kb, positive-sense viral genome that has 3 open reading frames (ORFs) (2). ORF1 is translated directly from the full-length genome, and ORF2 and ORF3 are both translated from a newly synthesized 2.2-kb bicistronic, subgenomic RNA that is generated during replication (3). ORF1 is ∼5 kb and encodes the nonstructural proteins required for replication. ORF2, the capsid protein gene, encodes 660 amino acids, but the size of the mature protein in virions is still unknown. ORF3, which mostly overlaps ORF2, encodes a protein of 113 to 114 amino acids that associates with the virion, aids in cell egress, and may be involved in cellular signaling pathways (2, 4, 5).
There are 4 genotypes of HEV that infect humans, and they can be divided into two groups on the basis of genotype (1). Genotypes 1 and 2 infect humans and nonhuman primates exclusively, whereas genotype 3 and 4 viruses are enzootic, ubiquitous in swine, and present to a lesser extent in other human food sources, such as deer, rabbits, and cows (6, 7). Genotype 1 commonly causes sporadic cases and epidemic waterborne acute hepatitis in developing countries with inadequate sanitation. Genotypes 3 and 4 are emerging in developed countries as food-borne human pathogens transmitted via undercooked meat, especially pork products. Genotype 3 viruses have recently been identified as a cause of chronic hepatitis in immunocompromised recipients of transplanted organs or in patients infected with HIV (8, 9). Although HEV is best known as a hepatotropic virus, HEV infection has recently been associated with extrahepatic manifestations, including kidney injury and neurological symptoms (8). Also, extrahepatic sites of HEV replication were identified in the swine model, including in the small intestines, lymph nodes, colons, and kidneys (10).
Since HEV has been successfully grown in cell culture only recently, earlier molecular studies relied heavily on the two available cDNA clones of infectious virus or on vector-expressed viral genes. Transcripts from an infectious cDNA clone of the genotype 1 Sar55 strain were able to infect and cause hepatitis in nonhuman primates, but, although the recombinant virus could replicate and form infectious particles in cell culture, it did not spread in these cultures (11, 12). Similarly, transcripts from a cDNA of a genotype 3 swine isolate were infectious for swine but had a limited ability to grow in cell culture (13). Okamoto and colleagues in Japan were the first to adapt HEV to grow efficiently in cell culture; they adapted both a genotype 3 virus and a genotype 4 virus isolated from acutely infected humans to grow in two human cell lines (the PLC/PRF/5 hepatoma and A549 lung cell lines) (14, 15). None of these viruses was cytopathogenic.
Most recently, Shukla and colleagues adapted the Kernow genotype 3 virus strain, isolated from a chronically infected patient, to grow in human hepatoma cell cultures and demonstrated that this adapted virus could also infect cultured swine kidney cells (16). Mutagenesis of an infectious cDNA clone of Kernow virus that had been serially passaged 6 times in cell culture demonstrated that the ability of this strain to grow efficiently in cell culture depended on a 174-nucleotide-long sequence representing part of a human S17 ribosomal protein gene (17); this sequence had been inserted into the hypervariable region (HVR) of ORF1 sometime prior to cell culture, assumably through recombination between the virus genome and a host mRNA.
It is not known why genotype 1 and 2 strains of HEV infect only humans or nonhuman primates, whereas genotype 3 and 4 strains infect swine, in addition to these hosts. The quasispecies of a genotype 1 virus (Sar55) in feces infected significantly more human HepG2/C3A hepatoma cells than swine LLC-PK kidney cells (16). In contrast, the quasispecies of a genotype 3 virus (Kernow) in feces infected both of these cell lines relatively efficiently (16). These results mimicked the species host ranges observed in vivo and suggested that it might be possible to use these two cell culture lines, in combination with infectious cDNA clones of Sar55 and of Kernow viruses, as an alternative to live animal studies in an initial exploration of the determinants of the HEV host range.
Here, we report the results of in vitro experiments investigating whether the limited host range of genotype 1 viruses compared to the host range of genotype 3 viruses reflected a block to entry into cells or a restriction at a later step.
MATERIALS AND METHODS
Cell culture.
Cultured swine liver cells were not available, so swine kidney cells that had been shown to be efficiently infectible with genotype 3 viruses but not with genotype 1 viruses were used (16). Cells of the human hepatoma HepG2/C3A (CRL-10741), rhesus macaque kidney FRhK-4 (CRL-1688), and swine kidney LLC-PK (CL-101) cell lines were purchased from the American Type Culture Collection. The FRhK-4 cells had been passaged in-house and stored in liquid nitrogen. S10-3 cells are an in-house-isolated subclone of Huh-7 hepatoma cells that were selected for their ability to produce infectious Sar55 virus. All cell lines were propagated in Dulbecco modified Eagle medium (Cellgro; Mediatech) supplemented with 2 mM l-glutamine, penicillin-streptomycin (Sigma), and 10% fetal bovine serum. HepG2/C3A and LLC-PK cells were grown on rat tail collagen type 1 (Millipore). All cell stocks were grown at 37°C in the presence of 5% CO2.
Plasmids.
The infectious cDNA clones of HEV strain Kernow (clone P6; GenBank accession no. JQ679013) (17) and strain Sar55 (clone pSK-E2; GenBank accession no. AF444002) (11) and the Sar55 cDNA clone (clone Sar55/S17) containing human S17 gene sequences (16) have been described previously. The Gaussia luciferase gene was amplified from the pGLuc-Basic vector purchased from New England BioLabs. Plasmid P6/Sar-rcp was constructed by standard techniques of PCR fusion and restriction fragment replacement: nucleotides 6724 to 7173 from the P6 infectious cDNA clone were removed and replaced with nucleotides 6510 to 6959 from Sar55 clone pSK-E2. The entire plasmid was sequenced to confirm that no unwanted mutations had been introduced.
Transfection.
Plasmids were linearized at a 3′-terminal MluI (Kernow related) or BglII (Sar55 related) site. Capped RNA transcripts were generated with a T7 riboprobe in vitro transcription system (Promega) and anti-reverse cap analog (Ambion) as described previously (11). For transfection of S10-3 cells, 23 μl of RNA transcription mixture, 1 ml of Opti-MEM medium (Gibco), and 20 μl of DMRIE-C transfection reagent (Invitrogen) were mixed and added to cells in a T25 flask. After incubation with the transfection mixture for 5 h at 34.5°C in a CO2 incubator, the transfection mixture was replaced with culture medium containing 10% fetal bovine serum, and incubation was continued. Transfected S10-3 cells were always incubated at 34.5°C.
HepG2/C3A, FRhK-4, and LLC-PK cells were inefficiently transfected or were killed by DMRIE-C, so they were transfected by electroporation using a Bio-Rad Gene Pulser II apparatus at settings of 240 V and 950 capacitance using a Bio-Rad cuvette (catalog no. 165-2086). RNA transcripts from a 100-μl Promega transcription mixture or a 20-μl Ambion T7 Ultra kit transcription mixture were extracted with the TRIzol LS reagent (Invitrogen), precipitated with isopropanol, washed with 75% ethanol, and resuspended in 50 μl of water. Confluent cells in a 100-mm dish were released with trypsin and pelleted at 525 × g at 4°C for 5 min. The cells were resuspended in 400 μl of Opti-MEM (Gibco); mixed with the RNA; pulsed; added to a T25 flask, a 6-well culture plate, or a 24-well culture plate with culture medium containing 20% fetal bovine serum; and incubated at 34.5°C or 37°C overnight; HepG2/C3A electroporated cells in a T25 flask were combined with one-fourth of the cells from a T25 stock flask in order to provide a culture dense enough to promote growth. The next morning, medium was replaced with fresh medium containing 10% serum, and the incubation was continued.
Infection of cultured cells.
More foci were consistently detected on HepG2/C3A cells than on S10-3 cells, so they were used as the human cells for all infectivity assays. T25 flasks of S10-3 cells transfected with a virus plasmid were trypsinized, cells were pelleted in a 2-ml Sarstadt tube in a tabletop centrifuge, liquid was removed, and cell pellets were frozen at −80°C until lysed. Cells were lysed by adding 0.9 ml H2O and vortexing intermittently at room temperature for 10 min, cellular debris was removed by centrifugation at 13,000 × g for 2 min, and the supernatant was used to infect cells. A total of 100,000 cells/well were seeded onto eight-well Lab-Tek II CC2 slides (Nunc) a day before infection. Virus samples were serially diluted in cell culture medium, and 100 μl of diluted virus was added to each well, followed by incubation for 5 h at 34.5°C in a CO2 incubator. The virus mixture was removed, and cell culture medium was added, followed by incubation at 34.5°C for 3 to 5 days.
Immunofluorescence analysis and focus-forming assay.
Transfected or infected cells on 8-well chamber slides were washed with phosphate-buffered saline (PBS), fixed, and permeabilized with acetone. ORF2 and ORF3 proteins were detected with a mixture of HEV ORF2-specific hyperimmune plasma from an HEV-infected chimpanzee (chimp 1313) and rabbit anti-ORF3 peptide antibody (12); the chimpanzee plasma had been preadsorbed on HepG2/C3A cells to minimize background staining. Secondary antibodies were a mixture of Alexa Fluor 488-conjugated goat anti-human IgG (Molecular Probes) and Alexa Fluor 568-conjugated goat anti-rabbit IgG (Molecular Probes). Stained cells were overlaid with Vectashield mounting medium with DAPI (4′,6′-diamidino-2-phenylindole; Vector Laboratories) and visualized under a Zeiss Axioscope 2 Plus fluorescence microscope at a magnification of ×40. Positive cells or foci were manually counted.
Flow cytometric analysis.
Trypsinized cells were pelleted at 525 × g, mixed with 1 ml of methanol for 15 min at 4°C, and stored in methanol at −80°C until all of the samples from one experiment were stained in parallel. The cells were pelleted out of methanol, washed once with 5 ml of PBS, and resuspended in 100 μl of blocking solution (0.5% skim milk, 0.5% crystalline bovine serum albumin, 0.1% Triton X-100 in PBS) at room temperature for 30 min before the addition of 100 μl of 2× chimp 1313 preadsorbed serum or 2× rabbit anti-ORF3 peptide; the cells were then washed with 10 ml of PBS and resuspended in 100 μl of antihuman or antirabbit Alexa Fluor 488-conjugated antibody. After 30 min, the cells were washed with 10 ml of PBS, resuspended in ∼0.5 ml of PBS, and analyzed using a FACScan flow cytometer (Becton, Dickinson). A total of 20,000 to 40,000 events were acquired for each sample, and the data were analyzed using BD CellQuest software.
Luciferase assay.
All medium was removed from the culture, clarified by centrifugation at 16,000 × g, and stored at −80°C; fresh medium was added to the culture, and incubation was continued. Luciferase activity was quantified with a Renilla luciferase assay system (Promega) as per the manufacturer's protocol. Briefly, 20 μl culture medium was added per well of a 96-well black, flat-bottom microplate (Corning), followed by addition of Renilla luciferase assay substrate and detection of luminescence using a Synergy 2 multimode microplate reader (Bio-Tek, Winooski, VT). The microplate reader was set to dispense 50 μl of substrate, followed by shaking for 2 s and reading for 5 s. Samples were assayed in triplicate and read sequentially.
RESULTS
First, it was necessary to determine if the synthetic cloned virus genome displayed the same host range phenotypes that the uncloned quasispecies had. The Kernow virus genome had been cloned from virus passaged 6 times in cell culture, and the resultant cDNA clone, P6, encodes a virus adapted to replicate in and spread throughout cultures of human HepG2/C3A cells (16, 17). Infectious P6 recombinant viruses can be harvested from the medium of infected HepG2/C3A cell cultures, but higher yields are obtained in lysates of transfected S10-3 human hepatoma cells (S. U. Emerson, unpublished data). Unfortunately, although Sar55 replicates in transfected S10-3 cells and infectious virions are produced, most (over 90%) remain within the cells, so cell lysates serve as the only practical source of recombinant virions (12, 18). For these reasons, clonal populations of both the Sar55 and Kernow viruses were obtained as comparable lysates of S10-3 cells that had been transfected with in vitro-transcribed viral genomes. These clone-derived viruses were compared for their ability to infect the same human and swine cell lines that had been used for infections by the noncloned quasispecies.
In a representative experiment, although immunofluorescence microscopy demonstrated that a similar proportion (∼15%) of S10-3 cells was successfully transfected with each virus genome (data not shown), the yield of infectious virus recovered in cell lysates was∼10-fold lower for Sar55 than for P6 (Fig. 1A). However, this amount of Sar55 virus was sufficient for immunofluorescence microscopy to demonstrate that, compared to P6 virions, the Sar55 virions infected disproportionately fewer swine cells than human cells (Fig. 1B). Therefore, the two recombinant viruses appeared to display host range phenotypes similar to those of the respective wild-type quasispecies. However, whereas the uncloned Kernow quasispecies had infected more LLC-PK cells than HepG2/C3A cells, the cloned P6 virus infected a substantial number of LLC-PK cells but infected HepG2/C3A cells somewhat more efficiently, depending on the experiment (Table 1). This was probably because the P6 virus, used as the cloning source for the P6 plasmid, had been adapted to grow in the hepatocytes.
FIG 1.
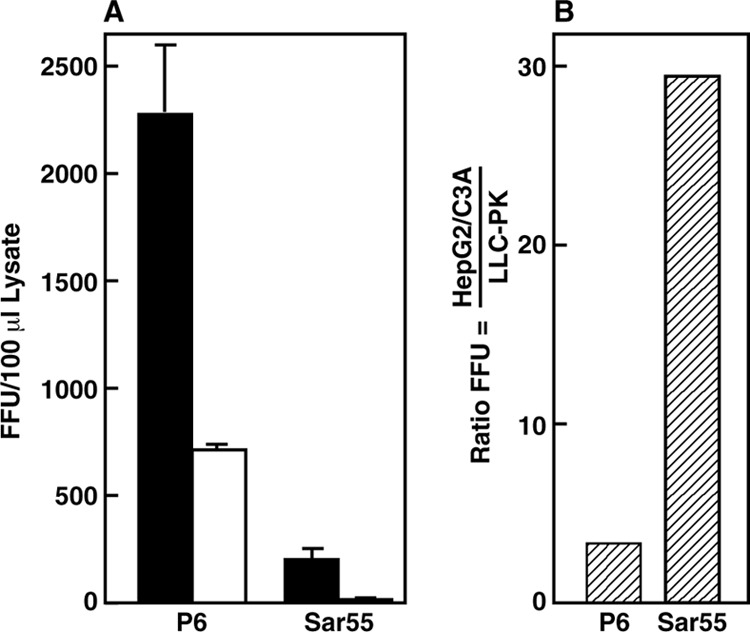
Focus-forming assays comparing infectivity titers of Sar55 and P6 virions on human HepG2/C3A and swine LLC-PK cells. P6- and Sar55-transfected S10-3 cell cultures (∼15% of cells were positive for the ORF2 protein in each culture) were harvested on day 8, and virions in clarified cell lysates were titrated in triplicate on HepG2/C3A cells (solid bars) and on LLC-PK cells (open bars). (A) On day 6 postinfection, cells were fixed and stained for ORF2 protein and foci were counted manually under code. Error bars indicate standard deviations. (B) Ratio of foci on the two cell lines. Data are included in Table 1, experiment 3. FFU, focus-forming units.
TABLE 1.
Infectivity assay results
| Expt no. | Virus | No. of FFUa/100 μl lysate |
H/Lb ratio | |
|---|---|---|---|---|
| LLC-PK cells | HepG2/C3A cells | |||
| 1c | P6 | 4,240 | 14,880 | 3.5 |
| P6/Sar-rcp 1 | 640 | 41,840 | 65.3 | |
| 2d | P6 | 3,087 | 15,120 | 4.9 |
| P6/Sar-rcp 2 | 292 | 18,180 | 62.3 | |
| P6/Sar-rcp 3 | 245 | 16,110 | 65.8 | |
| 3e | P6 | 711 (24)f | 2,277 (312) | 3.2 |
| P6/Sar-rcp 1 | 158 (59) | 5,751 (1,257) | 36.4 | |
| 4e | P6 | 2,124 (452) | 22,080 (3,707) | 10.4 |
| P6/Sar-rcp 1 | 730 (177) | 34,620 (7,808) | 47.4 | |
FFU, focus-forming units.
H/L, titer on HepG2/C3A cells divided by titer on LLC-PK cells.
Results are for a single sample.
Results are means of duplicate samples.
Results are means of triplicate samples.
Standard deviations are given in parentheses.
Sar55 replication within swine cells is blocked.
The paucity of cells immunostained for the ORF2 protein in swine cell cultures following exposure to Sar55 virions could reflect an inability of the virus to attach to or to enter the cells and/or a failure to produce or efficiently translate the subgenomic RNA necessary for ORF2 protein production (3). Before virion attachment to cells could be studied, it was necessary to determine if Sar55 could produce detectable ORF2 protein within LLC-PK cells, since immunostaining of ORF2 protein was required to identify infected cells. Electroporation of genomic RNA bypasses the steps of virus attachment and entry by delivering the infectious genome directly into the cytoplasm; thus, this procedure could be used to separate entry and replication steps. Therefore, the relative ability of Sar55 and P6 synthetic genomes to successfully transfect HepG2/C3A cells compared to their ability to successfully transfect LLC-PK cells was determined by flow cytometry of cells immunostained for ORF2 protein at 7 days postelectroporation. Each viral RNA sample was split into two identical aliquots just prior to transfection of the two cell lines. Although the P6 capsid protein could easily be detected by day 3 posttransfection, incubation was continued for 7 days in order to optimize detection of Sar55 capsid protein since Sar55 virus grew so inefficiently. Since the number of cells transfected varied from experiment to experiment, it was always necessary to compare the ratio of HepG2/C3A to LLC-PK Sar55-transfected cells to the ratio of HepG2/C3A to LLC-PK P6-transfected cells in the same experiment.
Whereas the P6 genomes successfully transfected about 6 times more HepG2/C3A cells than LLC-PK cells, this ratio for the Sar55 genome was 48, reflecting barely detectable ORF2 protein production in the LLC-PK cells (Fig. 2A). These data suggest that an internal block to Sar55 genome replication and/or ORF2 protein production in LLC-PK cells existed and that it could be at least partially responsible for the inability of Sar55 virus to produce foci in these cells.
FIG 2.
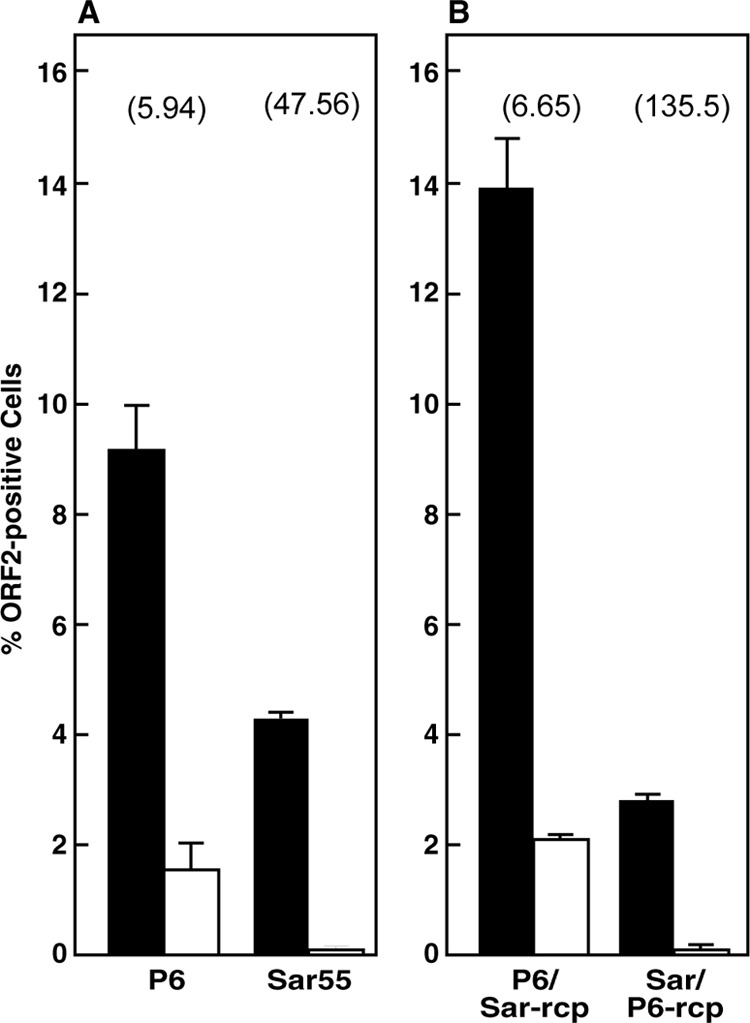
Flow cytometry of HepG2/C3A and LLC-PK cells transfected with genotype 1, genotype 3, or chimeric virus genomes. HepG2/C3A cells (solid bars) and LLC-PK cells (open bars) were transfected by electroporation with in vitro transcripts of P6 and Sar55 (A) or P6/Sar-rcp and Sar/P6-rcp (B). The constructs in panel B are described in the Fig. 6 legend. Electroporated cells were plated in triplicate in a 6-well tissue culture plate, incubated at 34.5°C for 7 days, and then immunostained for ORF2 protein prior to flow cytometry. The ratio of transfected HepG2/C3A cells to LLC-PK cells is indicated above each pair of bars. All data were obtained in the same experiment. Error bars indicate standard deviations.
Sar55 ORF2 protein synthesis is diminished in LLC-PK cells.
Immunofluorescence microscopy of LLC-PK cell cultures stained after transfection with Sar55 suggested that fewer cells were stained for ORF2 protein than for ORF3 protein. In contrast, following transfection with P6 genomes, similar numbers of LLC-PK cells were stained for each protein (data not shown). Flow cytometry of Sar55- and P6-transfected cell cultures divided and then stained individually for ORF2 or ORF3 protein confirmed that for P6 equivalent percentages of HepG2/C3A cells (ORF2/ORF3 ratio, 1.0) and LLC-PK cells (ORF2/ORF3 ratio, 0.97) were stained for ORF2 protein as were stained for ORF3 protein (Fig. 3A). In HepG2/C3A cells, Sar55 had an ORF2/ORF3 protein ratio of 0.68 (Fig. 3B). Unfortunately, the percentage of Sar55-transfected LLC-PK cells stained for each protein was too low to provide reliable ratios (Fig. 3B).
FIG 3.
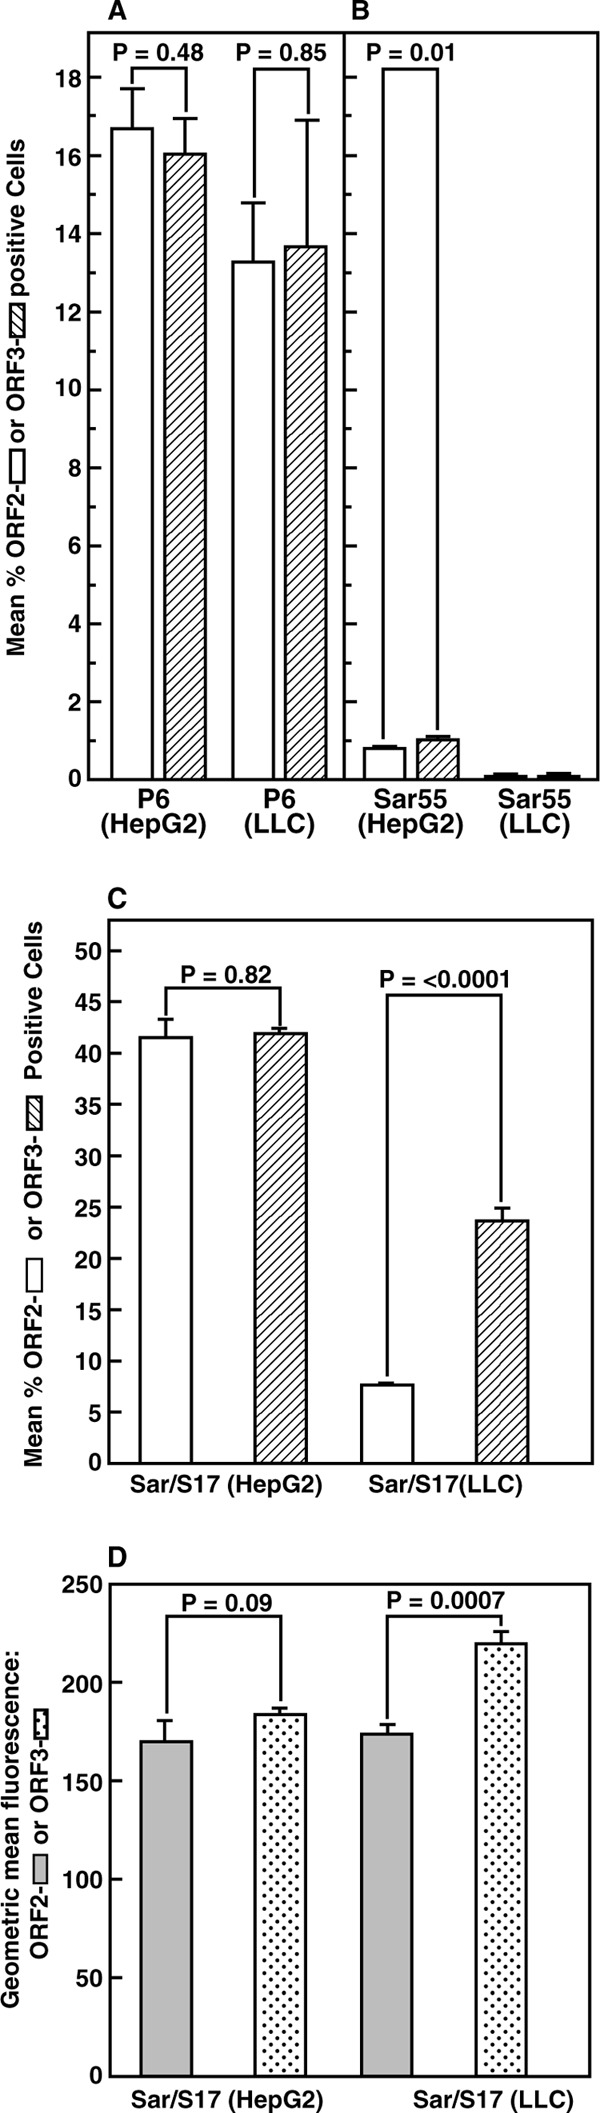
Flow cytometry of transfected cells stained separately for the ORF2 or ORF3 protein. HepG2/C3A and LLC-PK cells electroporated with transcripts from P6 (A), Sar55 (B), or Sar/S17 (C, D) were plated in 6 wells of a 6-well culture plate, incubated at 34.5°C, and harvested 7 (A, B) or 5 (C, D) days later. Cells in triplicate wells were stained for the ORF2 protein, followed by goat anti-human IgG labeled with Alexa Fluor 488 (open bars); cells in the other 3 wells were stained for the ORF3 protein, followed by goat anti-rabbit IgG also labeled with Alexa Fluor 488 (hatched bars). Flow cytometry was performed with the same settings for all samples. (A to C) Mean percentage of positive cells, in triplicate; (D) mean of the geometric mean fluorescence intensity in the same triplicate samples assayed for panel C. Shaded bars, ORF2; dotted bars, ORF3. Error bars indicate standard deviations. P values were determined by Student's t test; P values of less than 0.05 were statistically significant.
In an attempt to overcome the obstacle imposed by the consistently low levels of successful transfection by Sar55 genomes, the S17 sequence that promoted the growth of P6 virus in cell culture was incorporated into the corresponding site in the HVR of ORF1 of Sar55 to generate Sar/S17. Although this insertion had previously made no detectable difference in the number of successfully transfected S10-3 cells (16), it led to markedly higher percentages of both HepG2/C3A and LLC-PK successfully transfected cells, as demonstrated by flow cytometry of cell cultures stained separately for ORF2 and ORF3 proteins (Fig. 3C). As was found for P6-transfected cultures, equivalent numbers of cells stained for ORF2 protein and for ORF3 protein were identified in Sar/S17-transfected HepG2/C3A cells (ratio, 1.0). In contrast, whereas in LLC-PK cells this ratio of stained ORF2 proteins to stained ORF3 proteins also approached 1.0 for P6 (Fig. 3A), that for Sar/S17 in LLC-PK cells was 3 times lower (ORF2/ORF3 ratio, 0.32) (Fig. 3C). The geometric mean fluorescence intensity (a reflection of the amount of immunostained protein within a cell) for the two Sar55 proteins was not statistically significantly different in HepG2/C3A cells but was significantly greater for ORF3 protein in LLC-PK cells (Fig. 3D), suggesting either that accumulation of ORF2 protein was diminished or that accumulation of ORF3 protein was increased in these cells.
Flow cytometry did not provide a quantitative comparison of ORF2 and ORF3 protein production, since it depended on the properties of the antibodies, in addition to the stability and amounts of the targeted proteins. In order to obtain a more direct comparison of the frequency of translation of the two ORFs, the Gaussia luciferase gene was substituted for the viral ORF2 gene and for the viral ORF3 gene in individual plasmids carrying Sar55 and of P6. Since the ORF2 and ORF3 genes overlap near the 5′ termini, neither of the two viral proteins was produced by these mutants. In each case, the normal AUG initiation codon of each ORF was used so that the luciferase proteins that were translated from either ORF in either viral genome were identical.
Since S10-3 cells transfected with the DMRIE-C reagent were our source of recombinant virions, these plasmids were first tested in the S10-3 cell system to determine the translation patterns associated with the production of known infectious viruses. Luciferase in the medium of transfected cells was assayed at 72-h intervals. The overall pattern for the two virus replicons was similar (Fig. 4). The ratio of the total luciferase produced from ORF2 to that produced from ORF3 was 7.3 for the P6 replicon and 4.5 for the Sar/S17 replicon.
FIG 4.
Expression of luciferase from ORF2 or ORF3 in S10-3 cells. Cells were transfected with the DMRIE-C reagent and P6 (A) or Sar/S17 (B) genomes expressing Gaussia luciferase in place of the viral ORF2 or ORF3 protein. Cells were plated in 3 wells of a 24-well plate at 34.5°C, and all medium was collected and replaced every 72 h. In each panel, means of triplicate values represent the number of Gaussia luciferase (Gluc) units expressed from ORF2 (solid bars) and from ORF3 (open bars) in 72 h. Error bars indicate standard deviations.
Next, plasmids were transcribed in vitro, and equal amounts of purified P6 and Sar/S17 RNA genomes encoding luciferase were electroporated into HepG2/C3A and LLC-PK cells, which were then cultured. Luciferase activity in the medium was determined at 24-h (Fig. 5) or at 48-h (data not shown) intervals. The patterns of luciferase expression were qualitatively similar for both sampling schedules, and for both schedules, the values for Sar/S17 expression were much lower than those for P6 expression.
FIG 5.

Expression of luciferase from ORF2 or ORF3 in different cell lines. Cells were electroporated in parallel with equal amounts of purified P6 (A to C) or Sar/S17 (D to F) genomes expressing Gaussia luciferase in place of the viral ORF2 or ORF3 protein. Cells were plated in 3 wells of a 24-well plate at 37°C, and all medium was collected and replaced every 24 h starting on day 1. All data were obtained in the same experiment. In each panel, means of triplicate values represent the number of luciferase units expressed from ORF2 (solid bars) and from ORF3 (open bars) in 24 h. Error bars indicate standard deviations.
Unexpectedly, this quantitative comparison of translation from the two ORFs in HepG2/C3A cells demonstrated a relatively small amount of ORF3 translation from P6 genomes and a more balanced translation of ORF2 and ORF3 from Sar/S17 genomes, but with ORF3 translation favored (Fig. 5A and D).
For both HepG2/C3A and LLC-PK cells, the levels of luciferase expressed from ORF2 of P6 genomes increased between the first and second time points, rose at subsequent time points, and remained at high levels until the experiment was terminated. In both cell types, the sum of the luciferase expressed from ORF2 of P6 was 8- to 12-fold higher than the sum of that expressed from ORF3 (Fig. 5A and B).
In contrast, the profiles of luciferase expression from ORF2 and ORF3 of the Sar/S17 genomes differed by cell type (Fig. 5D and E). In HepG2/C3A cells, the sum of the expression of luciferase was roughly comparable regardless of which ORF was utilized, resulting in an ORF2/ORF3 luciferase ratio of 0.8. However, in LLC-PK cells, luciferase was expressed at lower levels from ORF2 than from ORF3 to yield an ORF2/ORF3 expression ratio of 0.35; in both cell lines, the maximum level of luciferase expressed from ORF3 was obtained at the first time point and steadily decreased thereafter.
In order to determine if the limited luciferase expression from ORF2 of Sar/S17 genomes reflected the kidney cell origin of LLC-PK cells, a kidney cell line (FRhK-4) from rhesus macaques was also electroporated in parallel with the same preparations of synthetic genomes. This kidney cell line was chosen because Sar55 virus readily infects rhesus macaques (19).
Although they were more compact, the patterns of luciferase expression from P6 genomes in FRhK-4 cells (Fig. 5C) resembled those from P6 genomes in HepG2/C3A or LLC-PK cells, whereas the patterns of expression from Sar/S17 genomes in FRhK-4 cells (Fig. 5F) were more like those obtained in HepG2/C3A cells than those obtained in LLC-PK cells. Most surprising was the dramatic increase in expression from the Sar/S17 genome transfected into FRhK-4 cells: 1,800-fold and 1,300-fold increases from ORF2 and 2,400-fold and 700-fold increases from ORF3 compared to the levels in HepG2/C3A and LLC-PK cells, respectively. Also, in preliminary experiments, virus in lysates of FRhK-4 cells transfected with Sar/S17 infected almost 10 times as many HepG2/C3A cells as did virus in parallel lysates of cells transfected with P6 (data not shown). These data support a conclusion that LLC-PK cells are not very permissive for Sar/S17 replication because of species rather than cell type restrictions.
Importantly, these data also demonstrate that in order to determine if virus binding to or entry into HepG2/C3A and LLC-PK cells differed between the two cell types, these steps would have to be dissociated from Sar55 RNA synthesis and/or translation, a procedure which was accomplished through the use of a chimeric virus.
Replication-competent chimera of Sar55 and P6 viruses.
A chimera containing approximately two-thirds of the 5′ end of the genome encoding the robust replication machinery of P6 and approximately one-third of the 3′ end encoding the ORF2 and ORF3 proteins of Sar55 (2,208 nucleotides, or 31% of the Sar55 genome) was constructed in an attempt to produce a virus that displayed the receptor-binding components of the Sar55 capsid and retained the ability of P6 genomes to replicate in swine cells. However, this chimera successfully transfected less than 1/10 as many S10-3 cells (only 1.3%) as did either the Sar55 (13.2%) or the P6 (23.6%) parent genomes and did not produce an amount of virus sufficient for infection studies (data not shown). This result suggested that it would be beneficial to minimize the size of the Sar55 component.
The recent solution of the crystal structure of hepatitis E virus particles had provided approximate boundaries for the region of the capsid protein believed to participate in receptor binding (20–22). Therefore, in an effort to produce a more viable chimeric virus with the cell attachment properties of Sar55, only the 450 nucleotides encoding this putative receptor-binding region in the P6 plasmid were replaced with those from the corresponding region of Sar55 to generate P6/Sar-rcp, a chimera containing only 6% of the Sar55 genome. Unlike the chimera containing the entire 3′ third of Sar55, this chimeric genome transfected as many or more S10-3 cells (∼20%) as the P6 genome did (∼10%) (data not shown). Of the 150 amino acids encoded by this region, 13 differed between the two viruses, and only 4 of these differences represented nonconservative changes (Fig. 6).
FIG 6.
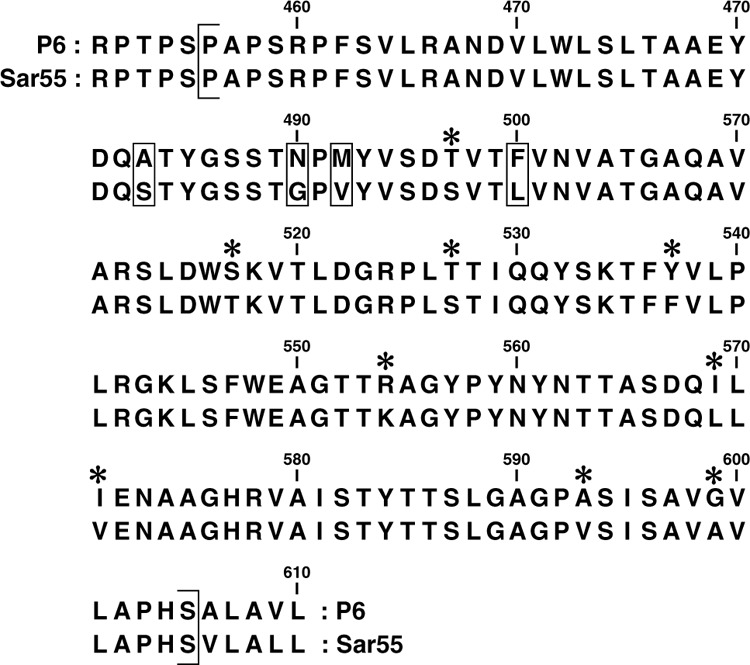
Schematic of the ORF2 region swapped to generate the P6/Sar-rcp chimera. The bracketed ORF2 region encoding amino acids 456 to 605 was removed from the P6 genome (top line) and replaced with the corresponding region from the Sar55 genome (bottom line) to generate P6/Sar-rcp. Similarly, the bracketed region of the Sar/S17 genome was replaced with that of P6 to generate Sar/P6-rcp. The positions of conservative amino acid differences are marked with asterisks, and nonconservative differences are boxed.
In contrast to the inability of the Sar55 genomes to successfully transfect many LLC-PK cells, flow cytometry of cells stained for the ORF2 protein demonstrated that the P6/Sar-rcp chimeric genome was able to transfect both HepG2/C3A and LLC-PK cells to a similar extent as P6 (Fig. 2B). A second chimera, Sar/P6-rcp, expected to have the receptor-binding properties of P6, was constructed by replacing the corresponding 450 nucleotides in the Sar55 plasmid with those from P6. This chimera was not useful because it successfully transfected HepG2/C3A and LLC-PK cells even less efficiently than Sar55 did (Fig. 2B). These data indicate that the small portion of the Sar55 genome inserted into P6 to generate P6/Sar-rcp was not detrimental to replication of the chimeric genome since the ORF2 protein was easily detected. Most importantly, the chimeric virus replicated and spread throughout the culture of HepG2/C3A cells with kinetics very similar to those of the cell culture-adapted P6 parent virus (Fig. 7A), indicating that this chimeric virus not only was able to replicate in HepG2/C3A cells but also was able to assemble and exit into the medium as infectious virions (Fig. 7B).
FIG 7.
Growth of P6 and P6/Sar-rcp in transfected HepG2/C3A cells. An aliquot of HepG2/C3A cells was transfected by electroporation with in vitro transcripts of P6 (open bars) or P6/Sar-rcp (hatched bars). Cells were distributed to 9 wells of 6-well tissue culture plates and incubated at 37°C, and medium and cells of triplicate wells of each virus culture were harvested on the indicated days. (A) Mean percentage of cells stained for the ORF2 protein, as determined by flow cytometry; (B) mean titer of triplicate samples titrated on HepG2/C3A cells under code. Error bars indicate standard deviations. P values were determined by Student's t test for the day 18 sample.
The P6/Sar-rcp virus displays a host range restriction.
Sar55 had infected about 30 times more HepG2/C3A cells than LLC-PK cells (Fig. 1). In order to determine if the host range of P6/Sar-rcp virions was more like that of Sar55 or that of P6, host range infectivity assays were performed with lysates of S10-3 human hepatoma cells that had been transfected in parallel with synthetic viral genomes. Because of the consistently low yield of infectious Sar55 virus obtained from transfected cells, Sar55 was tested in only one experiment (Fig. 1). Dilutions of S10-3 cell lysates were plated in parallel on HepG2/C3A cells and LLC-PK cells, and the number of infected cells or foci was manually counted; a total of three cDNA clones of P6/Sar-rcp were tested in four independent experiments (Table 1). Note that within each of the 4 experiments, the titer of P6/Sar-rcp virus was similar to or higher than that of P6 virus prepared in parallel; therefore, in marked contrast to Sar55 (Fig. 1 and Table 1), P6/Sar-rcp was as competent as P6 in replicating and producing infectious virus in S10-3 cells. However, P6/Sar-rcp exhibited an HepG2/C3A-to-LLC-PK infectivity ratio very close to that of Sar55 (Fig. 1) and quite different from that of P6. In all experiments, focus-forming infectivity assays demonstrated that P6 infected proportionately more LLC-PK cells than P6/Sar-rcp did (Table 1).
DISCUSSION
Understanding why genotype 1 hepatitis E viruses have a narrower host range than genotype 3 viruses is important for understanding the perplexing epidemiology of this virus. The lack of robust cell culture systems, especially for genotype 1 viruses, has been a major impediment to identifying factors that determine the host range of HEV. Three recent developments made the present studies feasible. First, construction of the P6 infectious cDNA clone, in combination with the demonstration that the S17 insert conferred enhanced growth potential in both human and swine cell cultures, led to the identification of a set of cultured cells that could serve as a relevant in vitro model for the in vivo host ranges of genotype 1 and 3 viruses (17). Second, the finding that transfer of the S17 region into the Sar55 genotype 1 virus genome greatly increased its ability to successfully transfect both HepG2/C3A and LLC-PK cells (Fig. 3) permitted experiments that generated statistically significant numbers. Finally, the demonstration that the genotype 1 ORF2 peptide p239, spanning amino acids 368 to 606, contained the capsid region most likely responsible for binding intact virions to cells (23) could be exploited to construct a replication-efficient virus containing a chimeric capsid protein consisting of a small segment of Sar55 in the P6 background.
Immunostaining with antibody to HEV ORF2 protein has routinely been used to identify cells either infected or transfected with HEV (12, 13). In either situation, this method requires RNA replication and the synthesis of the subgenomic RNA, which must then be translated efficiently enough to produce detectable ORF2 protein. The detection of an ∼10-fold lower level of infectious virus in lysates containing Sar55 than in those containing P6 (Fig. 1) was unexpected and could reflect either inefficient Sar55 virion entry into the cells or an underestimation due to insufficient production of ORF2 protein. Separate immunostaining for ORF2 and ORF3 proteins detected significantly fewer LLC-PK cells stained for ORF2 protein than ORF3 protein in Sar/S17-transfected cells but not in P6-transfected cells (Fig. 3). Replicons in which the luciferase gene was substituted for viral ORF2 or ORF3 sequences in P6 and Sar/S17 plasmids provided a way to quantify translation from the two reading frames since the identical protein was produced in each case. Additionally, the sum of the luciferase units produced from both reading frames should reflect the amount of subgenomic RNA which in turn depends on RNA synthesis. Even though identical amounts of purified RNA were electroporated into cells of each culture (Fig. 5A to F), the units of luciferase and the ratios of the total luciferase produced from ORF2 versus those produced from ORF3 by Sar/S17 differed dramatically from those for P6. Note the 4-log-unit difference in the scales for Gaussia luciferase units for P6 samples versus Sar/S17 samples. However, relative to the amount of luciferase produced in HepG2/C3A cells, the total amount of luciferase produced by Sar/S17 in LLC-PK cells (2.6 times more) was even more than that produced by P6 (1.4 times more than the amount produced in HepG2/C3A cells), suggesting that Sar/S17 RNA synthesis was not selectively inhibited in the swine cells. Further studies will be needed to confirm this.
Transfection of three cell lines with these luciferase-expressing replicons suggested that there was indeed an internal block to ORF2 production in Sar/S17-transfected LLC-PK cells and to a lesser extent in Sar/S17-transfected HepG2/C3A cells (Fig. 5). The low level of translation observed from ORF2 of Sar/S17-transfected cells most likely provided at least a partial explanation for the low number of infected cells detected in either HepG2/C3A or LLC-PK cultures; the amount of ORF2 produced may have been below the limit of detection in many cells. The patterns of ORF2 and ORF3 translation in these two cell lines were also distinctly different from those for the cell culture-adapted P6 virus. It seems reasonable to speculate that adaptation of Sar/S17 to cell culture might result in translation patterns more closely resembling those of P6. Certainly, the apparent deficit of the Sar55 ORF2 capsid protein, even in HepG2/C3A cells, would negatively impact the ability of the virus to spread in cell culture. The S10-3 cell line was chosen specifically for its ability to produce the largest quantity of infectious Sar55 virus; therefore, it is interesting that the ORF2 and ORF3 translation patterns of Sar/S17 genomes in S10-3 cells were most similar to those of P6 genomes, with an ORF2-to-ORF3 ratio of 4.5 for Sar/S17 compared to a ratio of 7.2 for P6 (Fig. 4 and 5). Unfortunately, since infectivity assays demonstrated that S10-3 cells are infected much less efficiently than HepG2/C3A cells, they are not suitable for virus adaptation studies (Emerson, unpublished.)
The observed difference in the time course of luciferase production from Sar/S17 genomes in FRhK-4 cells from that in HepG2/C3A cells implies that cellular factors can influence the relative rates of translation of ORFs 2 and 3. The impressive increase in the amount of luciferase produced most likely was not due simply to FRhK-4 cells being more efficiently transfected than HepG2/C3A cells, since the increase was so much greater for Sar/S17 than for P6. Whereas P6 genomes synthesized 4 and 3.7 times more luciferase from ORFs 2 and 3, respectively, in FRhK-4 cells than HepG2/C3A cells, Sar/S17 genomes synthesized 1,800 and 2,400 times more, respectively. It remains to be determined if Sar/S17 genomic replication and/or subgenomic RNA synthesis is enhanced in rhesus macaque cells compared to that in HepG2/C3A and LLC-PK cells. Unfortunately, these rhesus macaque cells, like the S10-3 cells, appear to lack the required attachment or entry factors and were not readily infected, even by P6 virus, and thus are unsuitable for adapting the Sar/S17 virus to grow in cell culture (Emerson, unpublished).
The dramatic difference in the number of cells transfected, the amount of luciferase secreted, and the quantity of infectious virus produced by Sar/S17-transfected cells between FRhK-4 cells and human liver cells suggests that Sar55 virus is better adapted to grow in the monkey cells and raises the question of whether macaques serve as a primary host for genotype 1 HEV. Macaques are susceptible to experimental infection with HEV (19), and, more importantly, wild and captive macaques have antibodies to HEV indicative of naturally acquired infections (19, 24–27). Macaques are common and in close contact with humans in many of the regions where HEV is highly endemic (28), including Asia, China, and India (29). Although macaques have been suggested in the past to be a possible reservoir for HEV (24), no one has yet characterized the virus infecting wild monkeys. In light of the cell culture results, it may be time to revisit this question.
The region of the Sar55 genome encoding amino acids 456 to 605 of the capsid protein was selected for incorporation into the P6 genome on the basis of elegant studies from three laboratories that had characterized this region to be the receptor-binding region, since it formed a protruding domain that reacted with neutralizing antibodies (20–22). Alanine-scanning experiments identified a number of residues in this region that appeared to be critical for receptor-binding function, since their replacement with alanine decreased or eliminated binding of recombinant virus-like particles (VLPs) to Huh7 human hepatoma cells (20). Although these conclusions made sense, they suffered from the caveat that they were based on negative data, i.e., a failure of the VLPs to bind to cells. Therefore, it could be argued that the alanine substitution grossly distorted the tertiary structure and that the replaced residue was not actually involved in binding. The HepG2/C3A and LLC-PK cell combination used in the present experiments circumvented this objection, since the capsids of all three viruses tested were certified to be functional by demonstrating that each of the three viruses readily infected HepG2/C3A cells.
Flow cytometry of cells stained for the ORF2 protein demonstrated that the P6/Sar-rcp chimeric virus genome successfully transfected LLC-PK swine cells as efficiently as the P6 genome did (Fig. 2); therefore, since ORF2 protein production requires subgenomic RNA synthesis, it can be concluded that an internal barrier to replication of this chimeric genome did not exist in LLC-PK cells. Long ago, studies of poliovirus established the precedent of receptor availability as a potent determinant of host range (30). The fact that virions of both the chimeric virus and Sar55 virus (Fig. 1; Table 1), but not those of P6 virus, were severely restricted in their ability to infect LLC-PK cells compared to their ability to infect HepG2/C3A cells supports the conclusion that amino acids 456 to 605 encompass the capsid receptor-binding region, and, furthermore, it suggests that the failure of Sar55 virions to infect swine cells reflects the absence of a suitable cellular receptor or coreceptor. The different binding patterns of Sar55 and P6 virions also suggest either that the cellular molecules involved in HEV entry into HepG2/C3A cells are not identical to those on LLC-PK cells or, alternatively, that Sar55 and P6 virions each interact with a different receptor (or coreceptors) on HepG2/C3A cells.
A comparison of the Sar55 and P6 amino acid differences and the results of alanine scanning did not identify amino acids that may control host range. For each of the 4 sets of double alanine substitutions that inhibited peptide binding to cells (20), the amino acids in the corresponding positions (amino acids 489 and 491, amino acids 560 and 561, amino acids 562 and 564, amino acids 585 and 586) in Sar55 and P6 capsids were identical to each other. Of the 4 nonconservative differences between the two capsid proteins, only one (amino acid 483) had been tested by alanine substitution, and it had no effect, which was not surprising, since it was already an alanine in P6. Only 2 of the 9 sites with conservative differences (amino acids 497 and 527, both T-S pairs) were included in the alanine scanning, and they did not prevent VLP binding to cells. It appears that a thorough mutagenesis study of this region, evaluated by infection of both human and swine cells, will be required to identify residues critical for entry into cells.
Extension of in vitro results to in vivo situations must be done cautiously, especially when more than one factor is implicated. Although hepatic cells would have been the first choice for the cultured swine cells, there were no swine liver cell lines available. Swine kidney cells are not the primary target of HEV, but they can be infected in vivo (10) and thus seemed to be a reasonable substitute. A possible caveat is that the S17 sequence inserted into the Sar55 genome might have affected the host range. However, the only obvious difference observed between Sar55 and Sar/S17 was the robustness of the infection. Finally, factors such as viral RNA replication or host innate immune responses have not been ruled out as additional factors affecting host range.
In conclusion, the data from the current study may provide new insights into means to identify the cellular receptor(s) or entry factors for HEV. It appears likely that receptor characterization may be one critical factor for understanding the epidemiology of this virus and that regulation of subgenomic translation may also be important.
ACKNOWLEDGMENT
This research was supported by the Intramural Research Program of the National Institute of Allergy and Infectious Diseases, National Institutes of Health.
Footnotes
Published ahead of print 6 November 2013
REFERENCES
- 1.Meng XJ, Anderson DA, Arankalle VA, Emerson SU, Harrison TJ, Jameel S, Okamoto H. 2012. Hepeviridae, p 1021–1028 In King AMQ, Adams MJ, Carstens EB, Lefkowitz EJ. (ed), Virus taxonomy: classification and nomenclature of viruses. Ninth report of the International Committee on Taxonomy of Viruses. Elsevier, San Diego, CA [Google Scholar]
- 2.Ahmad I, Holla RP, Jameel S. 2011. Molecular virology of hepatitis E virus. Virus Res. 161:47–58. 10.1016/j.virusres.2011.02.011 [DOI] [PMC free article] [PubMed] [Google Scholar]
- 3.Graff J, Torian U, Nguyen H, Emerson SU. 2006. A bicistronic subgenomic mRNA encodes both the ORF2 and ORF3 proteins of hepatitis E virus. J. Virol. 80:5919–5926. 10.1128/JVI.00046-06 [DOI] [PMC free article] [PubMed] [Google Scholar]
- 4.Yamada K, Takahashi M, Hoshino Y, Takahashi H, Ichiyama K, Nagashima S, Tanaka T, Okamoto H. 2009. ORF3 protein of hepatitis E virus is essential for virion release from infected cells. J. Gen. Virol. 90:1880–1891. 10.1099/vir.0.010561-0 [DOI] [PubMed] [Google Scholar]
- 5.Emerson SU, Nguyen HT, Torian U, Burke D, Engle R, Purcell RH. 2010. Release of genotype 1 hepatitis E virus from cultured hepatoma and polarized intestinal cells depends on open reading frame 3 protein and requires an intact PXXP motif. J. Virol. 84:9059–9069. 10.1128/JVI.00593-10 [DOI] [PMC free article] [PubMed] [Google Scholar]
- 6.Pavio N, Meng XJ, Renou C. 2010. Zoonotic hepatitis E: animal reservoirs and emerging risks. Vet. Res. 41:46. 10.1051/vetres/2010018 [DOI] [PMC free article] [PubMed] [Google Scholar]
- 7.Kaba M, Moal V, Gerolami R, Colson P. 2013. Epidemiology of mammalian hepatitis E virus infection. Intervirology 56:67–83. 10.1159/000342301 [DOI] [PubMed] [Google Scholar]
- 8.Kamar N, Legrand-Abravanel F, Izopet J, Rostaing LL. 2012. Hepatitis E virus: what transplant physicians should know. Am. J. Transplant. 12:2281–2287. 10.1111/j.1600-6143.2012.04078.x [DOI] [PubMed] [Google Scholar]
- 9.Dalton HR, Bendall RP, Keane FE, Tedder RS, Ijaz S. 2009. Persistent carriage of hepatitis E virus in patients with HIV infection. N. Engl. J. Med. 361:1025–1027. 10.1056/NEJMc0903778 [DOI] [PubMed] [Google Scholar]
- 10.Williams TPE, Kasorndorkbua C, Halbur PG, Haqshenas G, Guenette DK, Toth TE, Meng XJ. 2001. Evidence of extrahepatic sites of replication of the hepatitis E virus in a swine model. J. Clin. Microbiol. 39:3040–3046. 10.1128/JCM.39.9.3040-3046.2001 [DOI] [PMC free article] [PubMed] [Google Scholar]
- 11.Emerson SU, Zhang M, Meng XJ, Nguyen HT, St Claire M, Govindarajan S, Huang YK, Purcell RH. 2001. Recombinant hepatitis E virus genomes infectious for primates: importance of capping and discovery of a cis-reactive element. Proc. Natl. Acad. Sci. U. S. A. 98:15270–15275. 10.1073/pnas.251555098 [DOI] [PMC free article] [PubMed] [Google Scholar]
- 12.Emerson SU, Nguyen H, Graff J, Stephany DA, Brockington A, Purcell RH. 2004. In vitro replication of hepatitis E virus (HEV) genomes and of an HEV replicon expressing green fluorescent protein. J. Virol. 78:4838–4846. 10.1128/JVI.78.9.4838-4846.2004 [DOI] [PMC free article] [PubMed] [Google Scholar]
- 13.Huang YW, Haqshenas G, Kasorndorkbua C, Halbur PG, Emerson SU, Meng XJ. 2005. Capped RNA transcripts of full-length cDNA clones of swine hepatitis E virus are replication competent when transfected into Huh7 cells and infectious when intrahepatically inoculated into pigs. J. Virol. 79:1552–1558. 10.1128/JVI.79.3.1552-1558.2005 [DOI] [PMC free article] [PubMed] [Google Scholar]
- 14.Tanaka T, Takahashi M, Kusano E, Okamoto H. 2007. Development and evaluation of an efficient cell-culture system for hepatitis E virus. J. Gen. Virol. 88:903–911. 10.1099/vir.0.82535-0 [DOI] [PubMed] [Google Scholar]
- 15.Tanaka T, Takahashi M, Takahashi H, Ichiyama K, Hoshino Y, Nagashima S, Mizuo H, Okamoto H. 2009. Development and characterization of a genotype 4 hepatitis E virus cell culture system using a HE-JF5/F strain recovered from a fulminant hepatitis patient. J. Clin. Microbiol. 47:1906–1910. 10.1128/JCM.00629-09 [DOI] [PMC free article] [PubMed] [Google Scholar]
- 16.Shukla P, Nguyen HT, Torian U, Engle RE, Faulk KN, Dalton HR, Bendall RP, Keane FE, Purcell RH, Emerson SU. 2011. Cross-species infections of cultured cells by hepatitis E virus and discovery of an infectious virus-host recombinant. Proc. Natl. Acad. Sci. U. S. A. 108:2438–2443. 10.1073/pnas.1018878108 [DOI] [PMC free article] [PubMed] [Google Scholar]
- 17.Shukla P, Nguyen HT, Faulk K, Mather K, Torian U, Engle RE, Emerson SU. 2012. Adaptation of a genotype 3 hepatitis E virus to efficient growth in cell culture depends on an inserted human gene segment acquired by recombination. J. Virol. 86:5697–5707. 10.1128/JVI.00146-12 [DOI] [PMC free article] [PubMed] [Google Scholar]
- 18.Emerson SU, Nguyen H, Torian U, Purcell RH. 2006. ORF3 protein of hepatitis E virus is not required for replication, virion assembly, or infection of hepatoma cells in vitro. J. Virol. 80:10457–10464. 10.1128/JVI.00892-06 [DOI] [PMC free article] [PubMed] [Google Scholar]
- 19.Purcell RH, Emerson SU. 2001. Animal models of hepatitis A and E. ILAR J. 42:161–177. 10.1093/ilar.42.2.161 [DOI] [PubMed] [Google Scholar]
- 20.Yamashita T, Mori Y, Miyazaki N, Cheng RH, Yoshimura M, Unno H, Shima R, Morishi K, Li TC, Takeda N, Miyamura T, Matsuura Y. 2009. Biological and immunological characteristics of hepatitis E virus-like particles based on the crystal structure. Proc. Natl. Acad. Sci. U. S. A. 106:12986–12991. 10.1073/pnas.0903699106 [DOI] [PMC free article] [PubMed] [Google Scholar]
- 21.Guu TS, Liu Z, Ye Q, Mata DA, Li K, Yin C, Zhang J, Tao YJ. 2009. Structure of the hepatitis E virus-like particle suggests mechanisms for virus assembly and receptor binding. Proc. Natl. Acad. Sci. U. S. A. 106:12992–12997. 10.1073/pnas.0904848106 [DOI] [PMC free article] [PubMed] [Google Scholar]
- 22.Xing L, Li TC, Miyazaki N, Simon MN, Wall JS, Moore M, Wang CY, Takeda N, Wakita T, Miyamura T, Cheng RH. 2010. Structure of hepatitis E virion-sized particle reveals an RNA-dependent viral assembly pathway. J. Biol. Chem. 285:33175–33183. 10.1074/jbc.M110.106336 [DOI] [PMC free article] [PubMed] [Google Scholar]
- 23.He S, Miao J, Zheng Z, Wu T, Xie M, Tang M, Zhang J, Ng M-H, Xia N. 2008. Putative receptor-binding sites of hepatitis E virus. J. Gen. Virol. 89:245–249. 10.1099/vir.0.83308-0 [DOI] [PubMed] [Google Scholar]
- 24.Arankalle VA, Goverdhan MK, Banerjee K. 1994. Antibodies against hepatitis E virus in Old World monkeys. J. Viral. Hepat. 1:125–129. 10.1111/j.1365-2893.1994.tb00111.x [DOI] [PubMed] [Google Scholar]
- 25.Huang F, Yu W, Hua X, Jing S, Zeng W, He Z. 2011. Seroepidemiology and molecular characterization of hepatitis E virus in Macacca mulatta from a village in Yunnan, China where infection with this virus is endemic. Hepat. Mon. 11:745–749. 10.5812/kowsar.1735143X.730 [DOI] [PMC free article] [PubMed] [Google Scholar]
- 26.Hirano M, Ding X, Tran HT-T, Li T-C, Takeda N, Sata T, Nakamura S, Abe K. 2003. Prevalence of antibody against hepatitis E in various species of non-human primates: evidence of widespread infection in Japanese monkeys (Macacca fuscata). Jpn. J. Infect. Dis. 56:8–11 [PubMed] [Google Scholar]
- 27.Yamamoto H, Suzuki J, Matsuda A, Ishida T, Ami Y, Suzaki Y, Adachi I, Wakita T, Takeda N, Li T-C. 2012. Hepatitis E virus outbreak in monkey facility, Japan. Emerg. Infect. Dis. 18:2032–2034. 10.3201/eid1812.120884 [DOI] [PMC free article] [PubMed] [Google Scholar]
- 28.Teshale EH, Hu DJ, Holmberg SD. 2010. The two faces of hepatitis E virus. Clin. Infect. Dis. 51:328–334. 10.1086/653943 [DOI] [PubMed] [Google Scholar]
- 29.Napier JR, Napier PH. 1967. Macacca, p 207–219 In A handbook of living primates. Academic Press, New York, NY [Google Scholar]
- 30.Nomoto A, Koike S, Aoki J. 1994. Tissue tropism and species specificity of poliovirus infection. Trends Microbiol. 2:47–51. 10.1016/0966-842X(94)90125-2 [DOI] [PubMed] [Google Scholar]